. 2022 May;45(3):635-656.
doi: 10.1002/jimd.12485. Epub 2022 Mar 17.

Ppt1-deficiency dysregulates lysosomal Ca++ homeostasis contributing to pathogenesis in a mouse model of CLN1 disease

Affiliations

Ppt1-deficiency dysregulates lysosomal Ca++ homeostasis contributing to pathogenesis in a mouse model of CLN1 disease

Avisek Mondal et al. J Inherit Metab Dis. 2022 May.

Abstract

Inactivating mutations in the PPT1 gene encoding palmitoyl-protein thioesterase-1 (PPT1) underlie the CLN1 disease, a devastating neurodegenerative lysosomal storage disorder. The mechanism of pathogenesis underlying CLN1 disease has remained elusive. PPT1 is a lysosomal enzyme, which catalyzes the removal of palmitate from S-palmitoylated proteins (constituents of ceroid lipofuscin) facilitating their degradation and clearance by lysosomal hydrolases. Thus, it has been proposed that Ppt1-deficiency leads to lysosomal accumulation of ceroid lipofuscin leading to CLN1 disease. While S-palmitoylation is catalyzed by palmitoyl acyltransferases (called ZDHHCs), palmitoyl-protein thioesterases (PPTs) depalmitoylate these proteins. We sought to determine the mechanism by which Ppt1-deficiency may impair lysosomal degradative function leading to infantile neuronal ceroid lipofuscinosis pathogenesis. Here, we report that in Ppt1-/- mice, which mimic CLN1 disease, low level of inositol 3-phosphate receptor-1 (IP3R1) that mediates Ca++ transport from the endoplasmic reticulum to the lysosome dysregulated lysosomal Ca++ homeostasis. Intriguingly, the transcription factor nuclear factor of activated T-cells, cytoplasmic 4 (NFATC4), which regulates IP3R1-expression, required S-palmitoylation for trafficking from the cytoplasm to the nucleus. We identified two palmitoyl acyltransferases, ZDHHC4 and ZDHHC8, which catalyzed S-palmitoylation of NFATC4. Notably, in Ppt1-/- mice, reduced ZDHHC4 and ZDHHC8 levels markedly lowered S-palmitoylated NFATC4 (active) in the nucleus, which inhibited IP3R1-expression, thereby dysregulating lysosomal Ca++ homeostasis. Consequently, Ca++ -dependent lysosomal enzyme activities were markedly suppressed. Impaired lysosomal degradative function impaired autophagy, which caused lysosomal storage of undigested cargo. Importantly, IP3R1-overexpression in Ppt1-/- mouse fibroblasts ameliorated this defect. Our results reveal a previously unrecognized role of Ppt1 in regulating lysosomal Ca++ homeostasis and suggest that this defect contributes to pathogenesis of CLN1 disease.

Keywords: Batten disease; S-palmitoylation; infantile neuronal ceroid lipofuscinosis; lysosomal storage disease; neurodegeneration; neuronal ceroid lipofuscinosis; palmitoyl-protein thioesterase-1.


Conflict of interest statement

Competing interests. All authors declare no competing interest in this research.

Figures

FIGURE 1
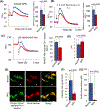
FIGURE 1. Defective lysosomal calcium homeostasis in INCL fibroblasts.
Normal and INCL fibroblasts, respectively, were loaded with the dye provided by FLIPR® Calcium 6 Assay Kit. The cells were then treated with the indicated pharmacological agents, GPN (A), Bafilomycin A1 (B) and NAADP-AM (C) to release Ca++ at the specified time shown by an arrow. Note that all the pharmacological agents used elevated cytosolic Ca++ in normal fibroblasts (blue) but not in INCL fibroblasts (red). The curves shown here are the mean of three independent measurements for both normal and INCL fibroblasts. The corresponding bar graph shows quantification of Ca++ release induced by the pharmacological agents from the normal and INCL fibroblasts (data are presented as the mean (n = 3) ± SD, p<0.05). (D), Lysosomal pH in normal and INCL fibroblasts. Note that the lysosomal pH in INCL fibroblasts is significantly higher compared with that in normal fibroblasts (Normal: ~ 4.2 versus INCL: ~ 5.2, n= 3, p<0.05). (E), Confocal imaging showing intralumenal Ca++ in normal and INCL fibroblasts; Green, Ca++-sensitive Oregon Green 488 BAPTA-1 dextran (OGD); Red, Ca++-insensitive Rhod-dextran; Inset in the right panel shows colocalization of the two dyes in lysosomes (n=30 for normal and n=30 for INCL, p<0.05; scale bars 20 µm). (F), Intensity ratio of green vs red fluorescence from Normal and INCL fibroblasts. (G), Ca++ concentration in the intralumenal acidic compartment in normal and INCL fibroblasts. Note that lysosomal Ca++ in INCL fibroblasts is substantially lower compared with that in normal fibroblasts (n=30 for normal and n=30 for INCL, p<0.05).
FIGURE 2
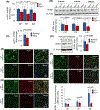
FIGURE 2. Reduced level of IP3R1-mRNA, IP3R1-protein in the brain of Ppt1−/− mice.
(A), IP3R1-mRNA and (B), Western blot analysis of IP3R1-protein in the brain of WT and Ppt1−/− mice at 2-, 4- and 6- month of age (n=4 animals in each group, p<0.05; NS=non-significant). (C), IP3R1-mRNA expression and (D), IP3R1-protein levels in normal and INCL-fibroblasts (data are presented as the mean ± SD (n = 3), p<0.05). Immunohistochemical analysis of IP3R1 expression in the brain from 2- (E), 4- (F) and 6-month-old (G) WT (upper panels) and Ppt1−/− (lower panels) mice. Fifteen randomly chosen different regions in cortical sections (CA1 region) from each group of animals were analyzed (n=4 animals in each group, p<0.05). Note that the IP3R1-expression (red) in the neurons (green) immuno-stained with Neuronal nuclei (NeuN) marker is significantly lower in Ppt1−/− mice compared with that in the WT littermates.
FIGURE 3
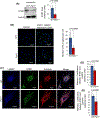
FIGURE 3. Lysosomal- and ER- localization of IP3R1 in the brain of WT and Ppt1−/− mice.
(A), Lysosomal IP3R1 level in the brain of WT mice and in that of their Ppt1−/− littermates (n=4 animals in each group, p<0.05; NS=non-significant). (B), Confocal imaging of cultured fibroblasts cells isolated from WT and Ppt1−/− mouse were performed to determine interaction of IP3R1 with LAMP2 by PLA reaction (n= 74 for WT and n=62 for Ppt1−/−, p<0.001; scale bars, 50µm). The green dots are the positive signals in PLA reactions, showing IP3R1–LAMP2 interaction in WT and Ppt1−/− cells. WT and Ppt1−/− cells with no primary antibody served as the controls. (C), Colocalization of IP3R1 with the lysosomal marker, LAMP2 and with ER-marker, calnexin in fibroblasts from WT and Ppt1−/− mice. Colocalization of IP3R1 with LAMP2 (D) and calnexin (E) was assessed using the Manders’ coefficients (n=20 for WT and n=30 for Ppt1−/−, p<0.05; scale bars, 20µm).
Figure 4.
Figure 4.. Enhanced NFATC4- phosphorylation in Ppt1−/− mice suppresses nuclear translocation.
Levels of NFATC4 protein in the nuclear fraction (A), cytosolic fraction (B) and in total cortical lysates (C) from WT and Ppt1−/− mice. (n=4, p<0.05; NS=non-significant). (D), Phospho-NFATC4 levels in the brain of WT and Ppt1−/− mice (n=4, p<0.05; NS=non-significant). (E), Phospho-NFATC4 levels in normal and INCL fibroblasts (n = 3; p<0.05). (F), Colocalization of NFATC4 with nuclear marker, DAPI in fibroblasts from WT and Ppt1−/− mice using Manders’ colocalization coefficients (n=20 for WT and n=30 for Ppt1−/−, p<0.05; scale bars, 20µm). Pancadherin was used as membrane marker. Protein levels of Calcineurin (G) and Calmodulin (H) in total brain tissue lysate from WT and Ppt1−/− mice. The values are expressed as the mean ±SD (n=4 animals in each group, p<0.05; NS=non-significant). (I), Level of p38MAPK and phopho-p38MAPK levels in the brain of Ppt1−/− mice compared with that in WT littermates. (n=4 animals in each group, p<0.05; NS=non-significant).
FIGURE 5
FIGURE 5. Reduced S-palmitoylated NFATC4 suppresses its nuclear translocation in Ppt1−/− mice.
(A), Analysis of NFATC4 S-palmitoylation in WT mouse brain by Acyl-Rac assay. (B), Acyl Rac assay of WT and mutant (C43A) NFATC4 to determine the S-pamitoylated residue. (C), Colocalization of Flag-NFATC4 and Flag-NFATC4 mutant (C43A) with nuclear marker, DAPI, in WT (upper panels) and Ppt1−/− (lower panels) mouse fibroblasts. Colocalization was assessed by Manders’ colocalization coefficients (n=20 for WT and Ppt1−/−, p<0.05; scale bars, 20µm). (D), Level of S-palmitoylated NFATC4 in the cytoplasmic and nuclear fractions of WT mouse brain. GAPDH and Histone H3 were used as the markers for cytoplasmic and nuclear fractions, respectively. Palm–NFATC4 bands indicates S-palmitoylated NFATC4. Note that the nuclear level of S-palmitoylated NFATC4 is significantly high compared to cytosolic level. (E), S-palmitoylated NFATC4 in the nuclear fraction of WT and Ppt1−/− mouse brain (n=4 animals in each group, p<0.05; NS, Non-significant). (F), S-palmitoylation status of NFATC4 in WT and Ppt1−/− mouse brain. NP, non-palmitoylated and P, S-palmitoylated, respectively (n=4 animals in each group, p<0.05; NS=non-significant). (G), Levels of S-palmitoylated NFATC4 in normal and INCL fibroblasts (n = 3), p<0.05).
FIGURE 6
FIGURE 6. Identification of ZDHHC(s), catalyzing S-palmitoylation of NFATC4.
(A), Identification of candidate ZDHHCs that may catalyze S-palmitoylation of NFATC4. Acyl Rac assay to detect S-palmitoylation of NFATC4 expressed in HEK293T cells co-transfected with FLAG-NFATC4 and HA-ZDHHC constructs. Top panel: quantitation of S-palmitoylated NFATC4 catalyzed by each of the 23 ZDHHCs. S-palmitoylation is normalized to the amount of total S-palmitoylated NFATC4 in cells transfected with the empty vector (#0). The dotted line indicates markedly higher level of S-palmitoylated NFATC4 in cells transfected with putative ZDHHCs catalyzing S-palmitoylation compared with those levels in cells transfected with the empty vector. In the second panel, Western blot of S-palmitoylated NFATC4 (Palm-NFATC4) from a representative Acyl Rac assay in which all 23 ZDHHC proteins are shown. In the third panel, a corresponding immunoblot comparing total amounts of NFATC4 in the same reactions (NFATC4 input) are shown. In the fourth panel, a corresponding immunoblot in which various ZDHHC proteins tagged with HA (HA-ZDHHCs) are shown. Note that in the first screening, a markedly higher level of NFATC4 S-palmitoylation was observed (indicated by an asterisk) only with ZDHHCs 2-, 4-, 6-, 8-, 9-, 11-, and 22. (B), HEK293T cells were co-transfected with Flag-NFATC4 and HA-ZDHHCs (ZDHHC 2-, 4-, 6-, 8-, 9-,11- and 22- and the nuclear fraction was isolated for Acyl Rac assay followed by quantification of S-palmitoylated NFATC4 in the nuclear fraction catalyzed with ZDHHC2, ZDHHC4, ZDHHC6, ZDHHC8, ZDHHC9, ZDHHC11 and ZDHHC22, normalized to the amount of NFATC4 observed with an empty vector (#0). Note that in the second screen, the levels of only ZDHHCs 4, 8, and 11 elevated S-palmitoylation of NFATC4 compared to the other ZDHHCs. Levels of ZDHHC4 (C) and ZDHHC8 (D) in WT and Ppt1−/− mouse brain (n = 4 animals of each group, p < 0.05). The effect of shRNA suppression of ZDHHC8 (E) and ZDHHC4 (F) on NFATC4 S-palmitoylation in HEK293T cells. Note that shRNA treatment efficiently suppressed S-palmitoylation of NFATC4 while the scrambled shRNA failed to do so. Levels of DHHC4 (G) and DHHC8 (H) in normal and INCL fibroblasts (data are presented as mean ± SD (n = 3; p<0.05).
FIGURE 7
FIGURE 7. Dysregulation of autophagy in Ppt1−/− mouse brain and in INCL patient’s fibroblasts.
(A), Level of LC3-I and LC3-II in the brain of WT and Ppt1−/− mice. Note LC3-II level is increased significantly in Ppt1−/− mouse brain compared to WT. The values are expressed as the mean ± SD (n=4 animals in each group, p<0.05; NS=non-significant). (B), LC3-I and LC3-II levels in normal and INCL fibroblasts (data are presented as mean ± SD (n = 3), p<0.05). (C), Immunostaining of LC3 was performed using cultured fibroblasts from normal subjects (upper panels) and INCL fibroblasts (lower panels). The cells were either grown in complete medium or without serum (starved) medium and stained with LC3 antibody. Note that the levels of LC3 positive puncta were markedly elevated in serum starved INCL fibroblasts as compared to normal fibroblasts (n=20 cells for normal and 20 cells for INCL, p<0.05: scale bars, 20µm). (D), Level of p62/SQSTM1 in the brain of WT and Ppt1−/− mice. (E), Level of p62/SQSTM1 in the normal and INCL fibroblasts.
FIGURE 8:
FIGURE 8:. IP3R1-overexpression in INCL fibroblasts ameliorates defective lysosomal Ca++ homoeostasis and autophagy.
Calcium efflux from the lysosomes were measured using normal, and patient fibroblasts by treating the cells with Bafilomycin A1 (A) and NAADP-AM (B) at the specified time period shown by the arrow. Note that INCL cells overexpressing IP3R1 (denoted by INCL+ IP3R1) significantly increases Ca++ release from the lysosomes compared to that of control INCL cells. (C), Level of LC3-II in normal, INCL, and INCL fibroblasts overexpressing IP3R1 (data are presented as mean (n = 3) ± SD, p<0.05). (D), Immunostaining of LC3 was performed in normal, INCL, and INCL cells overexpressing IP3R1. Note that the level of LC3 was significantly reduced in those INCL cells which overexpressed IP3R1 (n=20 for normal, INCL, and INCL cells overexpressing IP3R1, p<0.05; scale bars, 20µm). (E), Enzymatic activity of cathepsin D (CD) in the lysosomal fractions isolated from WT and Ppt1−/− mouse cerebral cortex. (F), Enzymatic activity of tripeptidyl peptidase-1 (TPP1) in the lysosomal fractions isolated from WT and Ppt1−/− mouse cerebral cortex (n = 4 animals of each group, p<0.05).
Figure 9:
Figure 9:. A Schematic showing NFATC4-mediated IP3R1-expression, dysregulation of which disrupts lysosomal Ca++-homeostasis in Ppt1−/− mice.
In Ppt1−/− mouse brain, due to reduced levels of two palmitoyl acyl transferase enzymes (i.e., ZDHHC4 and ZDHHC8), suppress S-palmitoylation of NFATC4, preventing its translocation from the cytosol to the nucleus. This defect dysregulates Ip3r1 expression, thereby suppressing the transport of Ca++ from the ER to the lysosome. CaN, Calcineurin; CaM, Calmodulin; ER, Endoplasmic reticulum; p-MAPK, phosphorylated mitogen-activated protein kinase.

Similar articles

Cited by

References

    1. De Duve C & Wattiaux R Functions of lysosomes. Annu. Rev. Physiol 1966; 28: 435–492. - PubMed
    1. Mukherjee AB, et al. Emerging new roles of the lysosome and neuronal ceroid lipofuscinoses. Mol Neurodegener 14, 4 (2019). - PMC - PubMed
    1. Parenti G, Andria G & Ballabio A Lysosomal storage diseases: from pathophysiology to therapy. Annu Rev Med 2015; 66: 471–486. - PubMed
    1. Platt FM, Boland B & van der Spoel AC The cell biology of disease: lysosomal storage disorders: the cellular impact of lysosomal dysfunction. J. Cell Biol 2012; 199: 723–734. - PMC - PubMed
    1. Futerman AH & van Meer G The cell biology of lysosomal storage disorders. Nat Rev Mol Cell Biol 2004; 5: 554–565 - PubMed

Publication types