. 2022 Feb 11;18(2):e1010277.
doi: 10.1371/journal.ppat.1010277. eCollection 2022 Feb.

The actin nucleator Spir-1 is a virus restriction factor that promotes innate immune signalling

Affiliations

The actin nucleator Spir-1 is a virus restriction factor that promotes innate immune signalling

Alice A Torres et al. PLoS Pathog. .

Abstract

Cellular proteins often have multiple and diverse functions. This is illustrated with protein Spir-1 that is an actin nucleator, but, as shown here, also functions to enhance innate immune signalling downstream of RNA sensing by RIG-I/MDA-5. In human and mouse cells lacking Spir-1, IRF3 and NF-κB-dependent gene activation is impaired, whereas Spir-1 overexpression enhanced IRF3 activation. Furthermore, the infectious virus titres and sizes of plaques formed by two viruses that are sensed by RIG-I, vaccinia virus (VACV) and Zika virus, are increased in Spir-1 KO cells. These observations demonstrate the biological importance of Spir-1 in the response to virus infection. Like cellular proteins, viral proteins also have multiple and diverse functions. Here, we also show that VACV virulence factor K7 binds directly to Spir-1 and that a diphenylalanine motif of Spir-1 is needed for this interaction and for Spir-1-mediated enhancement of IRF3 activation. Thus, Spir-1 is a new virus restriction factor and is targeted directly by an immunomodulatory viral protein that enhances virus virulence and diminishes the host antiviral responses.


Conflict of interest statement

The authors have declared that no competing interests exist

Figures

Fig 1
Fig 1. Spir-1 co-immunoprecipitates VACV protein K7 via its C-terminal region.
HEK293T cells were transfected (A, B, and D) with Myc-tagged and FLAG-tagged plasmids overnight. Cell lysates were immunoprecipitated using either Myc (A and D–right panel) or FLAG affinity resins (B and D–middle panel) and analysed by SDS-PAGE and immunoblotting. (C) Schematic representations of hSpir-1 isoform 2 full-length (top) and its C- and N-terminal truncations. (E) HEK293T cells were either mock-infected or infected at 5 or 10 PFU/cell with vHA-K7 or vHA-B14 for 4 h. Lysates were immunoprecipitated using HA-affinity resin and analysed by SDS-PAGE and immunoblotting. In (A), (B), (D) and (E) the positions of molecular mass markers in kDa are shown on the left. Each experiment was done 3 times and representative results are shown.
Fig 2
Fig 2. Ectopic expression of Spir-1 increases IRF3-dependent gene expression induced by other stimuli, at or downstream of MAVS.
HEK293T cells were transfected with IFNβ (A), ISRE (B) and NF-κB (C) firefly luciferase reporter plasmids, together with TK-renilla luciferase and 40 ng of the plasmids for expression of the indicated proteins. After overnight transfection, cells were stimulated with SeV for 24 h (A), IFNα (B) or TNF-α (C) for 8 h. (D-I) HEK293T cells were transfected with the ISG56.1 firefly luciferase reporter plasmid, TK-renilla luciferase and plasmids for expression of the indicated proteins. Cells were also co-transfected with EV as the non-stimulated (NS) controls or with the 5 ng of CARD-domain of RIG-I (D, E and I), 40 ng of MAVS (F), 40 ng of TBK-1 (G) and 5 ng of IRF3-5D (H) plasmids to activate the IRF3 pathway. EV was added to samples when necessary to keep the final amount of DNA transfected as 40 ng in all samples. Cell lysates were prepared and luciferase expression was measured and normalised to renilla luciferase. Data shown are representative of three independent experiments. Each independent experiment was done with a minimal of three wells for each condition and the statical analysis was done within a single experiment. Data are expressed as the mean (± SD) fold induction of the firefly luciferase activity normalised to renilla values for the stimulated versus non-stimulated samples. Immunoblots underneath each graph show the expression levels of the different proteins. The positions of molecular mass markers in kDa are shown on the right and the antibodies used are shown on the left. ns = not significant; *P < 0.05; **P < 0.01, ****P < 0.0001.
Fig 3
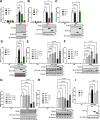
Fig 3. Spir-1 and DDX3 share a conserved diphenylalanine motif that is required for IRF3 activation and direct binding to K7.
(A) DDX3 knockdown was induced in HEK293T cells stably transfected with pTRIPZ-shDDX3 (or a NSC pTRIPZ vector) through incubation with doxycycline for 48 h. Twenty-four h after doxycycline addition, cells were transfected with FLAG-tagged plasmids overnight. Cell lysates were immunoprecipitated using FLAG-affinity resin and analysed by SDS-PAGE and immunoblotting. (B) DDX3 knockdown was induced in HEK293T shDDX3 cells as in (A) and cells were then transfected with ISG56.1-firefly luciferase reporter, TK-renilla luciferase, plasmids for expression of the indicated proteins together with the CARD-domain of RIG-I. Cell lysates were prepared and analysed as in Fig 2. Immunoblots underneath the graph show the expression levels of the different proteins. (C) Alignment of amino acid residues of Spir-1 and DDX3 showing the conserved diphenylalanine motif. (D) HEK293T cells were transfected overnight with Myc-tagged Spir-1 wild type, GFP or Spir-1 mutant FFAA together with FLAG-K7. Cell lysates were immunoprecipitated using either Myc (middle panel) or FLAG-affinity resins (right panel) and analysed by SDS-PAGE and immunoblotting. (E) HEK293T cells were transfected with ISG56.1 firefly luciferase reporter, TK-renilla luciferase, plasmids for expression of the indicated proteins together with the CARD-domain of RIG-I or EV as the NS control. Cell lysates were prepared and analysed as in (B). The panel underneath the graph shows immunoblots for the expression level of Spir-1 and GAPDH. (F and G) Myc or FLAG-tagged proteins were synthesized by in vitro transcription/translation. Samples were immunoprecipitated using FLAG- (F) or Myc-affinity resins (G) and analysed by SDS-PAGE and immunoblotting. For all immunoblots, the positions of molecular mass markers in kDa are shown on the left and the antibodies used on the right. ns = not significant; *P<0.05, ****P < 0.0001. HC/LC: IgG heavy chain or light chain, respectively.
Fig 4
Fig 4. K7 residue Asp31 is important for binding to Spir-1 and DDX3 and inhibition of IRF3 activation.
HEK293T cells were transfected with FLAG-tagged GFP, K7 wild type or mutants, Myc-Spir-1 and HA-DDX3 (A) or with only FLAG-tagged plasmids overnight (B). Cell lysates were immunoprecipitated using FLAG-affinity resin and analysed by SDS-PAGE and immunoblotting. The positions of molecular mass markers in kDa are shown on the left and the antibodies used on the right. (C) HEK293T cells were transfected with ISG56.1-firefly luciferase reporter, TK-renilla luciferase, plasmids for expression of the indicated proteins together with the CARD-domain of RIG-I or EV as the NS control. Cell lysates were prepared and analysed as in Fig 2. Statistical analyses compared the fold induction of the mutant sample to its respective K7 wild type. The panel underneath the graph shows immunoblots for the expression levels of the different K7 proteins and α-tubulin. The positions of molecular mass markers in kDa are shown on the right and the antibodies used on the left. ns = not significant; ****P < 0.0001. LC: IgG light chain.
Fig 5
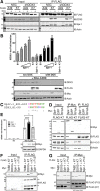
Fig 5. Spir-1 contributes to IRF3 phosphorylation and IRF3 stimulated gene expression after SeV infection in HEK293T cells.
(A) Schematic of CRISPR-Cas9-mediated knockout strategy targeting Spire1 exon 3 and single allele sequences of HEK293T Spir-1 knockout (KO) cells. (B-G) Spir-1 knockout (KO) HEK293T cells were transduced with empty vector (EV) or Myc-Spir-1 lentiviruses to rescue Spir-1 expression. Cells lines were either non-infected (NS) or infected with SeV for the indicated times. Cells were then either lysed and analysed by immunoblotting (B) or subjected to total RNA extraction followed by RT-qPCR (C-F). Supernatants were analysed by ELISA (G). (H) Spir-1 KO or wild type (WT) HEK293T cells were stimulated overnight with TNFα and supernatants were analysed by ELISA. All experiments were done at least three times. qPCR data are shown as the mean (± SD) fold induction of stimulated versus non-stimulated cells from two individual wells within one experiment. ELISA data are shown as the mean (± SD) values of three individual wells within one experiment. ns = not significant, **P < 0.01, ***P < 0.001, ****P < 0.0001.
Fig 6
Fig 6. IRF3 activation is reduced in Spir-1 KO MEFs.
Spir-1 WT or KO MEF cells were transfected with poly I:C (A, C-F, and J-K) or infected with SeV (B, G-I, and L-M) for the indicated times. Cells were lysed and analysed by immunoblotting (A and B) and blots shown are representative of three independent experiments. Phospho-IRF3 bands intensity was quantified and normalised by the intensity of α-tubulin from three different experiments and expressed as the mean (± SD) fold induction of stimulated versus non-stimulated cells (A and B, bottom graphs). The positions of molecular mass markers in kDa are shown on the left and the antibodies used on the right. Cells were also subjected to total RNA extraction followed by RT-qPCR (C-I) and supernatants were analysed by ELISA (J-M). (N and O) Spir-1 WT or KO MEF cells were stimulated with IL-1β for 8 h and supernatants were analysed by ELISA. qPCR data are shown as the mean (± SD) fold induction of stimulated versus non-stimulated cells from at least three individual wells within one experiment. ELISA data are shown as the mean (± SD) values from three individual wells of cells within one experiment. All experiments were done at least three times. ns = not significant, **P < 0.01, ***P < 0.001, ****P < 0.0001.
Fig 7
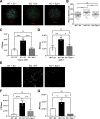
Fig 7. Spir-1 is a cellular restriction factor for VACV and ZIKV.
(A, B) Spir-1 WT or KO and Spir-1 KO complemented HEK293T cells were infected with VACV-A5-GFP and plaque diameters were measured at 48 h p.i. (A) Representative plaques formed in each cell line. (B) Plaques diameter measurements (n = 54). (C and D) Spir-1 WT or KO and Spir-1 KO complemented HEK293T cells were infected with VACV WR (C) or VACVΔK7 (D) at 0.001 PFU/cell for 48 h and the virus yield was measured in BSC-1 cells. ns = not significant, *P<0.05, **P < 0.01, ***P < 0.001, ****P < 0.0001. (E-G) Spir-1 WT or KO and Spir-1 KO complemented HEK293T cells were infected with ZIKV-mCherry at 0.01 PFU/cell (E-F) or at 2 PFU/cell (G) for 72 h and ZIKV-infected monolayers were imaged (E) or the virus yield was measured in VERO E6 cells (F-G). ns = not significant, *P<0.05, **P < 0.01, ***P < 0.001, ****P < 0.0001.

Similar articles

Cited by

References

    1. Janeway CA Jr., Medzhitov R. Innate immune recognition. Annu Rev Immunol. 2002;20:197–216. doi: 10.1146/annurev.immunol.20.083001.084359 - DOI - PubMed
    1. Pang IK, Iwasaki A. Control of antiviral immunity by pattern recognition and the microbiome. Immunol Rev. 2012;245(1):209–26. doi: 10.1111/j.1600-065X.2011.01073.x - DOI - PMC - PubMed
    1. Thompson MR, Kaminski JJ, Kurt-Jones EA, Fitzgerald KA. Pattern recognition receptors and the innate immune response to viral infection. Viruses. 2011;3(6):920–40. doi: 10.3390/v3060920 - DOI - PMC - PubMed
    1. Randall RE, Goodbourn S. Interferons and viruses: an interplay between induction, signalling, antiviral responses and virus countermeasures. J Gen Virol. 2008;89(Pt 1):1–47. doi: 10.1099/vir.0.83391-0 - DOI - PubMed
    1. Garcia-Sastre A. Ten Strategies of Interferon Evasion by Viruses. Cell Host Microbe. 2017;22(2):176–84. doi: 10.1016/j.chom.2017.07.012 - DOI - PMC - PubMed

Publication types