Computed tomography scan in COVID-19: a systematic review and meta-analysis
- PMID: 35140824
- PMCID: PMC8814899
- DOI: 10.5114/pjr.2022.112613
Computed tomography scan in COVID-19: a systematic review and meta-analysis
Abstract
Purpose: Computed tomography (CT) scan is a commonly used tool for the diagnosis of the novel coronavirus disease 2019 (COVID-19), similarly to reverse transcription-polymerase chain reaction (RT-PCR). Because of the limitations of RT-PCR, there is growing interest in the usability of the CT scan. The present systematic review and meta-analysis aims to summarize the available data on the CT scan features of COVID-19.
Material and methods: We conducted a systematic search in electronic databases to find eligible studies published between 1 December 2019 and 4 April 2020, which investigated the computed tomographic features of patients with COVID-19. All preprint and peer-reviewed articles were included. No language limitation was applied. For proportional data, pooled prevalence was calculated using a Freeman-Tukey double arcsine transformation, with a 95% confidence interval (CI).
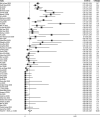
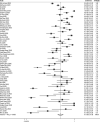
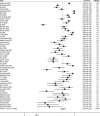
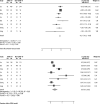
Results: Eighty-six studies were eligible to be included in the meta-analysis. For 7956 patients, the most common CT findings were bilateral pattern of involvement (78%; 95% CI: 0.73-0.82; p < 0.001), involvement of more than 1 lobe (75%; 95% CI: 0.68-0.82; p < 0.001), ground-glass opacities (GGO) (73%; 95% CI: 0.67-0.78; p < 0.001), and peripheral distribution of signs (69%; 95% CI: 0.61-0.76; p < 0.001). Only 5% of patients had a normal CT scan (95% CI:0.03-0.07; p < 0.001). The proportion of paediatric patients (age < 18 years) with unremarkable CT findings was higher (40%; 95% CI: 0.27-0.55; p < 0.001). Subgroup analysis showed that patients with the severe or critical type of COVID-19 were more likely to have pleural effusion (RR 7.77; 95% CI: 3.97-15.18; p < 0.001) and consolidation (RR 3.13; 95% CI: 1.57-6.23; p < 0.001). CT results in patients with COVID-19 were comparable with those of people having pneumonia from other causes, except for the lower incidence of consolidation (RR 0.81; 95% CI: 0.71-0.91; p < 0.001) and higher risk of showing GGO (RR 1.45; 95% CI: 1.13-1.86; p < 0.001). The mortality rate was slightly higher in patients with bilateral involvement (RR 3.19; 95% CI: 1.07-9.49; p = 0.04).
Conclusions: Our study results show that COVID-19 shares some features with other viral types of pneumonia, despite some differences. They commonly present as GGO along with vascular thickening, air bronchogram and consolidations. Normal CT images, lymphadenopathies, and pleural effusions are not common. Consolidations and pleural effusions correlate with more severe disease. CT features are different between COVID-19 and non-COVID-19 pneumonia. Also, they differ by age, disease severity, and outcomes within COVID-19 patients.
Keywords: COVID-19; CT scan; SARS-CoV-2; computed tomography; ground-glass opacities; imaging; meta-analysis; paediatric; systematic review.
© Pol J Radiol 2022.
Conflict of interest statement
The authors report no conflict of interest.
Figures


Similar articles
-
Comparison of the computed tomography findings in COVID-19 and other viral pneumonia in immunocompetent adults: a systematic review and meta-analysis.Eur Radiol. 2020 Dec;30(12):6485-6496. doi: 10.1007/s00330-020-07018-x. Epub 2020 Jun 27. Eur Radiol. 2020. PMID: 32594211 Free PMC article.
-
Chest computed tomography scan findings of coronavirus disease 2019 (COVID-19) patients: a comprehensive systematic review and meta-analysis.Pol J Radiol. 2021 Jan 14;86:e31-e49. doi: 10.5114/pjr.2021.103379. eCollection 2021. Pol J Radiol. 2021. PMID: 33708271 Free PMC article. Review.
-
Computed Tomography (CT) Imaging Features of Patients with COVID-19: Systematic Review and Meta-Analysis.Radiol Res Pract. 2020 Jul 23;2020:1023506. doi: 10.1155/2020/1023506. eCollection 2020. Radiol Res Pract. 2020. PMID: 32733706 Free PMC article. Review.
-
Value of chest computed tomography scan in diagnosis of COVID-19; a systematic review and meta-analysis.Clin Transl Imaging. 2020;8(6):469-481. doi: 10.1007/s40336-020-00387-9. Epub 2020 Oct 12. Clin Transl Imaging. 2020. PMID: 33072656 Free PMC article. Review.
-
CT Features of Coronavirus Disease 2019 (COVID-19) Pneumonia in 62 Patients in Wuhan, China.AJR Am J Roentgenol. 2020 Jun;214(6):1287-1294. doi: 10.2214/AJR.20.22975. Epub 2020 Mar 5. AJR Am J Roentgenol. 2020. PMID: 32134681
Cited by
-
Prone Vs. Supine Position Ventilation in Intubated COVID-19 Patients: A Systematic Review and Meta-Analysis.Cureus. 2023 May 29;15(5):e39636. doi: 10.7759/cureus.39636. eCollection 2023 May. Cureus. 2023. PMID: 37388580 Free PMC article. Review.
-
CCL18, CHI3L1, ANG2, IL-6 systemic levels are associated with the extent of lung damage and radiomic features in SARS-CoV-2 infection.Inflamm Res. 2024 Apr;73(4):515-530. doi: 10.1007/s00011-024-01852-1. Epub 2024 Feb 3. Inflamm Res. 2024. PMID: 38308760
-
Factors Associated with COVID-19 Death in a High-Altitude Peruvian Setting during the First 14 Months of the Pandemic: A Retrospective Multicenter Cohort Study in Hospitalized Patients.Trop Med Infect Dis. 2023 Feb 22;8(3):133. doi: 10.3390/tropicalmed8030133. Trop Med Infect Dis. 2023. PMID: 36977134 Free PMC article.
-
Unraveling the Dynamics of SARS-CoV-2 Mutations: Insights from Surface Plasmon Resonance Biosensor Kinetics.Biosensors (Basel). 2024 Feb 13;14(2):99. doi: 10.3390/bios14020099. Biosensors (Basel). 2024. PMID: 38392018 Free PMC article. Review.
-
From symptom onset to ED departure: understanding the acute care chain for patients with undifferentiated complaints: a prospective observational study.Int J Emerg Med. 2024 Apr 15;17(1):55. doi: 10.1186/s12245-024-00629-x. Int J Emerg Med. 2024. PMID: 38622511 Free PMC article.
References
-
- Gorbalenya AE, Baker SC, Baric RS, et al. . Severe acute respiratory syndrome-related coronavirus: the species and its viruses–a statement of the Coronavirus Study Group. bioRxiv: 2020.2002. 2007.937862. doi: 10.1101/2020.02.07.937862. - DOI
-
- WHO . Rolling updates on coronavirus disease (COVID-19). 2020. Available at: https://www.who.int/emergencies/diseases/novel-coronavirus-2019/events-a....
-
- WHO . Coronavirus disease (COVID-2019) situation report 80. 2020. Available at: https://www.who.int/docs/default-source/coronaviruse/situation-reports/2....
Publication types
LinkOut - more resources
Full Text Sources
Miscellaneous
