. 2022 Feb 9;13(1):766.
doi: 10.1038/s41467-022-28341-5.

Human transcription factor protein interaction networks

Affiliations

Human transcription factor protein interaction networks

Helka Göös et al. Nat Commun. .

Abstract

Transcription factors (TFs) interact with several other proteins in the process of transcriptional regulation. Here, we identify 6703 and 1536 protein-protein interactions for 109 different human TFs through proximity-dependent biotinylation (BioID) and affinity purification mass spectrometry (AP-MS), respectively. The BioID analysis identifies more high-confidence interactions, highlighting the transient and dynamic nature of many of the TF interactions. By performing clustering and correlation analyses, we identify subgroups of TFs associated with specific biological functions, such as RNA splicing or chromatin remodeling. We also observe 202 TF-TF interactions, of which 118 are interactions with nuclear factor 1 (NFI) family members, indicating uncharacterized cross-talk between NFI signaling and other TF signaling pathways. Moreover, TF interactions with basal transcription machinery are mainly observed through TFIID and SAGA complexes. This study provides a rich resource of human TF interactions and also act as a starting point for future studies aimed at understanding TF-mediated transcription.


Conflict of interest statement

The authors declare no competing interests.

Figures
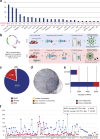
Fig. 1
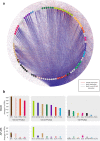
Fig. 1. TF protein interactome identified using the BioID and AP-MS methods.
a The distribution of the DNA-binding domains of the studied TFs. The corresponding proportion of each DNA-binding domain from 1639 TFs in the study of Lambert et al. is shown as a percentage value below the graph. b Schematic illustration of the analysis methods used to comprehensively map the physical and functional interactions formed by the TFs. The TFs were tagged N-terminally with MAC, StrepIII-HA or BirA -tags (Supplementary Data 1a) and cotransfected with Flp-In recombinase to generate stable isogenic and inducible cell lines. Cells were induced by tetracycline addition for the corresponding TF expression and for the BioID analysis supplemented with biotin for 24 h. This was followed by cell harvesting, lysis, and affinity purification with Strep-beads. Purified proteins were further digested into peptides and analyzed by LC–MS/MS. Proteins were later identified, quantified, and analyzed to distill the high-confidence interactors using different statistical and bioinformatic methods. c A total of 6503 high-confidence protein–protein interactions were detected only with the BioID method, 1336 with the AP-MS method, and 200 with both the BioID and AP-MS methods. d Localization of interacting prey-proteins from BioID data according to the annotated localizations of Cell Atlas. Yellow nodes (large circle) indicate nuclear localization, and red (small circle) indicates nonnuclear localization. Of the mapped proteins, >80% had nuclear localization. e Protein–protein interactions were identified using the AP-MS (1536) and BioID (6703) methods. Interactions were compared to interactions from the PINA2, IntAct, BioGRID, and String experimental protein interaction databases and to interactions from a study by Li et al., by Lambert et al., Malovannaya et al., and Huttlin et al. resulting in 220 and 1316 previously reported interactions in the AP-MS and BioID data, respectively. The proportions of known interactions are shown in red. f Number of high-confidence protein–protein interactions of different TF baits detected by AP-MS (red) or BioID (blue) affinity purification combined with mass spectrometry. Source data of the figure are provided as a Source Data file.
Fig. 2
Fig. 2. Comprehensive protein interactomes of the studied TF and TF families.
a Studied TFs are organized and color-coded (node color) based on their TF families in the inner circle, and interacting proteins are shown in the outer circle with white. Blue edges indicate interactions detected with the BioID analysis, red with the AP-MS analysis and green from both. b The average number of PPIs of different TF families detected by BioID and AP-MS. Note that the color coding of the TF families is the same as in a) and the TF families are organized into three bins based on the BioID data, first having families with 150-100 high-confidence interactions/bait TF, second 100-50, and third <50 interactions/TF. The stable interactions detected with AP-MS showed a correlation with the interaction numbers; however, the KLF family behaved differently, with a more than 2-fold higher number of average interactions than any other TF family. Source data of the figure are provided as a Source Data file.
Fig. 3
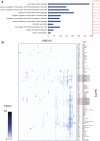
Fig. 3. Hierarchical clustering of baits by preys and its correlations to DNA-binding domains of studied TFs.
a Enriched Gene Ontology Biological Processes of the high-confidence interacting proteins from the BioID analysis indicate high enrichment of DNA-templated transcription regulating proteins and chromatin modifiers as TF interactors. b The TF bait proteins and their interacting prey proteins from BioID analysis were hierarchically clustered (ProHits-viz.) and visualized in the heatmap (note that the color gradient shows the interaction abundancy (spectral counts) value for the prey). Source data of the figure are provided as a Source Data file.
Fig. 4
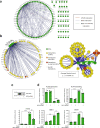
Fig. 4. TF-TF (bait-bait) interactions of 109 TFs studied.
a Of 109 studied TFs, 80 had 202 interactions with other studied TFs. Blue edges indicate interactions from the BioID analysis, red from the AP-MS analysis and green from both. b Most of these TF-TF (118) interactions were TF interactions with NFIs (left panel). The right panel shows the separate groups shared by one or multiple NFIs. Color code: Green nodes = NFIs, yellow nodes = interactions to NFIs, orange nodes = interactions from NFIs, red nodes = interactions to and from NFIs and gray nodes = no interactions to or from NFIs. Color coding of the nodes is shown on the right side of the figure. The edge weight displays the average spectral count value detected for the corresponding interaction. c NFIA was silenced using siRNA transfection, and NFIA levels were detected 48 h after transfection by western blotting using a specific antibody against NFIA. d TF activity was investigated after NFIA silencing using both repressive and activating reporter gene analysis. Both the repressing and activating functions of KLF4 were reduced upon NFIA silencing. In addition, SOX2 and PAX6 activity was reduced, while HME1 activity was increased upon NFIA silencing. The representative data from two repeated experiments are presented as mean values +SD as appropriate. Two-sided t-test was used. N = 3, ***p < 0.001, **p < 0.01, *p < 0.05. Source data of the figure are provided as a Source Data file.
Fig. 5
Fig. 5. Biological clusters from prey-prey correlation analysis.
Prey-prey correlation analysis (ProHits-viz.) of prey identified in the BioID experiments. The results are shown in the heatmap with prey on both the x- and y-axes. Prey in clusters (A-Q) and baits driving the clusters are shown in Supplementary Data 6. The color scale indicates the Pearson correlation of prey PSMs that was performed by Prohits-viz. prior to hierarchical clustering. Source data of the figure are provided as a Source Data file.
Fig. 6
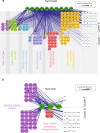
Fig. 6. The interactions in Clusters K, L, P, and Q of the prey-prey correlation analysis from BioID experiment.
a The ten baits (TYY1, KLF6, HNF4A, KLF8, MYC, NFIX, PAX6, ELF1, ELF2, and ELF4) with the most interactions in Clusters K and L are shown in the top of the figure with green nodes. Most of the preys in Clusters K and L belong to different chromatin-modulating complexes that are highlighted by color coding. b Protein–protein interactions in Clusters P and Q. The three baits (SP7, GATA1, GATA3) with the most interactions in Clusters P and Q are shown in the center of the figure with green nodes. Most of the preys in these clusters were linked to mRNA splicing (highlighted in purple). The edge weight displays the average spectral count value detected for the corresponding interaction. Source data of the figure are provided as a Source Data file.

Similar articles

Cited by

References

    1. Babu MM, Luscombe NM, Aravind L, Gerstein M, Teichmann SA. Structure and evolution of transcriptional regulatory networks. Curr. Opin. Struct. Biol. 2004;14:283–291. - PubMed
    1. Fulton DL, et al. TFCat: the curated catalog of mouse and human transcription factors. Genome Biol. 2009;10:R29. - PMC - PubMed
    1. Vaquerizas JM, Kummerfeld SK, Teichmann SA, Luscombe NM. A census of human transcription factors: function, expression and evolution. Nat. Rev. Genet. 2009;10:252–263. - PubMed
    1. Lambert SA, et al. The human transcription factors. Cell. 2018;172:650–665. - PubMed
    1. Brivanlou AH, Darnell JE., Jr. Signal transduction and the control of gene expression. Science. 2002;295:813–818. - PubMed

Publication types

LinkOut - more resources