

Differential interferon-α subtype induced immune signatures are associated with suppression of SARS-CoV-2 infection
- PMID: 35131898
- PMCID: PMC8872780
- DOI: 10.1073/pnas.2111600119
Differential interferon-α subtype induced immune signatures are associated with suppression of SARS-CoV-2 infection
Abstract
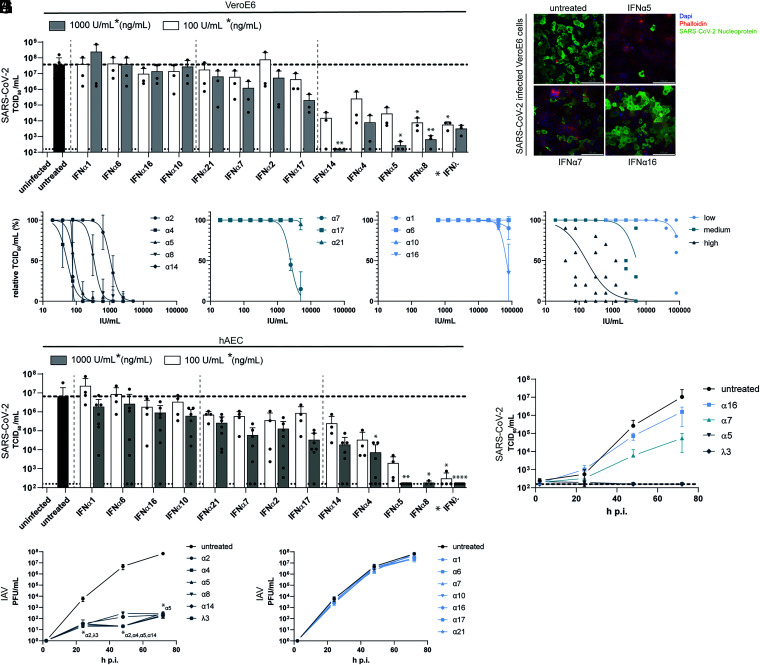
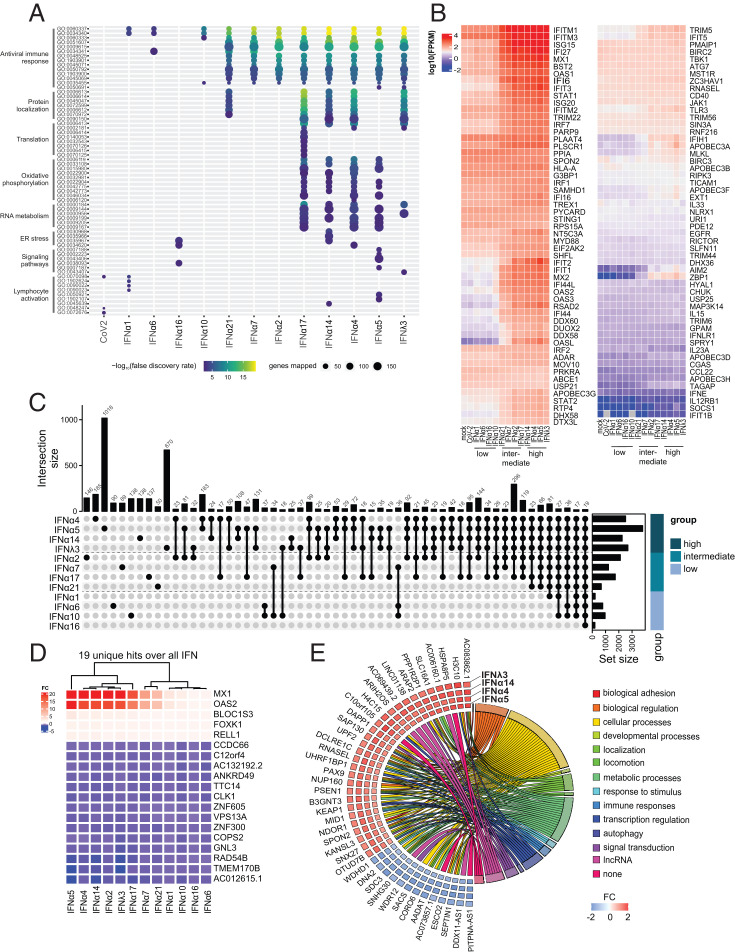
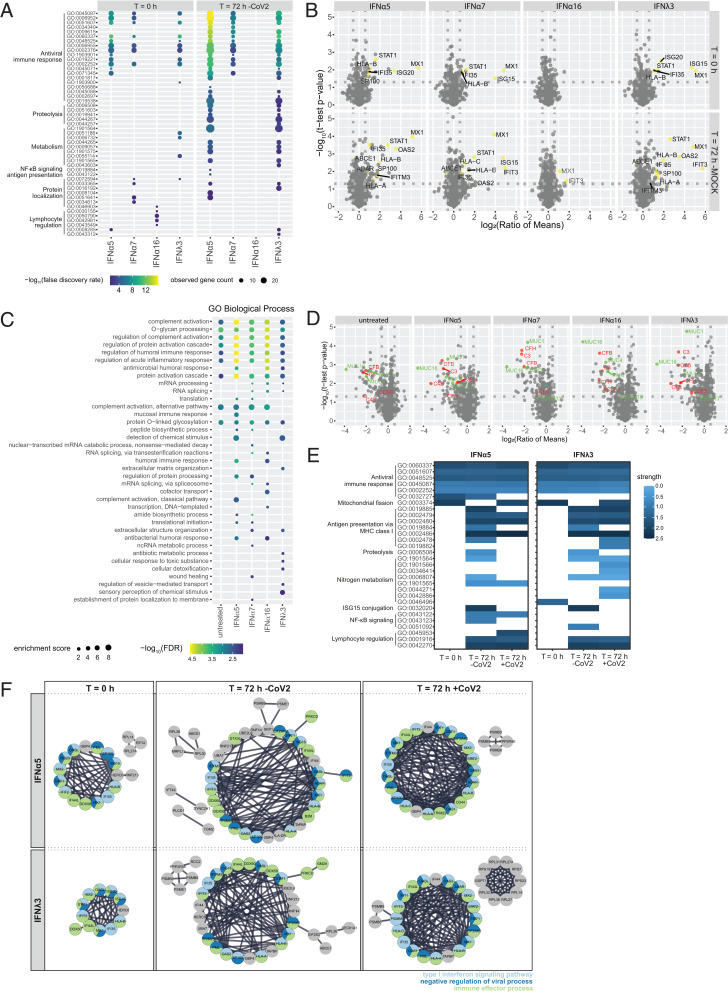
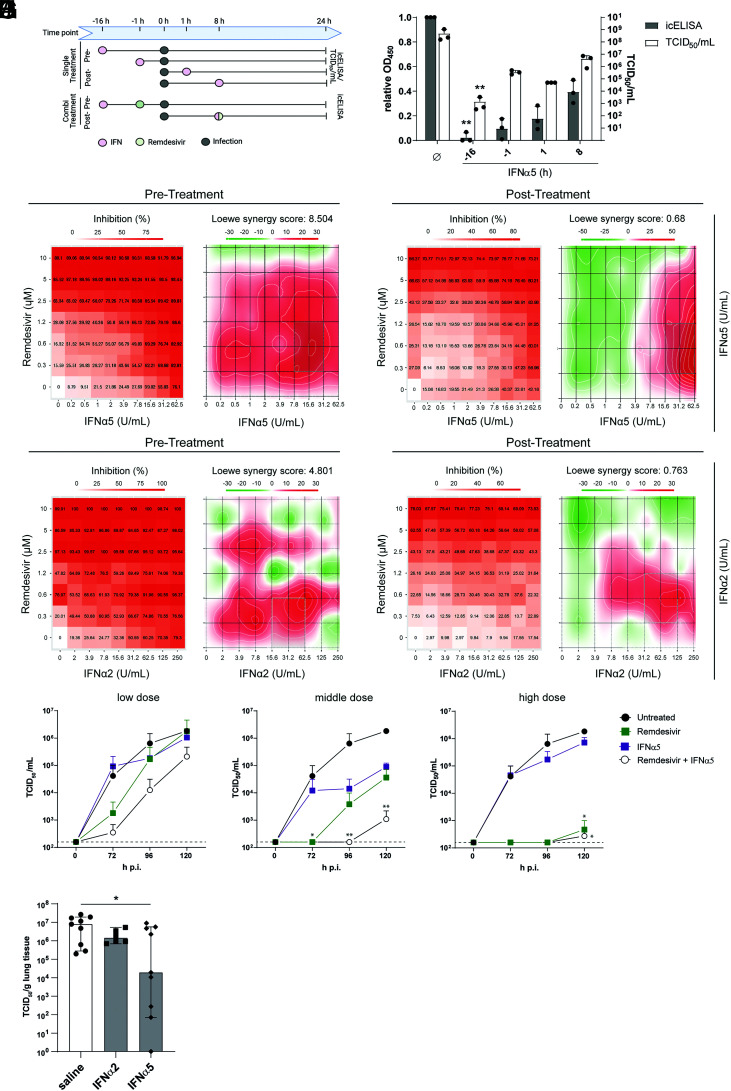
Type I interferons (IFN-I) exert pleiotropic biological effects during viral infections, balancing virus control versus immune-mediated pathologies, and have been successfully employed for the treatment of viral diseases. Humans express 12 IFN-alpha (α) subtypes, which activate downstream signaling cascades and result in distinct patterns of immune responses and differential antiviral responses. Inborn errors in IFN-I immunity and the presence of anti-IFN autoantibodies account for very severe courses of COVID-19; therefore, early administration of IFN-I may be protective against life-threatening disease. Here we comprehensively analyzed the antiviral activity of all IFNα subtypes against severe acute respiratory syndrome coronavirus 2 (SARS-CoV-2) to identify the underlying immune signatures and explore their therapeutic potential. Prophylaxis of primary human airway epithelial cells (hAEC) with different IFNα subtypes during SARS-CoV-2 infection uncovered distinct functional classes with high, intermediate, and low antiviral IFNs. In particular, IFNα5 showed superior antiviral activity against SARS-CoV-2 infection in vitro and in SARS-CoV-2-infected mice in vivo. Dose dependency studies further displayed additive effects upon coadministration with the broad antiviral drug remdesivir in cell culture. Transcriptomic analysis of IFN-treated hAEC revealed different transcriptional signatures, uncovering distinct, intersecting, and prototypical genes of individual IFNα subtypes. Global proteomic analyses systematically assessed the abundance of specific antiviral key effector molecules which are involved in IFN-I signaling pathways, negative regulation of viral processes, and immune effector processes for the potent antiviral IFNα5. Taken together, our data provide a systemic, multimodular definition of antiviral host responses mediated by defined IFN-I. This knowledge will support the development of novel therapeutic approaches against SARS-CoV-2.
Keywords: SARS-CoV-2; antiviral; immunotherapy; type I IFNs.
Copyright © 2022 the Author(s). Published by PNAS.
Conflict of interest statement
The authors declare no competing interest.
Figures
Similar articles
-
Antiviral Activity of Type I, II, and III Interferons Counterbalances ACE2 Inducibility and Restricts SARS-CoV-2.mBio. 2020 Sep 10;11(5):e01928-20. doi: 10.1128/mBio.01928-20. mBio. 2020. PMID: 32913009 Free PMC article.
-
Evaluation of the Anti-Viral Activity of Human Recombinant Interferon Lambda-1 against SARS-CoV-2.Bull Exp Biol Med. 2021 Nov;172(1):53-56. doi: 10.1007/s10517-021-05330-0. Epub 2021 Nov 18. Bull Exp Biol Med. 2021. PMID: 34791556 Free PMC article.
-
Type I Interferon Susceptibility Distinguishes SARS-CoV-2 from SARS-CoV.J Virol. 2020 Nov 9;94(23):e01410-20. doi: 10.1128/JVI.01410-20. Print 2020 Nov 9. J Virol. 2020. PMID: 32938761 Free PMC article.
-
Type I IFNs: A Blessing in Disguise or Partner in Crime in MERS-CoV-, SARS-CoV-, and SARS-CoV-2-Induced Pathology and Potential Use of Type I IFNs in Synergism with IFN-γ as a Novel Antiviral Approach Against COVID-19.Viral Immunol. 2021 Jun;34(5):321-329. doi: 10.1089/vim.2020.0085. Epub 2020 Nov 11. Viral Immunol. 2021. PMID: 33181057 Review.
-
Janus kinase signaling as risk factor and therapeutic target for severe SARS-CoV-2 infection.Eur J Immunol. 2021 May;51(5):1071-1075. doi: 10.1002/eji.202149173. Epub 2021 Mar 22. Eur J Immunol. 2021. PMID: 33675065 Free PMC article. Review.
Cited by
-
Functional characterization of OR51B5 and OR1G1 in human lung epithelial cells as potential drug targets for non-type 2 lung diseases.Cell Biol Toxicol. 2024 Nov 13;40(1):96. doi: 10.1007/s10565-024-09935-9. Cell Biol Toxicol. 2024. PMID: 39538061 Free PMC article.
-
Superior antiviral activity of IFNβ in genital HSV-1 infection.Front Cell Infect Microbiol. 2022 Oct 17;12:949036. doi: 10.3389/fcimb.2022.949036. eCollection 2022. Front Cell Infect Microbiol. 2022. PMID: 36325470 Free PMC article.
-
SARS-CoV-2 particles promote airway epithelial differentiation and ciliation.Front Bioeng Biotechnol. 2023 Nov 2;11:1268782. doi: 10.3389/fbioe.2023.1268782. eCollection 2023. Front Bioeng Biotechnol. 2023. PMID: 38026867 Free PMC article.
-
Virus Infection and Systemic Inflammation: Lessons Learnt from COVID-19 and Beyond.Cells. 2022 Jul 14;11(14):2198. doi: 10.3390/cells11142198. Cells. 2022. PMID: 35883640 Free PMC article. Review.
-
The Initial COVID-19 Reliable Interactive DNA Methylation Markers and Biological Implications.Biology (Basel). 2024 Apr 7;13(4):245. doi: 10.3390/biology13040245. Biology (Basel). 2024. PMID: 38666857 Free PMC article.
References
-
- Hardy M. P., Owczarek C. M., Jermiin L. S., Ejdebäck M., Hertzog P. J., Characterization of the type I interferon locus and identification of novel genes. Genomics 84, 331–345 (2004). - PubMed
-
- Platanias L. C., Mechanisms of type-I- and type-II-interferon-mediated signalling. Nat. Rev. Immunol. 5, 375–386 (2005). - PubMed
-
- Chen J., et al. , Functional comparison of interferon-α subtypes reveals potent hepatitis B virus suppression by a concerted action of interferon-α and interferon-γ signaling. Hepatology 73, 486–502 (2021). - PubMed
Publication types
MeSH terms
Substances
LinkOut - more resources
Full Text Sources
Molecular Biology Databases
Miscellaneous
