. 2022 Feb 7;17(2):e0262364.
doi: 10.1371/journal.pone.0262364. eCollection 2022.

Increased mitochondrial proline metabolism sustains proliferation and survival of colorectal cancer cells

Affiliations

Increased mitochondrial proline metabolism sustains proliferation and survival of colorectal cancer cells

Saif Sattar Alaqbi et al. PLoS One. .

Abstract

Research into the metabolism of the non-essential amino acid (NEAA) proline in cancer has gained traction in recent years. The last step in the proline biosynthesis pathway is catalyzed by pyrroline-5-carboxylate reductase (PYCR) enzymes. There are three PYCR enzymes: mitochondrial PYCR1 and 2 and cytosolic PYCR3 encoded by separate genes. The expression of the PYCR1 gene is increased in numerous malignancies and correlates with poor prognosis. PYCR1 expression sustains cancer cells' proliferation and survival and several mechanisms have been implicated to explain its oncogenic role. It has been suggested that the biosynthesis of proline is key to sustain protein synthesis, support mitochondrial function and nucleotide biosynthesis. However, the links between proline metabolism and cancer remain ill-defined and are likely to be tissue specific. Here we use a combination of human dataset, human tissue and mouse models to show that the expression levels of the proline biosynthesis enzymes are significantly increased during colorectal tumorigenesis. Functionally, the expression of mitochondrial PYCRs is necessary for cancer cells' survival and proliferation. However, the phenotypic consequences of PYCRs depletion could not be rescued by external supplementation with either proline or nucleotides. Overall, our data suggest that, despite the mechanisms underlying the role of proline metabolism in colorectal tumorigenesis remain elusive, targeting the proline biosynthesis pathway is a suitable approach for the development of novel anti-cancer therapies.


Conflict of interest statement

The authors have declared that no competing interests exist.

Figures
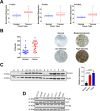
Fig 1
Fig 1. Expression of PYCR genes in human CRC.
A) Bioinformatics analysis showing increased expression of PYCR1, PYCR2 and PYCR3 in the TCGA CRC dataset (n = 41 normal and 41 cancers). Data were analyzed using unpaired t-test. **** p<0.0001. B) PYCR1 H-score was assessed in one CRC TMA. Each dot represents a single core for normal specimens and the average of two separate cores for CRC cases. Lines indicate mean ± SD and data were analyzed by two-tailed t-test (n = 16 normal and 16 cancers). ** p<0.01. Representative histo-spots are shown. C) PYCR1 expression was analyzed by western blotting in lysate from cell suspensions isolated from primary colon polyps (P), carcinomas (CA), liver metastasis (LM) and, when available, matched normal tissues control (N). Actin was used as endogenous loading control. The relative expressions was calculated relative to the normal group using ImageJ software and plotted as mean ± SD. Data were analyzed using One-way ANOVA and Dunnett’s multiple comparisons test (n = 5 normal tissue controls, 6 CRC cases [including 1 liver metastasis] and 3 benign polyps). **** p<0.0001. N = normal, CA = cancer and LM = liver metastasis. D) Expression of proline metabolism enzymes in the indicated CRC cell lines by western blotting. Actin was used as endogenous loading control.
Fig 2
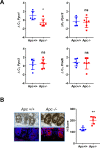
Fig 2. Expression of proline metabolism enzymes in a mouse model of CRC.
A) mRNA levels of the indicated genes were measured in Lgr5-CreER/Apcfl/fl mice two weeks after tamoxifen injection. The scatter blots represent the ΔCT values in Apc deleted (Apc-/-) mice and Apc WT (Apc+/+) controls. Hence, a decrease in ΔCT is equivalent to an increase in gene expression. Each dot represents one mouse, and horizontal bars indicate mean ± SD. Normalization was obtained with the geometric mean value obtained from two endogenous housekeeping genes, Pop4 and Efnb2. Data were analyzed using two-tailed t-test (n = 5 Apc WT controls and 6 Apc deleted mice). * p≤0.05, ns = p>0.05. B) Representative IHC and fluorescence staining and H-score quantification of Pycr1 protein in the small intestinal crypts of the Lgr5-CreER/Apcfl/fl mice two weeks after tamoxifen injection. Each dot represents one mouse (50 crypts were scored for each animal and the average H-score is plotted), horizontal bars indicate mean ± SD. Data were analyzed using two-tailed t-test (n = 5 Apc WT controls and 6 Apc deleted mice). ** p<0.01.
Fig 3
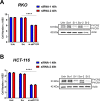
Fig 3. Knock-down of PYCR1 decreases growth of CRC cell lines.
Bar graphs showing number of RKO A) and HCT116 B) cells 48 hours after transfection with two independent siRNAs (siRNA-1 Dharmacon, siRNA-2 Ambion) targeting PYCR1 (si-mtPYCRs) and control siRNA (Scr). Untr indicates control cells without any treatment. The representative western blot shows the PYCR1 and PYCR2 protein expression in the corresponding samples. Actin was used as loading control. In this experiment the same nitrocellulose membrane was sequentially incubated with the PYCR1 (Thermo Fischer) antibody and the PYCR2 (Atlas) (S1 Table). The bars represent mean ± SD. Data were analyzed using Two-way ANOVA and Tukey’s multiple comparisons test (n = 3 independent experiments). **** p<0.0001.
Fig 4
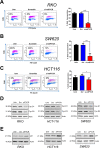
Fig 4. PYCR1 depletion leads to reduced cellular proliferation.
Representative flow cytometry scatterplots of EdU incorporation in RKO A), SW620 B) and HCT116 C) CRC cell lines 72 hours after transfection with the indicated siRNAs. Untr indicates control cells without any treatment. EdU was measured using the Click-iT® EdU Alexa Fluor® kit and total DNA stained using FxCycle™ Violet Stain. The bar graph shows mean ± SD quantification of EdU incorporation. Data were analyzed using One-way ANOVA and Tukey’s multiple comparisons test (n = 3 independent experiments). * p≤0.05, *** p<0.001, **** p<0.0001. D) Western blot analysis of cell cycle markers cyclin D1 and Cyclin D3 in the indicated cell lines treated as in A-C. Actin was used as loading control. E) Western blot analysis of cell cycle marker p21 in the indicated cell lines treated as in A-C. Actin was used as loading control.
Fig 5
Fig 5. Knock-down of PYCR genes induces apoptosis.
A) Representative scatter plots of cytofluorimetry-based assessment of Annexin V/PI staining in HCT116 cells transfected with siRNA targeting PYCR genes (si-mtPYCR) and with non-targeting scrambled siRNA (Src) for 48 hours. Untr indicates control cells without any treatment. Etoposide (25 μM) was used as positive control for induction of apoptosis. B) The bar graph quantification of apoptotic cell death and total cell number collected at the end of the experiment. Data are plotted as mean ± SD of three independent experiments, each performed in triplicate. **** p<0.0001, unpaired t-test or one-way ANOVA with Tukey’s multiple comparisons. C) Western blots showing increased cleaved-Caspase 3 and cleaved-PARP expressions following 48 hours of PYCR1 knockdown with two independent siRNAs compared to scramble (Scr) transfected and untransfected controls (Untr). Cells treated with etoposide (25 μM) were used a positive control for induction of apoptosis. Actin was used as loading control. D) Western blots showing increased PUMA expression in HCT116 cells following a 72 hour PYCR1 knockdown. Tubulin was used as loading control. A representative of blot of two biological replicates is shown.
Fig 6
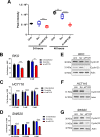
Fig 6. Knock-down of PYCR genes effect is independent of proline and nucleotide biosynthesis.
A) Intracellular proline levels measured by HILIC mass spectrometry show decreased proline levels in RKO cells 24 hours and 48 hours after PYCRs knockdown. Boxes represents median and interquartile. Bars indicates highest and lowest values and were analyzed using Two-way Anova with Dunnet multiple comparisons test versus scramble control (n = 6 biological replicates). ** p<0.01, **** p<0.0001. B) Bar graph showing the effect of different proline concentrations on the growth of RKO cells transfected with siRNA targeting mtPYCRs (Red), non-targeting scramble control (Blue) or left untransfected cells (Black). Cells were collected 72 hours after transfection for counting. C) Bar graph showing the effect of different proline concentrations on the growth of HCT116 cells transfected with siRNA targeting mtPYCRs (Red), non-targeting scramble control (Blue) or left untransfected cells (Black). Cells were collected 72 hours after transfection for counting. The different proline concentrations in non-supplemented cultures reflect the starting proline content of the culture media: MEM for RKO, McCoy’s 5A for HCT116 and DMEM for SW620. D) Bar graph showing the effect of different proline concentrations on the growth of SW620 cells transfected with siRNA targeting mtPYCRs (Red), non-targeting scramble control (Blue) or left untransfected cells (Black). Cells were collected 72 hours after transfection for counting. Cell numbers in are plotted as mean ± SD and were analyzed using two-way ANOVA with Sidak’s multiple comparisons test (n = 3 independent experiments. ** p<0.01, *** p<0.001, **** p<0.0001. E), F), G) Western blots showing decreased expression of cyclin D1 and D3 protein expression after 72 hours mtPYCRs silencing in RKO (E), HCT116 (F) and SW620 (G) cells supplemented with 5 mM proline.
Fig 7
Fig 7. Selective isoform knockdown reveals the essentiality of both PYCR1 and PYCR2 expression.
A) Representative western blot showing expression of PYCR1 and PYCR2 in HCT116 cells left untreated or transfected for 72 hours with the indicated siRNAs. Actin was used as loading control. The same membrane was blotted with all 3 antibodies PYCR1, PYCR2 and Actin. B) Bar graphs showing number of HCT116 cells 72 hours after transfection with custom siRNAs targeting PYCR1 or PYCR2 and control siRNA (Scr). Untr indicates untreated control cells. C) Representative western blot showing expression of PYCR1 and PYCR2 in RKO cells left untreated or transfected for 72 hours with the indicated siRNAs. Actin was used as loading control. PYCR1 and 2 were assessed in separate nitrocellulose membrane with their respective loading control. D) Bar graphs showing number of RKO cells 72 hours after transfection with custom siRNAs targeting PYCR1 or PYCR2 and control siRNA (Scr). Untr indicates untreated control cells. The bars represent mean ± SD. Data were analyzed using One-way ANOVA with Dunnet multiple comparisons test versus scramble control (n = 3 independent experiments). * p≤0.05, ** p<0.01.

Similar articles

Cited by

References

    1. Hanahan D, Weinberg RA. Hallmarks of cancer: the next generation. Cell. 2011;144(5):646–74. Epub 2011/03/08. doi: 10.1016/j.cell.2011.02.013 . - DOI - PubMed
    1. Cairns RA, Harris IS, Mak TW. Regulation of cancer cell metabolism. Nat Rev Cancer. 2011;11(2):85–95. Epub 2011/01/25. doi: 10.1038/nrc2981 . - DOI - PubMed
    1. Choi BH, Coloff JL. The Diverse Functions of Non-Essential Amino Acids in Cancer. Cancers (Basel). 2019;11(5). Epub 2019/05/18. doi: 10.3390/cancers11050675 ; PubMed Central PMCID: PMC6562791. - DOI - PMC - PubMed
    1. D’Aniello C, Patriarca EJ, Phang JM, Minchiotti G. Proline Metabolism in Tumor Growth and Metastatic Progression. Frontiers in oncology. 2020;10:776. Epub 2020/06/06. doi: 10.3389/fonc.2020.00776 ; PubMed Central PMCID: PMC7243120. - DOI - PMC - PubMed
    1. Burke L, Guterman I, Palacios Gallego R, Britton RG, Burschowsky D, Tufarelli C, et al.. The Janus-like role of proline metabolism in cancer. Cell death discovery. 2020;6(1):104. doi: 10.1038/s41420-020-00341-8 - DOI - PMC - PubMed

Substances