. 2022 Feb 14;40(2):153-167.e11.
doi: 10.1016/j.ccell.2022.01.003. Epub 2022 Feb 3.

Fungal mycobiome drives IL-33 secretion and type 2 immunity in pancreatic cancer

Affiliations

Fungal mycobiome drives IL-33 secretion and type 2 immunity in pancreatic cancer

Aftab Alam et al. Cancer Cell. .

Abstract

TH2 cells and innate lymphoid cells 2 (ILC2) can stimulate tumor growth by secreting pro-tumorigenic cytokines such as interleukin-4 (IL-4), IL-5, and IL-13. However, the mechanisms by which type 2 immune cells traffic to the tumor microenvironment are unknown. Here, we show that oncogenic KrasG12D increases IL-33 expression in pancreatic ductal adenocarcinoma (PDAC) cells, which recruits and activates TH2 and ILC2 cells. Correspondingly, cancer-cell-specific deletion of IL-33 reduces TH2 and ILC2 recruitment and promotes tumor regression. Unexpectedly, IL-33 secretion is dependent on the intratumoral fungal mycobiome. Genetic deletion of IL-33 or anti-fungal treatment decreases TH2 and ILC2 infiltration and increases survival. Consistently, high IL-33 expression is observed in approximately 20% of human PDAC, and expression is mainly restricted to cancer cells. These data expand our knowledge of the mechanisms driving PDAC tumor progression and identify therapeutically targetable pathways involving intratumoral mycobiome-driven secretion of IL-33.

Keywords: IL-33; ILC2; Kras; PDAC; TH2; anti-fungal therapy; fungal mycobiome; innate lymphoid cells; intratumor-microbiome; type 2 immune response.


Conflict of interest statement

Declaration of interests P. Dey and A.A. have a patent pending on targeting IL-33 and mycobiome in cancer: US Provisional Patent Application Serial No. 63/238,531. R.A.D. is a co-founder, adviser, and/or director of Tvardi Therapeutics, Asylia Therapeutics, Stellanova Therapeutics, Nirogy Therapeutics, and Sporos Bioventures. Tvardi and Nirogy are developing STAT3 and MCT inhibitors, respectively. A.M. receives royalties from Cosmos Wisdom Biotechnology and Thrive Earlier Detection, an Exact Sciences Company. A.M. is also a consultant for Freenome and Tezcat Biotechnology. The other authors declare no competing interests.

Figures
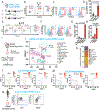
Figure 1:
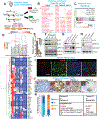
Figure 1:. Type 2 immune cell infiltration increases significantly in PDAC tumor microenvironment.
(A) Schematic diagram showing strategy for KPC (KrasG12D;p53R172H;pdx-Cre) PDAC mouse modeling. (B) Flow cytometry gating strategy and frequency of TH2 cells out of total CD4+ T cells in normal pancreas, spleen and PDAC tumor. (C) Representative flow cytometry histogram of TH2 cell phenotype stained with either isotype control (blue histogram) and CD4, Gata3 and CCR4 antibodies (red histogram). (D) Frequency of TH2 cells out of total CD4+ T cells in normal pancreas, spleen and PDAC tumor (n=3). (E) Gating strategy and frequency of ILC2 cells out of total lineage negative [Lin] (CD3, Ly6G, Ly6C, CD11b, CD45R/B220 and TER-119) cells in normal pancreas, bone marrow, spleen and PDAC tumor (n=3). (F) Representative flow cytometry histogram of ILC2s cell phenotype stained with either isotype control (blue histogram) and ST2, Sca-1 and CD127 antibodies (red histogram). (G) Frequency of ILC2 cells out of total Lin cells in normal pancreas, bone marrow, spleen and PDAC tumor (n=4). (H) Frequency of ILC2 cells out of total Lin cells in normal pancreas, PanIN and PDAC tumor (n=4). (I) Schematic showing experimental strategy for single-cell RNA sequencing (scRNA-seq) from PDAC tumor-bearing mice. CD45+ cells were flow-sorted from PDAC tumor and 10,000 live CD45+ cells were used for scRNA-seq. (J) t-SNE plot of immune cells showing 14 clusters belonging to 3 major groups in PDAC sample. (K) Bar graph showing the proportion of major immune cell clusters in PDAC sample. (L) t-SNE plots showing TH2 lineage genes (Cd4, Gata3 and Ccr4) expression in sub-cluster of immune cells. The color key bar represents gene expression level. (M) t-SNE plots showing expression of ILC2 lineage genes (Hes1, Hs3st1 and Il1rl1) expression in sub-cluster of immune cells. The color key represents gene expression level. (N) Gating and frequency of ILC2 out of total lineage negative (CD3, CD14, CD16, CD19, CD20, and CD56) cells in human PDAC tumor. Data are presented as mean ±SD. p-values were calculated using the Student t-test. ns, no significance. Individual p-values are indicated in the figures. See also Figure S1.
Figure 2:
Figure 2:. IL-33 is a downstream target of oncogenic KrasG12D.
(A) Schematic showing doxycycline (Dox) inducible KrasG12D transgenic mouse model (iKPC) (top). Strategy to turn ON and OFF Kras signaling in cell lines followed by transcriptome analysis (bottom). (B) Pathways enriched upon GSEA analysis of RNAseq dataset comparing Kras ON vs Kras OFF. (C) GSEA analysis of RNAseq dataset showing enrichment of hallmark Kras signaling comparing Kras ON vs Kras OFF. (D) Heatmap of genes enriched in Kras signaling pathway upon comparing Kras ON, OFF-2 and 4 days in 4 murine cell lines. (E) qRT-PCR analysis of Il33 expression in the Kras ON, OFF-2 and 4 days (n=3). (F) Western blot analysis of IL-33 (Lo=low and Hi=high exposure), pERK1/2 (P-p42/44) and ERK1/2 (p42/44) in Kras ON, OFF-1, 2 and 3 days in the murine cell line. (G) Western blot analysis of IL-33 and pERK1/2 in Kras ON, OFF and re-ON in murine cell line. (H) Western blot analysis of IL-33, pERK1/2 (P-p42/44) and pAkt-S307 upon treatment with MEK inhibitors (CI-1040 and Trametinib) in the murine cell line. (I) Representative confocal images of IL-33 and α-smooth muscle actin (α-SMA) staining in mouse PDAC tumor. Magnification 63x. Scale bar 50 μm. (J) Representative IHC images of IL-33 in human PDAC tumor. Inset (red box) showing 100x magnification. (n=121). Scale bar 25 μm. (K) Statistical analysis of IL-33 staining of human PDAC TMA. The intensity of IHC staining was scored as negative (0), low (1), medium (2), and high (3) (left). Table showing statistical analysis of the IL-33 expression, between normal pancreas and tumor tissues (right). The N vs T comparison was done considering all staining (score 1–3) intensities. See also Figure S2. Data are presented as mean ±SD. p-values were calculated using the Student t-test. ns, no significance. GSEA: Gene signature enrichment analysis. Individual p-values are indicated in the figures. See also Figure S2.
Figure 3:
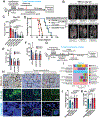
Figure 3:. IL-33 is required for recruitment of type 2 immunocytes.
(A) Il33 gene expression was determined by qRT-PCR relative to β-actin in non-target (shCtrl) vs shIL33 (#1 and #2) stable murine cell line (n=3). (B) Western blot analysis showing stable knockdown of Il33 in shIL33 (#1 and #2) murine cell lines. β-actin was used as a loading control. (C) Intrapancreatic injection of shCtrl (n=23) and shIL33 (#1 [n=25] and #2 [n=24]) stable PDAC isogenic mouse cell lines. Representative bioluminescence images showing orthotopically transplanted PDAC tumors. (D) Kaplan–Meier survival curves of mice orthotopically transplanted with shCtrl and shIL33 (#1 and #2) stable PDAC isogenic mouse cell line (n=10). (E) Representative confocal images showing cancer cell-specific nuclear expression of IL-33 (green) in orthotopically transplanted shCtrl and shIL33 PDAC tumors. DAPI (blue) was used as nuclear marker and PanCK (red) was used as an epithelial cell marker. Magnification 63x. Scale bar 100 μm. (F) Schematic showing a accumulation of ascites fluid on day 25–28 of orthotopically transplanted shCtrl and shIL33 PDAC tumor-bearing mice (left). IL-33 was quantified in ascites fluid using ELISA (n=3) (right). (G) Frequency of ILC2s in orthotopically transplanted shCtrl and shIL33 PDAC tumors relative to total Lin cells. (H) Frequency of TH2 in orthotopically transplanted shCtrl and shIL33 PDAC tumors relative to total CD4+ cells. (I) Frequency of Tregs in orthotopically transplanted shCtrl and shIL33 PDAC tumors relative to total CD4+ cells. (J) Schematic showing flow sorting of ILC2 cells from orthotopically transplanted shCtrl and shIL33 PDAC tumors (left). qRT-PCR analysis was performed for ILC2 lineage signature genes Tph1, Il13, Il5, and Areg (right). Data are presented as mean ±SD. p-values were calculated using the Student t-test. ns, no significance. Individual p-values are indicated in the figures. See also Figure S3.
Figure 4:
Figure 4:. Intratumor fungi facilitate the secretion of IL-33 from PDAC cells.
(A) Representative IHC images of IL-33 in the spleen, normal pancreas, PanIN (KC mice) and PDAC (KPC mice) of 6-, 12- and 24-weeks old mice. Scale bar 50 μm. (B) Fluorescence images showing nuclear expression of IL-33 (green) in PDAC cell line. DAPI (blue) was used for nuclear staining. Magnification 40x, Scale 75μm. (C) Subcellular fractionation of dox inducible murine PDAC cell line showing IL-33 expression in cytoplasm and nucleus. Lamin A/C and β-tubulin were used as nuclear and cytoplasmic loading control respectively. (D) The gut and intrapancreatic (n=3, biologically independent samples) mycobiomes of PDAC tumor bearing mice were analyzed by 18S internal transcribed space (ITS) sequencing. The heatmap of relative abundance of the fungal genus (left) and family (right) in gut vs PDAC. (E) Fluorescence in-situ hybridization (FISH) showing fungal population in normal pancreas vs PDAC. D223 fungal-specific probe was used to detect the fungal species in the normal pancreas. (F) Schematic showing strategy for fungal extract treatment followed by biochemical assays to determine IL-33 expression in cells and conditioned media upon treatment with Alternaria alternata. (G) Western blot analysis of IL-33 in PDAC cell line treated with vehicle, fungal extract (Alternaria alternata) for different time points (2, 3, 6, and 24 hrs) and shIL33 PDAC cell line. β-actin was used as a loading control. (H) IL-33 was measured in conditioned media using ELISA in PDAC cell line treated with Alternaria alternata extract for different time points (2, 3 and 6 hrs), n=3. (I) Schematic showing strategy for quantification of IL-5 in flow-sorted ILC2 cells cultured with PDAC cell conditioned media which was earlier treated with the fungal extract. (J) IL-5 measured using ELISA produced from ILC2s upon treatment with fungal extract-treated cancer cell conditioned media. Data are presented as mean ±SD. p-values were calculated using the Student t-test. ns, no significance. Individual p-values are indicated in the figures. See also Figure S4.
Figure 5:
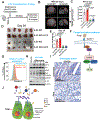
Figure 5:. Intratumor fungus accelerates PDAC tumor growth.
(A) Schematic showing fungal depletion strategy using amphotericin B (200 ug/dose) followed by orthotopic transplantation of PDAC cells and tumor progression studies. (B) Representative MRI images with their relative volumes (n=5) on day 26, showing orthotopically transplanted shCtrl and shIL33 PDAC tumors with or without amphotericin B treatment. Red dotted circles define the tumor boundaries. (C) Bar graph showing tumor volume of orthotopically transplanted shCtrl and shIL33 PDAC tumors (n=14) and shIL33 (#1 [n=9] and #2 [n=10]) with or without amphotericin B treatment. (D) Kaplan–Meier survival curves of mice orthotopically transplanted with shCtrl and shIL33 PDAC tumors with or without amphotericin B treatment (n=10). Statistical analysis was done using the Gehan-Breslow Wilcoxon test. (E) Frequency of ILC2 in orthotopically transplanted shCtrl and shIL33 PDAC tumors with or without amphotericin B treatment relative to total Lin cells. (F) Frequency of TH2 cells in orthotopically transplanted shCtrl and shIL33 PDAC tumors with or without amphotericin B treatment relative to total CD4+ cells. (G) Schematic showing strategy for fungal transplantation followed by orthotopic transplantation of PDAC cells and tumor progression studies. (H) Representative IHC (top) and immunofluorescence (middle) images of PDAC tumors showing IL33 expression in control and fungal transplanted mice by oral gavage (n=10), Magnification 40x. Scale bar 100 μm. FISH (bottom) showing fungal colonization of PDAC tumors in fungal transplanted mice by oral gavage. Scale bar 10 μm. (I) 18S rRNA sequence showing fungal species in PDAC tumors of the Alternaria alternata and Malassezia globosa transplanted mice by oral gavage. Also, shown are the 18S rRNA sequencing in stool samples of the Alternaria alternata and Malassezia globosa transplanted mice by oral gavage. Positive control-Alternaria is a sample of pure Alternaria alternata culture extract. (J) Bar Graph showing the wet weight of PDAC tumors of the control, amphotericin B and fungal transplanted mice (n=10). (K) Frequency of ILC2/total Lin cells in PDAC tumors of control, amphotericin B and fungal transplanted mice. Data are presented as mean ±SD. p-values were calculated using the Student t-test. ns, no significance. Individual p-values are indicated in the figures. See also Figure S5.
Figure 6:
Figure 6:. IL-33 mediated ILC2 activation is necessary for tumor progression.
(A) Schematic showing strategy for orthotopic co-transplantation of PDAC and ILC2 cells. (B) Representative MRI scans showing axial images of CRISPR-Cas9 knockout tumors (IL33 WT vs IL33 KO), with or without ILC2 co-transplantation. (C) Bar graph showing tumor volume calculated by MRI image analysis (n=5–7). (D) Picture showing gross PDAC tumor with or without ILC2 in IL33 WT vs IL33 KO mice (n=5). (E) Bar graph showing PDAC tumor wet weight with or without ILC2 in IL33 WT vs IL33 KO mice (n=5–7). (F) Schematic showing fungal activation pathway, where dectin-1 receptor ligates fungal components and induce Src-Syk-CARD9 signaling cascade. (G) Histogram showing dectin-1 expression on PDAC cell line, analyzed by flow cytometry (n=3). (H) Western blot showing expression of pSrc, Src, pSyk, Syk, CARD9, p-NFκB and IL-33 upon treatment with Alternaria alternata. β-actin was used as a loading control. (I) Representative IHC image showing CARD9 expression in orthotopic transplanted tumor with or without antifungal treatment. Scale bar 100 μm. (J) Working model showing fungus mediated secretion of IL-33 from PDAC tumor, attracting type 2 immune cells (ILC2, TH2, and Treg) thereby promoting tumor progression. Results are shown as mean ±SD. p-values were calculated using the Student t-test. Individual p-values are indicated in the figures. See also Figure S6.

Comment in

Similar articles

Cited by

References

    1. ABARENKOV K, HENRIK NILSSON R, LARSSON KH, ALEXANDER IJ, EBERHARDT U, ERLAND S, HOILAND K, KJOLLER R, LARSSON E, PENNANEN T, SEN R, TAYLOR AF, TEDERSOO L, URSING BM, VRALSTAD T, LIIMATAINEN K, PEINTNER U & KOLJALG U 2010. The UNITE database for molecular identification of fungi--recent updates and future perspectives. New Phytol, 186, 281–5. - PubMed
    1. AGUIRRE AJ, BARDEESY N, SINHA M, LOPEZ L, TUVESON DA, HORNER J, REDSTON MS & DEPINHO RA 2003. Activated Kras and Ink4a/Arf deficiency cooperate to produce metastatic pancreatic ductal adenocarcinoma. Genes Dev, 17, 3112–26. - PMC - PubMed
    1. ALAMRI A, NAM JY & BLANCATO JK 2017. Fluorescence In Situ Hybridization of Cells, Chromosomes, and Formalin-Fixed Paraffin-Embedded Tissues. Methods Mol Biol, 1606, 265–279. - PMC - PubMed
    1. ALI S, HUBER M, KOLLEWE C, BISCHOFF SC, FALK W & MARTIN MU 2007. IL-1 receptor accessory protein is essential for IL-33-induced activation of T lymphocytes and mast cells. Proc Natl Acad Sci U S A, 104, 18660–5. - PMC - PubMed
    1. ALONSO-CURBELO D, HO YJ, BURDZIAK C, MAAG JLV, MORRIS JPT, CHANDWANI R, CHEN HA, TSANOV KM, BARRIGA FM, LUAN W, TASDEMIR N, LIVSHITS G, AZIZI E, CHUN J, WILKINSON JE, MAZUTIS L, LEACH SD, KOCHE R, PE’ER D & LOWE SW 2021. A gene-environment-induced epigenetic program initiates tumorigenesis. Nature, 590, 642–648. - PMC - PubMed

Publication types

MeSH terms