Collagen family genes and related genes might be associated with prognosis of patients with gastric cancer: an integrated bioinformatics analysis and experimental validation
- PMID: 35117235
- PMCID: PMC8797647
- DOI: 10.21037/tcr-20-1726
Collagen family genes and related genes might be associated with prognosis of patients with gastric cancer: an integrated bioinformatics analysis and experimental validation
Abstract
Background: Gastric cancer (GC) is disease with a high morbidity. The purpose of this study was to identify genes essential to GC development in patients and to reveal the underlying mechanisms of progression.
Methods: Bioinformatics analysis is an effective tool for discovering essential genes of different disease states. We used the Gene Expression Omnibus (GEO) database to identify differentially expressed genes (DEGs), the DAVID online tool to perform Gene Ontology (GO), Kyoto Encyclopedia of Genes and Genomes (KEGG) analysis of DEGs, the STRING database to construct the protein-protein interaction (PPI) network of DEGs, the Oncomine and the Cancer Genome Atlas-Stomach Adenocarcinoma (TCGA-STAD) databases to analyze the gene expression differences, the Human pan-Cancer Methylation database (MethHC) to compare the DNA methylation of genes, and the Kaplan-Meier plotter to show the survival analysis of DEGs. We performed Real-Time quantitative PCR (RT-qPCR) experiment to confirm our analysis results.
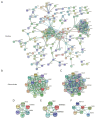
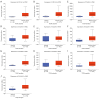
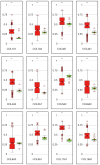
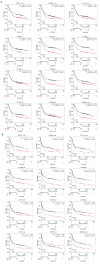
Results: After the integration of four Gene Expression Series (GSEs), we identified 407 DEGs. GO and KEGG pathway analysis indicated that the upregulated DEGs were significantly enriched in Extracellular Matrix (ECM) related functions and pathways. The main DEGs were collagens (COLs). Moreover, the downregulated DEGs were enriched in ethanol oxidation. Several groups of DEGs, such as insulin-like growth factor binding protein (IGFBP), collagen (COL) and serpin peptidase inhibitors (SERPIN) gene families, constituted several PPI networks. In the Oncomine database, all of the collagen genes were highly expressed in breast cancer, esophageal cancer, GC, head and neck cancer and pancreatic cancer, compared with normal tissues. Consistently, from the TCGA-STAD database, most of the collagens (COLs) were highly expressed and exhibited methylated variation in GC patients. In GC patients, some of these collagen (COL) genes related to worse prognosis, as evidenced by the results from the Kaplan-Meier plotter database analysis. Our RT-qPCR results showed that collagen type III α1 chain (COL3A1) was highly expressed in GC cells. Collagen type V α1 chain (COL5A1) was highly expressed, except in AGS cells, which was consistent with our analysis.
Conclusions: Collagen (COL) family genes might serve as progression and prognosis markers of GC.
Keywords: Gastric cancer (GC); bioinformatics analysis; collagens; experimental validation; prognosis.
2020 Translational Cancer Research. All rights reserved.
Conflict of interest statement
Conflicts of Interest: All authors have completed the ICMJE uniform disclosure form (available at http://dx.doi.org/10.21037/tcr-20-1726). The authors have no conflicts of interest to declare.
Figures


Similar articles
-
A panel of collagen genes are associated with prognosis of patients with gastric cancer and regulated by microRNA-29c-3p: an integrated bioinformatics analysis and experimental validation.Cancer Manag Res. 2019 May 24;11:4757-4772. doi: 10.2147/CMAR.S198331. eCollection 2019. Cancer Manag Res. 2019. PMID: 31213898 Free PMC article.
-
Integrated bioinformatics analysis for differentially expressed genes and signaling pathways identification in gastric cancer.Int J Med Sci. 2021 Jan 1;18(3):792-800. doi: 10.7150/ijms.47339. eCollection 2021. Int J Med Sci. 2021. PMID: 33437215 Free PMC article.
-
Identification of Potential Core Genes Associated With the Progression of Stomach Adenocarcinoma Using Bioinformatic Analysis.Front Genet. 2020 Oct 22;11:517362. doi: 10.3389/fgene.2020.517362. eCollection 2020. Front Genet. 2020. PMID: 33193601 Free PMC article.
-
Systems biology and OMIC data integration to understand gastrointestinal cancers.World J Clin Oncol. 2022 Oct 24;13(10):762-778. doi: 10.5306/wjco.v13.i10.762. World J Clin Oncol. 2022. PMID: 36337313 Free PMC article. Review.
-
Unveiling Collagen's Role in Breast Cancer: Insights into Expression Patterns, Functions and Clinical Implications.Int J Gen Med. 2024 May 2;17:1773-1787. doi: 10.2147/IJGM.S463649. eCollection 2024. Int J Gen Med. 2024. PMID: 38711825 Free PMC article. Review.
Cited by
-
Investigation of the effects of overexpression of jumping translocation breakpoint (JTB) protein in MCF7 cells for potential use as a biomarker in breast cancer.Am J Cancer Res. 2022 Apr 15;12(4):1784-1823. eCollection 2022. Am J Cancer Res. 2022. PMID: 35530281 Free PMC article.
-
Large-Scale Machine Learning Analysis Reveals DNA Methylation and Gene Expression Response Signatures for Gemcitabine-Treated Pancreatic Cancer.Health Data Sci. 2024 Jan 8;4:0108. doi: 10.34133/hds.0108. eCollection 2024. Health Data Sci. 2024. PMID: 38486621 Free PMC article.
-
Jian Yun Qing Hua Decoction inhibits malignant behaviors of gastric carcinoma cells via COL12A1 mediated ferroptosis signal pathway.Chin Med. 2023 Sep 12;18(1):118. doi: 10.1186/s13020-023-00799-5. Chin Med. 2023. PMID: 37700383 Free PMC article.
-
Uneven Expression of 20 Human Papillomavirus Genes Associated with Oropharyngeal Carcinoma.Rambam Maimonides Med J. 2023 Oct 29;14(4):e0020. doi: 10.5041/RMMJ.10508. Rambam Maimonides Med J. 2023. PMID: 37917867 Free PMC article.
-
ENTPD1-AS1-miR-144-3p-mediated high expression of COL5A2 correlates with poor prognosis and macrophage infiltration in gastric cancer.World J Gastrointest Oncol. 2023 Jul 15;15(7):1182-1199. doi: 10.4251/wjgo.v15.i7.1182. World J Gastrointest Oncol. 2023. PMID: 37546560 Free PMC article.
References
-
- Shah MA, Xu RH, Bang YJ, et al. HELOISE: Phase IIIb Randomized Multicenter Study Comparing Standard-of-Care and Higher-Dose Trastuzumab Regimens Combined With Chemotherapy as First-Line Therapy in Patients With Human Epidermal Growth Factor Receptor 2-Positive Metastatic Gastric or Gastroesophageal Junction Adenocarcinoma. J Clin Oncol 2017;35:2558-67. 10.1200/JCO.2016.71.6852 - DOI - PubMed
LinkOut - more resources
Full Text Sources
Miscellaneous
