Reconstruction and analysis of the aberrant lncRNA-miRNA-mRNA network based on competitive endogenous RNA in adenoid cystic carcinoma of the salivary gland
- PMID: 35116364
- PMCID: PMC8798187
- DOI: 10.21037/tcr-21-1771
Reconstruction and analysis of the aberrant lncRNA-miRNA-mRNA network based on competitive endogenous RNA in adenoid cystic carcinoma of the salivary gland
Abstract
Background: The aim of this work was to investigate the competing endogenous RNA (ceRNA) network in adenoid cystic carcinoma of the salivary gland (SACC).
Methods: Differentially expressed lncRNAs (DElncRNAs), miRNAs (DEmiRNAs), and mRNAs (DEmRNAs) between cancer tissues and normal salivary gland (NSG) in ACC were identified using data from the Gene Expression Omnibus (GEO) database. Functional annotation and pathway enrichment analysis of DEmRNAs were performed using the Gene Ontology (GO) and Kyoto Encyclopedia of Genes and Genomes (KEGG) databases. The miRNAs that are targeted by lncRNAs were predicted using miRanda and PITA, while the target mRNAs of miRNAs were retrieved from miRanda, miRWalk, and TargetScan. A protein-protein interaction (PPI) network was constructed using the Search Tool for the Retrieval of Interacting Genes/Proteins (STRING) database, and then we constructed the lncRNA-miRNA-mRNA networks of ACC.
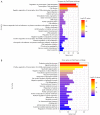
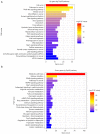
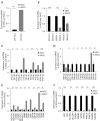
Results: Differentially expressed RNAs were identified in SACC. Upon comparing cancer tissues and NSG tissues, 103 upregulated and 52 downregulated lncRNAs and 745 upregulated and 866 downregulated mRNAs were identified in GSE88804; in addition, 39 upregulated and 43 downregulated miRNAs were identified in GSE117275. GO enrichment analyses revealed that the most relevant GO terms were regulation of transcription DNA-templated, transcription DNA-templated, and cell division. KEGG pathway enrichment analysis showed that differentially expressed genes (DEGs) were mainly enriched in the cell cycle, pathways in cancer, PI3K-Akt signaling pathway, breast cancer, and microRNAs in cancer. The PPI network consisted of 27 upregulated and 54 downregulated mRNAs. By constructing ceRNA network, NONHSAT251752.1-hsa-miR-6817-5p-NOTCH1, NONHSAT251752.1-hsa-miR-204-5p/hsa-miR-138-5p-CDK6 regulatory axises were identified and all genes in the network were verified by qRT-PCR.
Conclusions: The present study constructed ceRNA networks in SACC and provided a novel perspective of the molecular mechanisms for SACC.
Keywords: Salivary gland neoplasms; long non-coding RNA (lncRNA); microRNAs.
2021 Translational Cancer Research. All rights reserved.
Conflict of interest statement
Conflicts of Interest: All authors have completed the ICMJE uniform disclosure form (available at https://dx.doi.org/10.21037/tcr-21-1771). The authors have no conflicts of interest to declare.
Figures


Similar articles
-
Comprehensive analysis of an lncRNA-miRNA-mRNA competing endogenous RNA network in pulpitis.PeerJ. 2019 Jun 17;7:e7135. doi: 10.7717/peerj.7135. eCollection 2019. PeerJ. 2019. PMID: 31304055 Free PMC article.
-
Identification of a lncRNA/circRNA-miRNA-mRNA ceRNA Network in Alzheimer's Disease.J Integr Neurosci. 2023 Oct 17;22(6):136. doi: 10.31083/j.jin2206136. J Integr Neurosci. 2023. PMID: 38176923
-
Bioinformatics Analysis of the Mechanisms of Diabetic Nephropathy via Novel Biomarkers and Competing Endogenous RNA Network.Front Endocrinol (Lausanne). 2022 Jul 14;13:934022. doi: 10.3389/fendo.2022.934022. eCollection 2022. Front Endocrinol (Lausanne). 2022. PMID: 35909518 Free PMC article.
-
Reconstruction and Analysis of the Differentially Expressed IncRNA-miRNA-mRNA Network Based on Competitive Endogenous RNA in Hepatocellular Carcinoma.Crit Rev Eukaryot Gene Expr. 2019;29(6):539-549. doi: 10.1615/CritRevEukaryotGeneExpr.2019028740. Crit Rev Eukaryot Gene Expr. 2019. PMID: 32422009 Review.
-
Meta-analysis of transcriptomics data identifies potential biomarkers and their associated regulatory networks in gallbladder cancer.Gastroenterol Hepatol Bed Bench. 2022;15(4):311-325. doi: 10.22037/ghfbb.v15i4.2292. Gastroenterol Hepatol Bed Bench. 2022. PMID: 36762219 Free PMC article. Review.
Cited by
-
Common Genetic Factors and Pathways in Alzheimer's Disease and Ischemic Stroke: Evidences from GWAS.Genes (Basel). 2023 Jan 30;14(2):353. doi: 10.3390/genes14020353. Genes (Basel). 2023. PMID: 36833280 Free PMC article. Review.
-
Silencing of AJAP1 expression by promoter methylation activates the Wnt/β-catenin signaling pathway to promote tumor proliferation and metastasis in salivary adenoid cystic carcinoma.Gland Surg. 2023 Jun 30;12(6):834-852. doi: 10.21037/gs-23-127. Epub 2023 Jun 27. Gland Surg. 2023. PMID: 37441023 Free PMC article.
References
-
- Terhaard CH, Lubsen H, Van der Tweel I, et al. Salivary gland carcinoma: independent prognostic factors for locoregional control, distant metastases, and overall survival: results of the Dutch head and neck oncology cooperative group. Head Neck 2004;26:681-92; discussion 692-3. 10.1002/hed.10400 - DOI - PubMed
LinkOut - more resources
Full Text Sources
