. 2022 Mar 8;7(5):e152404.
doi: 10.1172/jci.insight.152404.

Maladaptive functional changes in alveolar fibroblasts due to perinatal hyperoxia impair epithelial differentiation

Affiliations

Maladaptive functional changes in alveolar fibroblasts due to perinatal hyperoxia impair epithelial differentiation

Matthew R Riccetti et al. JCI Insight. .

Abstract

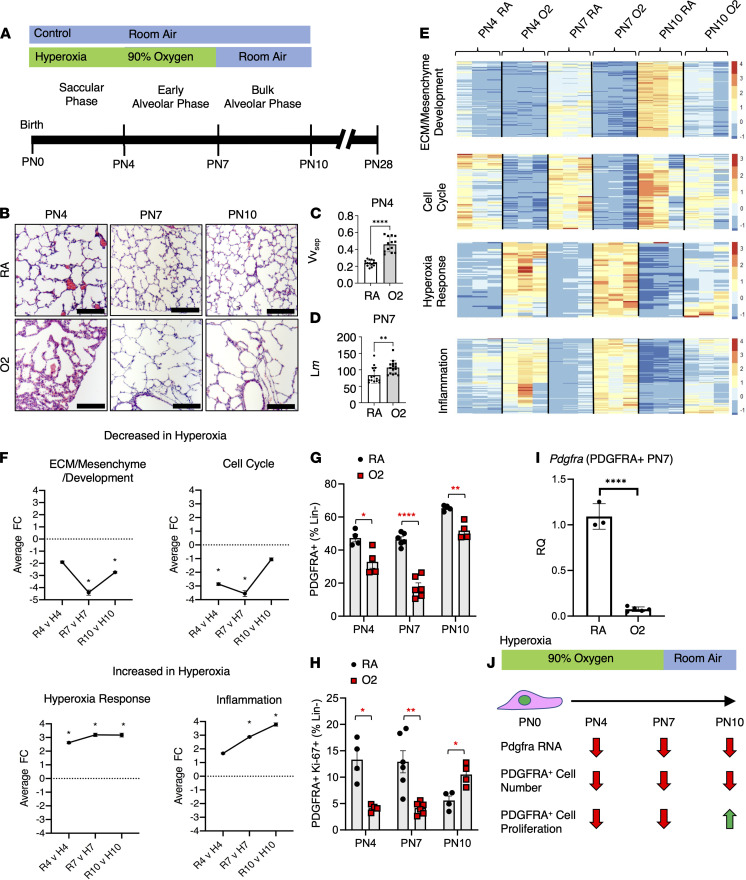
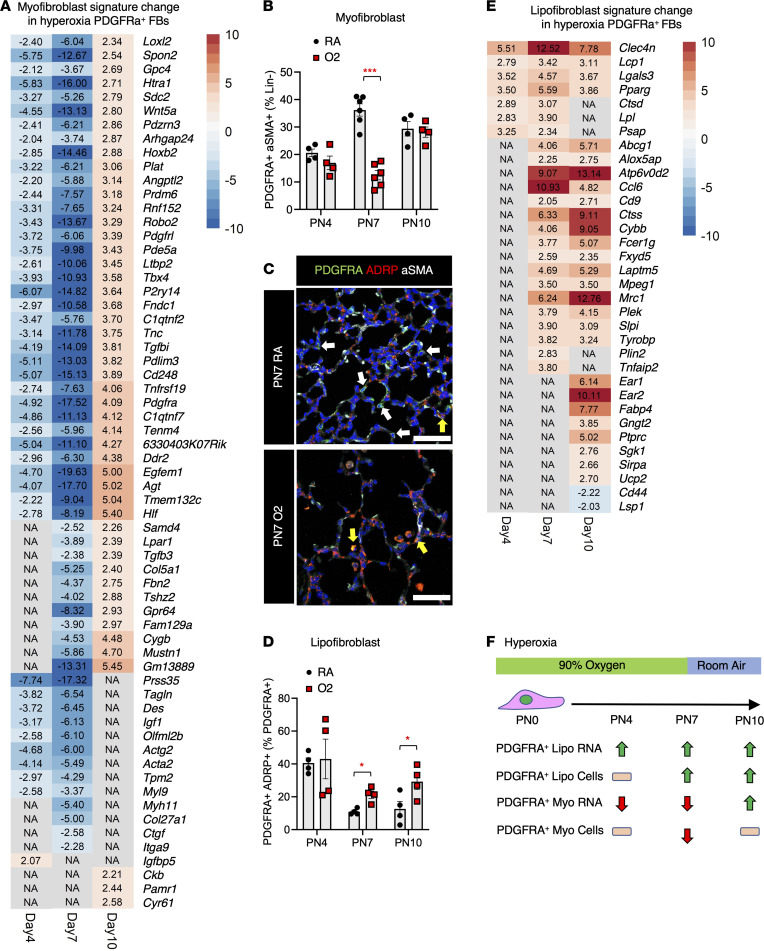
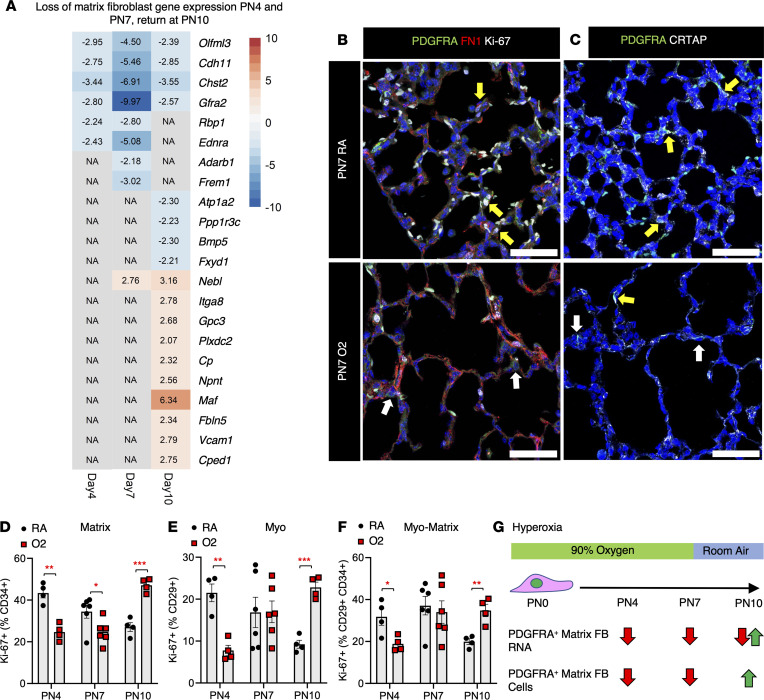
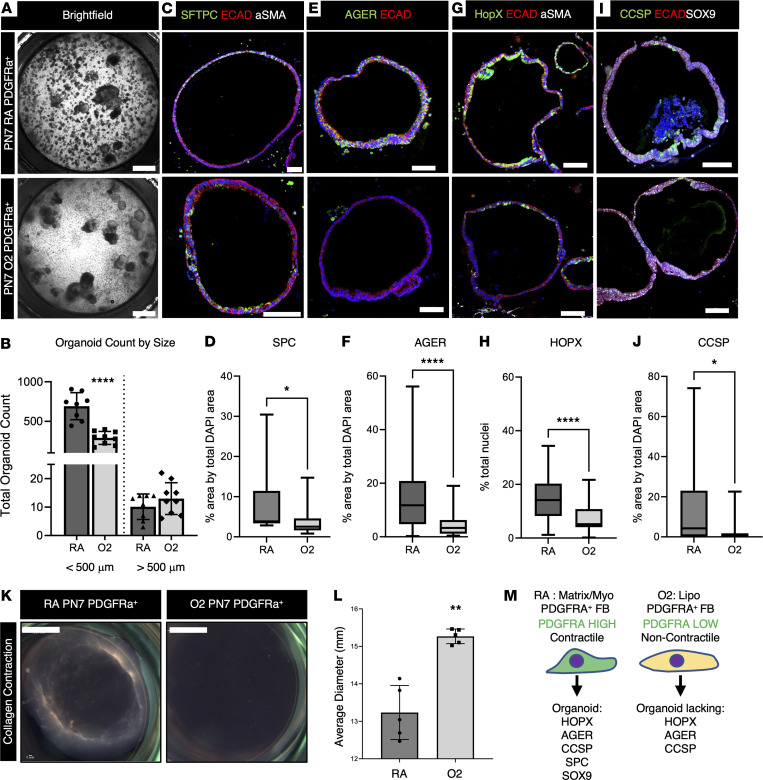
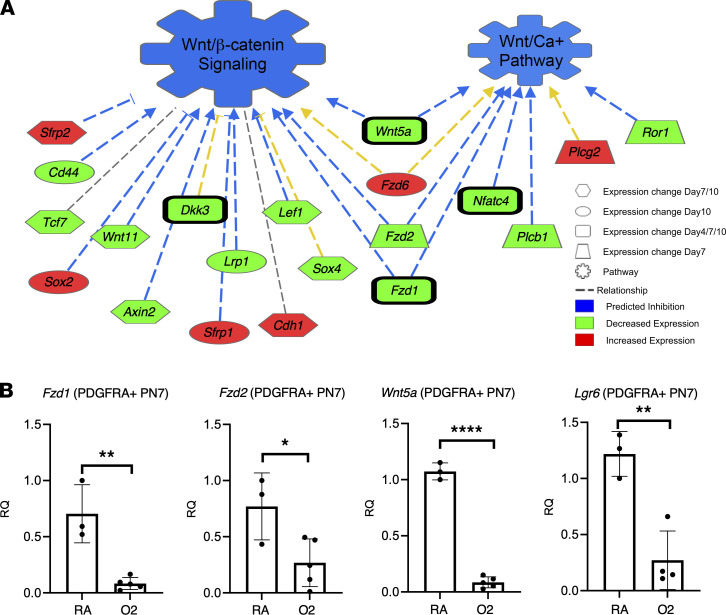
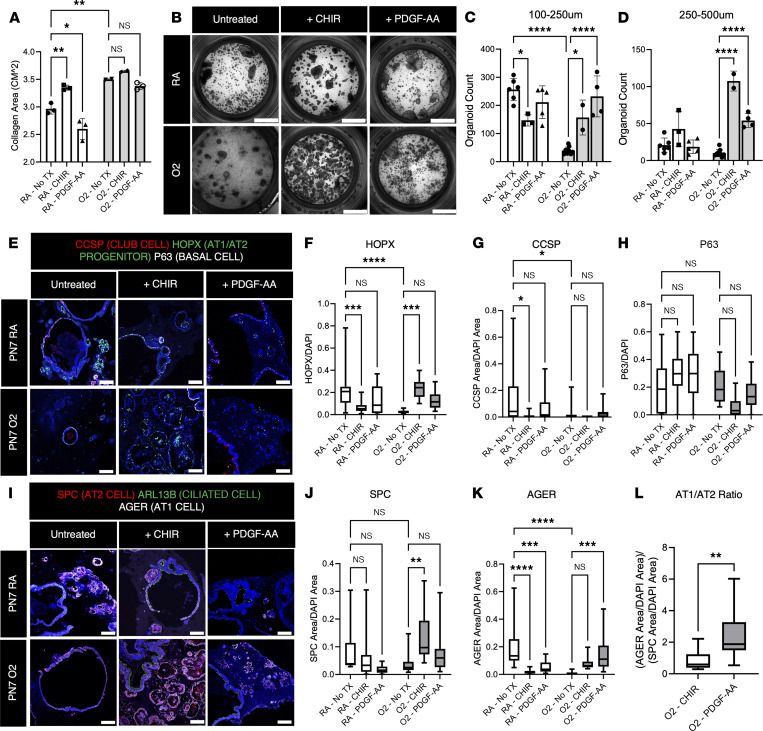
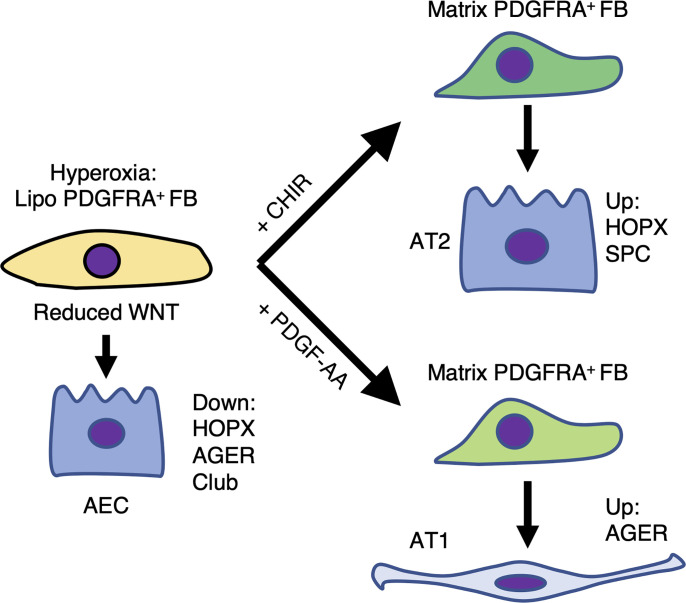
Infants born prematurely worldwide have up to a 50% chance of developing bronchopulmonary dysplasia (BPD), a clinical morbidity characterized by dysregulated lung alveolarization and microvascular development. It is known that PDGFR alpha-positive (PDGFRA+) fibroblasts are critical for alveolarization and that PDGFRA+ fibroblasts are reduced in BPD. A better understanding of fibroblast heterogeneity and functional activation status during pathogenesis is required to develop mesenchymal population-targeted therapies for BPD. In this study, we utilized a neonatal hyperoxia mouse model (90% O2 postnatal days 0-7, PN0-PN7) and performed studies on sorted PDGFRA+ cells during injury and room air recovery. After hyperoxia injury, PDGFRA+ matrix and myofibroblasts decreased and PDGFRA+ lipofibroblasts increased by transcriptional signature and population size. PDGFRA+ matrix and myofibroblasts recovered during repair (PN10). After 7 days of in vivo hyperoxia, PDGFRA+ sorted fibroblasts had reduced contractility in vitro, reflecting loss of myofibroblast commitment. Organoids made with PN7 PDGFRA+ fibroblasts from hyperoxia in mice exhibited reduced alveolar type 1 cell differentiation, suggesting reduced alveolar niche-supporting PDGFRA+ matrix fibroblast function. Pathway analysis predicted reduced WNT signaling in hyperoxia fibroblasts. In alveolar organoids from hyperoxia-exposed fibroblasts, WNT activation by CHIR increased the size and number of alveolar organoids and enhanced alveolar type 2 cell differentiation.

Keywords: Development; Fibrosis; Growth factors; Mouse models; Pulmonology.


Figures

Figure 1
Figure 1. Exposure to hyperoxia PN0–PN7 results in increased inflammatory and hypoxic response and decreased cell cycle and ECM development gene expression in isolated PDGFRA+ fibroblasts.
(A) Timeline and murine hyperoxia exposure schematic used. (B) H&E of PN4, PN7, and PN10 RA and hyperoxia (O2) lungs. Scale bars = 250 μm. (C) Vvsep (volume density of alveolar septa) of PN4 RA and O2 lungs. (D) Lm (mean linear intercept of airspaces) of PN7 RA and O2 lungs. In C and D, n = 3. Two-tailed Student’s t test was used, **P < 0.01; ****P < 0.0001. Error bars show mean ± SD. (E) Gene enrichment analysis performed using ToppGene’s ToppFun, functional enrichments within each profile identified, all profiles compared with each other using Toppcluster. Heatmap of the resulting list, z score normalized, generated using Partek Genomics Suite (85). (F) Average fold change of associated GO terms for each time point in O2 compared with RA. (G) Flow cytometry on PDGFRA+ fibroblasts performed at PN4, PN7, and PN10 and gated as CD45CD326CD31 (Lineage-negative fibroblasts, “Lin”) and CD140+ (PDGFRA+). PDGFRA+ over Lin reveals reduction in total PDGFRA+ fibroblasts in O2. (H) PDGFRA+Ki-67+ compared with total Lin fibroblasts reveals reduced proliferation in O2 until PN10, when it was increased compared with RA. In G and H, n = 4–6 RA and O2 mice were used. Two-tailed Student’s t test was used, *P < 0.05; **P < 0.01; ****P < 0.0001. Error bars show mean ± SEM. (I) MACS-isolated PDGFRA+ fibroblasts show reduced Pdgfra expression by RT-qPCR. n = 3–6 RA and O2 mice. Two-tailed Student’s t test was used, ****P < 0.0001. Error bars show mean ± SD. (J) Schematic showing loss of PDGFRA cell number and proliferation during hyperoxia early injury and recovery.
Figure 2
Figure 2. Loss of PDGFRA+ myofibroblasts and gain of PDGFRA+ lipofibroblasts during alveolarization in hyperoxia-exposed lungs.
(A) Signature genes for myofibroblasts were determined by downloading and comparing PN7 and PN10 markers genes for respective cell types from LGEA (51). Significant fold change (fold change > 2, binomTest P < 0.01, and reads per kilobase of transcript per million mapped reads > 1 in 2 of the 3 replicates in at least 1 condition being compared) displayed in a heatmap made in pheatmap (86). (B) Flow cytometry of PDGFRA+α-SMA+ fibroblasts compared with total Lin fibroblasts reveals significant reduction of PDGFRA+ myofibroblasts at PN7 in O2. (C) PN7 RA and O2 lungs immunostained for PDGFRA, ADRP, and α-SMA. Yellow arrows point to PDGFRA+ADRP+ cells, which are low in RA and enriched in O2, while white arrows point to PDGFRA+ADRP cells; scale bars = 50 μm. (D) Flow cytometry on PDGFRA+ADRP+ compared with total PDGFRA+ reveals that, among the PDGFRA+ population, there is a selection for lipofibroblasts at PN7 and PN10. In B and D, n = 4–6; control (RA) and experimental (O2) mice were used. A 2-tailed Student’s t test was used, *P < 0.05; ***P < 0.001. Error bars show mean ± SEM. (E) Top 50 lipofibroblast signature genes were obtained from a recently published mouse lung scRNA-Seq study, with heatmap of significant fold change created using pheatmap (86). (F) Schematic that shows dynamic changes in PDGFRA+ myo- and lipofibroblast RNA expression and cell populations.
Figure 3
Figure 3. Loss of PDGFRA+ myo/matrix fibroblasts in hyperoxia.
(A) Heatmap made in the pheatmap program of significantly changed matrix-fibroblast signature genes, identified using LGEA (https://research.cchmc.org/pbge/lunggens/mainportal.html) (51, 86) (B) PN7 RA and O2 immunofluorescence for PDGFRA (green), FN1 (red), and Ki-67 (white). Yellow arrows point to proliferating (nuclear Ki-67) PDGFRA+FN1+ matrix fibroblasts (FBs), which are largely absent from O2 lungs. White arrows point to nonproliferating PDGFRA+FN1 FBs. (C) PN7 RA and O2 immunofluorescence showing reduced matrix fibroblast marker CRTAP (white) in PDGFRA+ fibroblasts (green) in hyperoxia. Yellow arrows point to PDGFRA+CRTAP+ matrix fibroblasts, white arrows point to PDGFRA+CRTAP FBs. In B and C, scale bars = 50 μm. (DF) Flow cytometry. PDGFRA+ fibroblasts were gated using CD29 on the x axis and CD34 on the y axis (16, 17). (D) CD34+Ki-67+ matrix fibroblasts over total CD34+ are reduced in hyperoxia at PN4 and PN7 but are upregulated at PN10. (E) CD29+Ki-67+ myofibroblasts over total CD29+ are reduced in hyperoxia at PN4, unchanged at PN7, and upregulated at PN10. (F) CD29+CD34+Ki-67+ myo/matrix fibroblasts over total CD29+ CD34+ are reduced in hyperoxia at PN4, unchanged at PN7, and upregulated at PN10. In DF, n = 4–6, control (RA) and experimental (O2) mice were used. A 2-tailed Student’s t test was used, *P < 0.05; **P < 0.01; ***P < 0.001. Error bars show mean ± SEM. (G) Schematic showing dynamic changes in the PDGFRA+ matrix fibroblast RNA signature gene expression and cell population in hyperoxia and RA recovery.
Figure 4
Figure 4. PDGFRA+ fibroblasts exposed to hyperoxia fail to support epithelial differentiation in organoid culture.
(A) Organoids were made by coculturing fibroblasts from PN7 RA or O2-exposed (PN0–PN7, 90% O2) with adult RA epithelium, cultured for 3 weeks, and bright-field images were taken on fixed samples. Scale bar =1 mm. (B) Alveolar organoids were quantified on Nikon Elements by diameter, revealing reduced small colonies in hyperoxia. n = 8–10, control (RA) and experimental (O2) organoid transwells (replicates) were used. A 2-tailed Student’s t test was used, ****P < 0.0001. Error bars ± SD. (C, E, G, and I) Immunofluorescence on paraffin-embedded sections for markers of epithelial differentiation. Scale bars = 100 μm. (D, F, H, and J) Organoids were quantified using Nikon elements. Nuclear antibody stain HOPX was quantified by taking total antibody over DAPI, and cytoplasmic and membrane stains (SPC, AGER, CCSP) were quantified as % area over DAPI area. n = 8–10, control (RA) and experimental (O2) organoid transwells (replicates) were used. A 2-tailed Student’s t test was used, *P < 0.05; ****P < 0.0001. Data displayed as box-and-whisker plot. The box plots depict the minimum and maximum values (whiskers), the upper and lower quartiles, and the median. The length of the box represents the interquartile range. (K) Collagen contraction assay on PN7 PDGFRA+ RA and O2 fibroblasts was performed, then imaged after 3 days in culture. (L) Quantification of collagen assay average diameter in mm. Scale bar = 3.61 mm. Average diameter calculated, n = 5, RA and O2 collagen pellets were used. A 2-tailed Student’s t test was used, **P < 0.01. Error bars show mean ± SD. (M) Schematic showing how PN7 O2 PDGFRA+ fibroblasts fail to contract or support alveolar organoids in vitro.
Figure 5
Figure 5. Gene expression changes in hyperoxia fibroblasts predict WNT signaling as an upstream regulator.
(A) WNT-related gene changes and predictive network were generated by QIAGEN Ingenuity Pathway Analysis using genes significantly altered at PN4, PN7, and/or PN10 (87). (B) RT-qPCR on MACS-isolated PDGFRA+ fibroblasts validated expression of Fzd1, Fzd2, WNT5a, and Lgr6. n = 3–5, control (RA) and experimental (O2) mice were used. A 2-tailed Student’s t test was used, *P < 0.05; **P < 0.01; ****P < 0.0001. Error bars show mean ± SD.
Figure 6
Figure 6. CHIR and PDGF-AA rescue support of the alveolar niche.
(A) Collagen contraction assay on PN7 PDGFRA+ RA and O2 fibroblasts performed, treated with/without CHIR or recombinant hPDGF-AA (PDGF-AA), imaged after 2 days in culture, quantified by measuring collagen pellet area. n = 2–3 samples per group. (B) Organoids made by coculturing fibroblasts from PN7 RA or O2-exposed (PN0–PN7, 90% O2) with adult RA epithelium, treated with or without CHIR or PDGF-AA starting 7 days into culture. Bright-field images were taken on fixed samples after 3 weeks of growth. Scale bar = 2 mm. (C and D) Small alveolar and large alveolar organoids were quantified on Nikon Elements by restricting colony size to >100 μm and <250 μm in C and >250 μm and <500 μm in D. n = 2–10 Transwells (replicates). (E and I) Immunofluorescence on paraffin-embedded sections of organoids for markers of epithelial differentiation. Scale bar = 100 μm. (FH, J, and K) Organoids quantified using Nikon Elements. Nuclear antibody stain (HOPX, P63) quantified by taking total antibody over DAPI, and cytoplasmic and membrane stains (SPC, AGER, CCSP) were quantified as antibody area over DAPI area. n = 2–10, organoid Transwells (replicates) used, 3 slides per Transwell. The box plots are as defined in Figure 4. In A, C, D, FH, J, and K, 1-way ANOVA followed by Tukey’s multiple comparison was used to determine significance between 3 or more groups, *P < 0.05; **P < 0.01; ***P < 0.001; ****P < 0.0001. In A, C, and D, error bars show mean ± SEM. (L) Ratio of (AGER Area/DAPI Area)/(SPC Area/DAPI Area) within each image of O2 + CHIR versus O2 + PDGF-AA calculated to measure AT1/AT2 ratio. A 2-tailed Student’s t test was used, **P < 0.01. In FH and JL, data displayed as box-and-whisker plot.
Figure 7
Figure 7. Model.
In vivo hyperoxia exposure results in increased PDGFRA+ lipofibroblast differentiation. Reduced WNT signaling emanating from lipofibroblasts results in downregulation of AT1 and club cell differentiation. CHIR treatment of lung organoids made with hyperoxia fibroblasts restores AT2 cell (SPC) differentiation and AT1 progenitors (HOPX). PDGF-AA treatment of lung organoids made with hyperoxia fibroblasts restores AT1 differentiation (AGER).

Similar articles

Cited by

References

    1. Jobe AJ. The new BPD: an arrest of lung development. Pediatr Res. 1999;46(6):641–643. doi: 10.1203/00006450-199912000-00007. - DOI - PubMed
    1. Warburton D. Conserved mechanisms in the formation of the airways and alveoli of the lung. Front Cell Dev Biol. 2021;9:662059. doi: 10.3389/fcell.2021.662059. - DOI - PMC - PubMed
    1. Lapcharoensap W, et al. Hospital variation and risk factors for bronchopulmonary dysplasia in a population-based cohort. JAMA Pediatr. 2015;169(2):e143676. doi: 10.1001/jamapediatrics.2014.3676. - DOI - PubMed
    1. Thebaud B, et al. Bronchopulmonary dysplasia. Nat Rev Dis Primers. 2019;5(1):78. doi: 10.1038/s41572-019-0127-7. - DOI - PMC - PubMed
    1. Alvarez-Fuente M, et al. Preventing bronchopulmonary dysplasia: new tools for an old challenge. Pediatr Res. 2019;85(4):432–441. doi: 10.1038/s41390-018-0228-0. - DOI - PubMed

Publication types