. 2022 May;28(5):668-682.
doi: 10.1261/rna.078793.121. Epub 2022 Feb 2.

Precise gene models using long-read sequencing reveal a unique poly(A) signal in Giardia lamblia

Affiliations

Precise gene models using long-read sequencing reveal a unique poly(A) signal in Giardia lamblia

Danielle Y Bilodeau et al. RNA. 2022 May.

Abstract

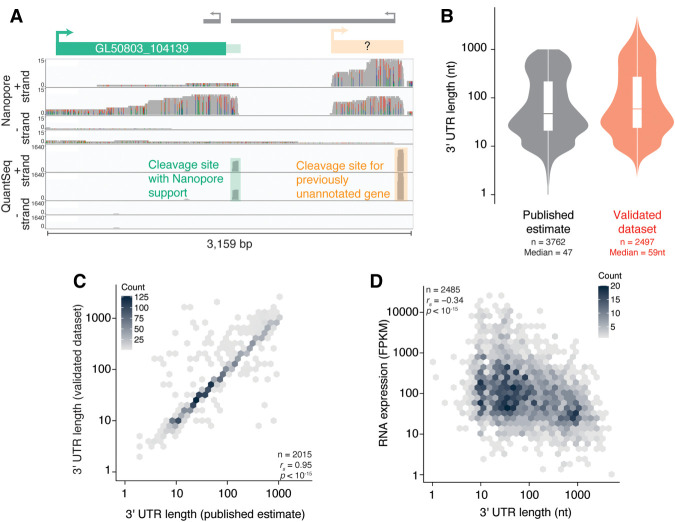
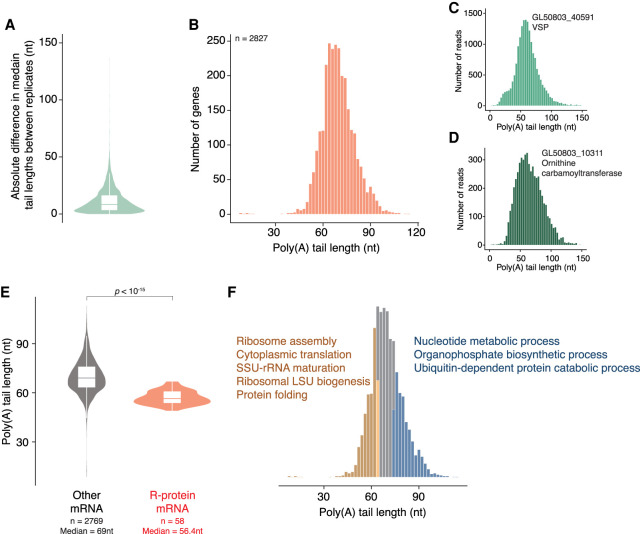
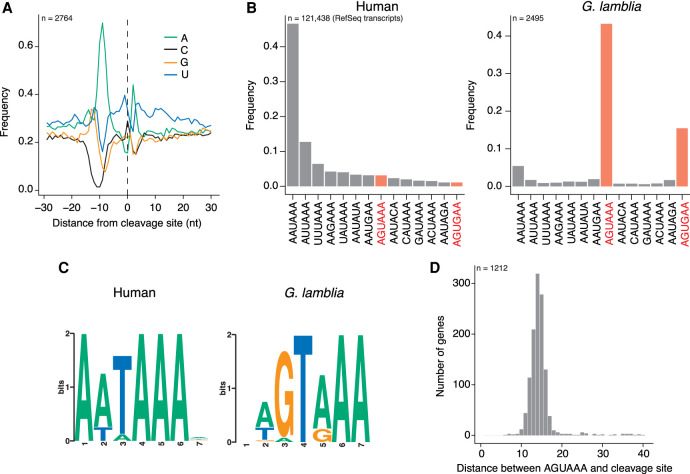
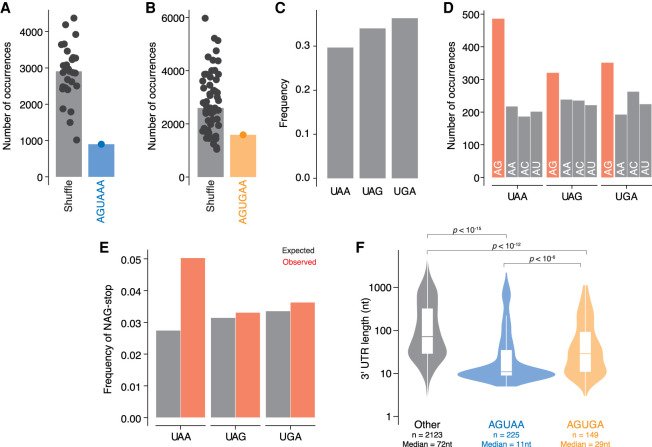
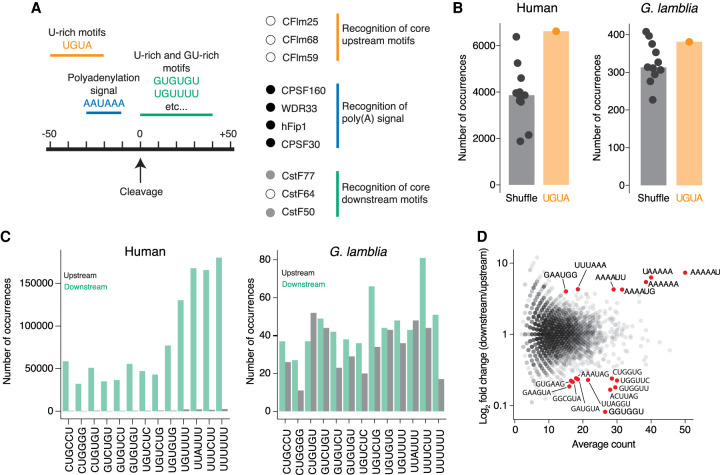
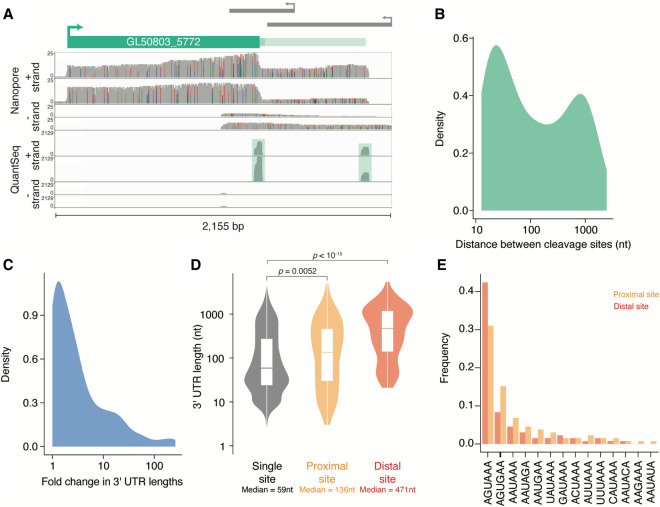
During pre-mRNA processing, the poly(A) signal is recognized by a protein complex that ensures precise cleavage and polyadenylation of the nascent transcript. The location of this cleavage event establishes the length and sequence of the 3' UTR of an mRNA, thus determining much of its post-transcriptional fate. Using long-read sequencing, we characterize the polyadenylation signal and related sequences surrounding Giardia lamblia cleavage sites for over 2600 genes. We find that G. lamblia uses an AGURAA poly(A) signal, which differs from the mammalian AAUAAA. We also describe how G. lamblia lacks common auxiliary elements found in other eukaryotes, along with the proteins that recognize them. Further, we identify 133 genes with evidence of alternative polyadenylation. These results suggest that despite pared-down cleavage and polyadenylation machinery, 3' end formation still appears to be an important regulatory step for gene expression in G. lamblia.

Keywords: 3′ UTR; Giardia lamblia; long-read sequencing; poly(A) site.


Figures

FIGURE 1.
FIGURE 1.
Characterization of G. lamblia 3′ ends at nucleotide resolution. (A) Genome browser image looking at the 3′ end of GL50803_104139 and displaying coverage of ONT libraries (top) and 3′-end libraries (bottom). Of the two cleavage sites predicted by the 3′-end libraries, one is supported by the ONT libraries (green box), while the other appears to belong to a previously unannotated transcript (orange box). (B) Distribution of 3′ UTR lengths in previously published work ((Franzén et al. 2013), left) and this study (right). (C) Hexagonal heatmap comparing published estimates of 3′ UTR lengths (x-axis) and the new data set from this study (y-axis). (D) 3′ UTR length is negatively correlated with expression. Shown is a hexagonal heatmap comparing 3′ UTR length (this study) and mRNA expression in Fragments Per Kilobase of transcript per Million mapped reads (FPKM, from accession number GSE158187).
FIGURE 2.
FIGURE 2.
Poly(A)-tail measurements provide new insights. (A) Violin plot showing the absolute difference in poly(A)-tail measurements between ONT replicates. (B) Distribution of median poly(A)-tail length across both ONT replicates. Only mRNAs with a combined minimum of 10 reads are included. Median is 69 nt. (C) Distribution of poly(A)-tail lengths for reads aligning to GL50803_40591. (D) As in C but for GL50803_10311. (E) Comparison of poly(A)-tail length between mRNAs encoding ribosomal proteins (median 56.4 nt) and all other mRNAs (median 69.0 nt). Only genes with a minimum of 10 ONT reads were selected for this analysis. (F) GEO enrichment terms for genes with short (orange) or long (blue) poly(A) tails. Only genes with a minimum of 10 ONT reads were selected for this analysis.
FIGURE 3.
FIGURE 3.
G. lamblia uses an unusual poly(A) signal. (A) Nucleotide frequency in the 60-nt window centered on all 2860 validated cleavage sites from this study. (B) Frequency of common poly(A) signals identified in studies of human transcripts (Beaudoing 2000). Sequences 30 nt upstream of cleavage sites from the human RefSeq annotations and validated G. lamblia sites from this study were used to search for common motifs. Plotted is the frequency of each signal in human (left) and G. lamblia (right). (C) MEME analysis of upstream sequences. The same sequences as in B were uploaded to the meme-suite, and a search was conducted for enriched hexamers. Shown is the top motif for human (left) and G. lamblia (right). (D) For all validated cleavage sites containing an AGUAAA motif in the last 40 nt of the mRNA, this bar graph shows the distance between the motif and the end of the read. Distances are counted from the first A of the motif.
FIGURE 4.
FIGURE 4.
Implications of unusual poly(A) signal on G. lamblia open reading frames. (A) Open reading frames are depleted for G. lamblia's poly(A) signal. Open reading frame sequences were used to count the occurrence of AGUAAA vs all shuffled versions of the motif. (B) As in A, but with the AGUGAA poly(A) signal. (C) Frequency of stop codons across all annotated G. lamblia open reading frames. (D) Nucleotides preceding a stop are enriched for AG over other AN dinucleotides. For each stop codon, this bar graph shows how many were preceded by the different AN dinucleotide sequences. (E) As in D, but comparing expected versus observed frequencies. The expected frequency for each sequence context was calculated from the total frequency of each codon across all open reading frames. (F) Distribution of 3′ UTR lengths for genes where there is no overlap of poly(A) signal and stop codon (left), genes where there is an AG dinucleotide preceding a UAA stop codon (middle), and genes where there is an AG preceding a UGA stop codon (right).
FIGURE 5.
FIGURE 5.
Conserved auxiliary elements are poorly enriched around G. lamblia cleavage sites. (A) Conserved pre-mRNA processing proteins and the sequences they recognize. The left panel shows the location and motifs of key sequences found around human cleavage sites. Right panel shows the human orthologs of core processing complexes for the recognition of poly(A) signals and surrounding sequences. Dots indicate whether an ortholog was readily identifiable in G. lamblia (black circle), whether ortholog identification was ambiguous (gray circle), or whether no orthologs were found (white circle). (B) The conserved UGUA motif is not enriched upstream of G. lamblia cleavage sites. Sequences 20 to 50 nt upstream of cleavage sites were used to count the frequency of UGUA or shuffled versions of the motif. Plotted is the number of times each motif was found in human (left) and G. lamblia (right) sequences. (C) GU-rich elements are not enriched downstream from G. lamblia cleavage sites. Sequences 40 nt up- and downstream from human and G. lamblia cleavage sites were used to count the occurrence of U- and GU-rich motifs enriched downstream from strong human cleavage sites (Hu et al. 2005). Plotted is the frequency of each motif upstream (gray) or downstream (green) of human (left) and G. lamblia (right) cleavage sites. (D) MA plot of enriched and depleted 6-mer sequences around polyadenylation signals. All single cleavage site genes from our data set that contain an AGUAAA were selected for this analysis. Sequences 50 nt upstream and downstream from the signal were used to search for all possible 6-nt motifs. Plotted is the average count of each motif versus its enrichment in downstream sequences. Red dots are motifs that showed at least a fourfold enrichment or depletion in downstream regions and with an average count of at least 15 occurrences.
FIGURE 6.
FIGURE 6.
Evidence of alternative polyadenylation in G. lamblia. (A) Genome browser image looking at the 3′ end of GL50803_5772 and displaying coverage of ONT libraries (top) and 3′-end libraries (bottom). Both methods support the presence of two distinct cleavage sites for the gene. (B) Density plot showing the distribution of lengths between proximal and distal cleavage sites for the genes that have more than one cleavage site. The median is 81 nt. (C) Density plot showing the fold change in 3′ UTR length between distal and proximal cleavage sites. Median is a 2.18-fold change. (D) Distribution of 3′ UTR lengths for genes with a single cleavage site (left), the proximal sites for APA genes (middle), and the distal sites (right). (E) Poly(A) signal usage in APA genes. Sequences 30 nt upstream of proximal and distal cleavage sites were used to search for the motifs described in Figure 2B. Plotted is the frequency of each motif across proximal (orange) and distal (red) cleavage sites.
Danielle Bilodeau
Danielle Bilodeau

Similar articles

Cited by

References

    1. Adiconis X, Borges-Rivera D, Satija R, DeLuca DS, Busby MA, Berlin AM, Sivachenko A, Thompson DA, Wysoker A, Fennell T, et al. 2013. Comparative analysis of RNA sequencing methods for degraded or low-input samples. Nat Methods 10: 623–629. 10.1038/nmeth.2483 - DOI - PMC - PubMed
    1. Ankarklev J, Jerlström-Hultqvist J, Ringqvist E, Troell K, Svärd SG. 2010. Behind the smile: cell biology and disease mechanisms of Giardia species. Nat Rev Microbiol 8: 413–422. 10.1038/nrmicro2317 - DOI - PubMed
    1. Ashburner M, Ball CA, Blake JA, Botstein D, Butler H, Cherry JM, Davis AP, Dolinski K, Dwight SS, Eppig JT, et al. 2000. Gene Ontology: tool for the unification of biology. Nat Genet 25: 25–29. 10.1038/75556 - DOI - PMC - PubMed
    1. Baejen C, Torkler P, Gressel S, Essig K, Söding J, Cramer P. 2014. Transcriptome maps of mRNP biogenesis factors define pre-mRNA recognition. Mol Cell 55: 745–757. 10.1016/j.molcel.2014.08.005 - DOI - PubMed
    1. Bailey TL, Boden M, Buske FA, Frith M, Grant CE, Clementi L, Ren J, Li WW, Noble WS. 2009. MEME SUITE: tools for motif discovery and searching. Nucleic Acids Res 37: W202–W208. 10.1093/nar/gkp335 - DOI - PMC - PubMed

Publication types