. 2022 Feb 2;17(1):13.
doi: 10.1186/s13024-022-00516-0.

Selective reduction of astrocyte apoE3 and apoE4 strongly reduces Aβ accumulation and plaque-related pathology in a mouse model of amyloidosis

Affiliations

Selective reduction of astrocyte apoE3 and apoE4 strongly reduces Aβ accumulation and plaque-related pathology in a mouse model of amyloidosis

Thomas E Mahan et al. Mol Neurodegener. .

Abstract

Background: One of the key pathological hallmarks of Alzheimer disease (AD) is the accumulation of the amyloid-β (Aβ) peptide into amyloid plaques. The apolipoprotein E (APOE) gene is the strongest genetic risk factor for late-onset AD and has been shown to influence the accumulation of Aβ in the brain in an isoform-dependent manner. ApoE can be produced by different cell types in the brain, with astrocytes being the largest producer of apoE, although reactive microglia also express high levels of apoE. While studies have shown that altering apoE levels in the brain can influence the development of Aβ plaque pathology, it is not fully known how apoE produced by specific cell types, such as astrocytes, contributes to amyloid pathology.

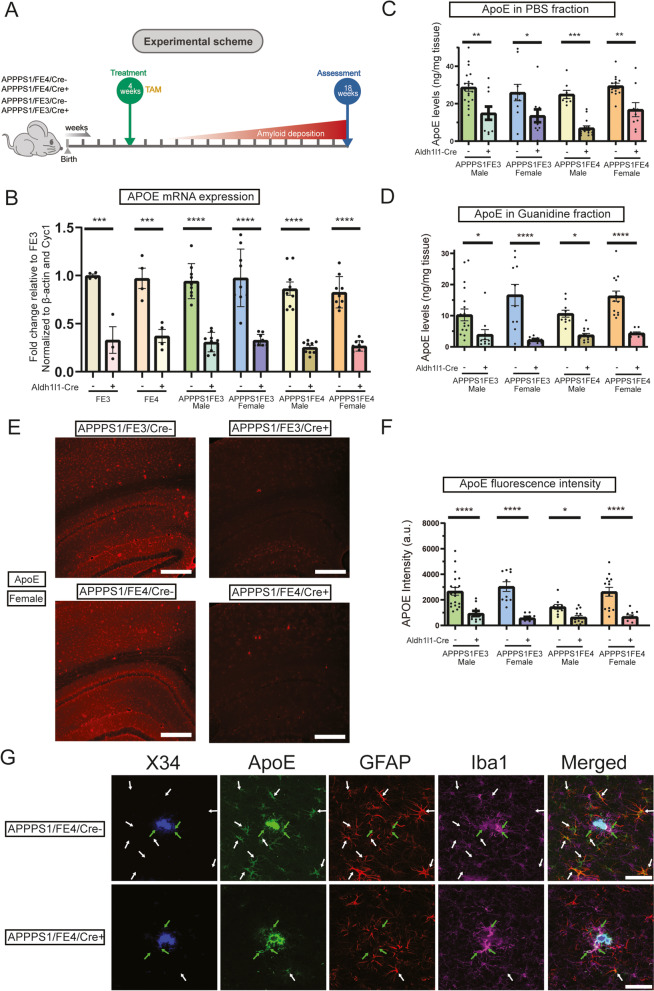
Methods: We utilized APOE knock-in mice capable of having APOE selectively removed from astrocytes in a tamoxifen-inducible manner and crossed them with the APP/PS1-21 mouse model of amyloidosis. We analyzed the changes to Aβ plaque levels and assessed the impact on cellular responses to Aβ plaques when astrocytic APOE is removed.

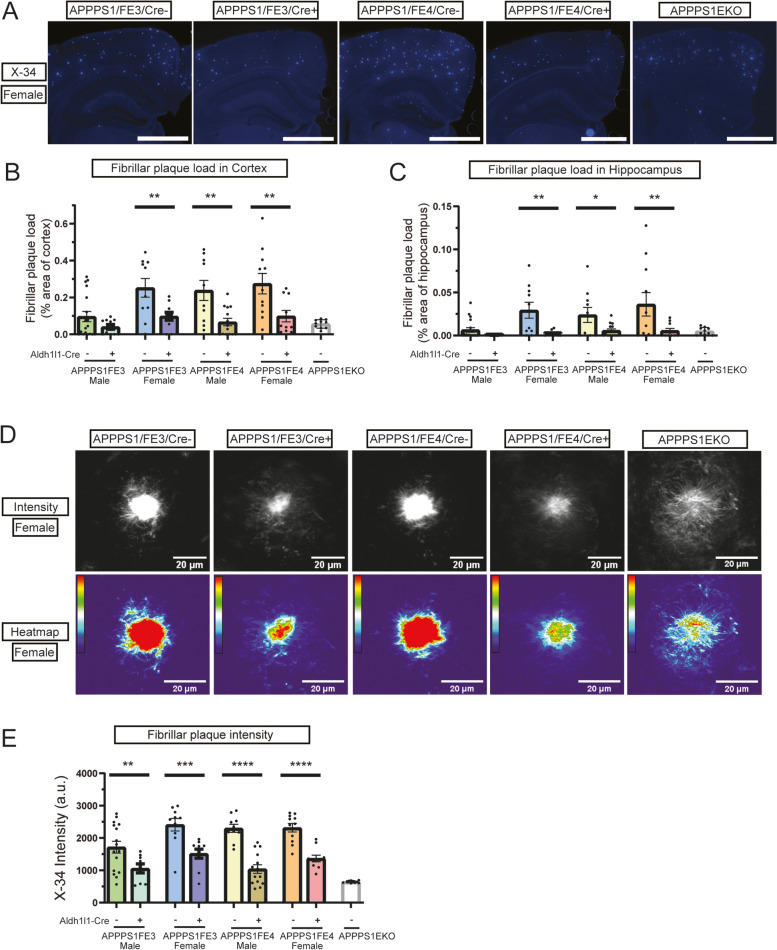
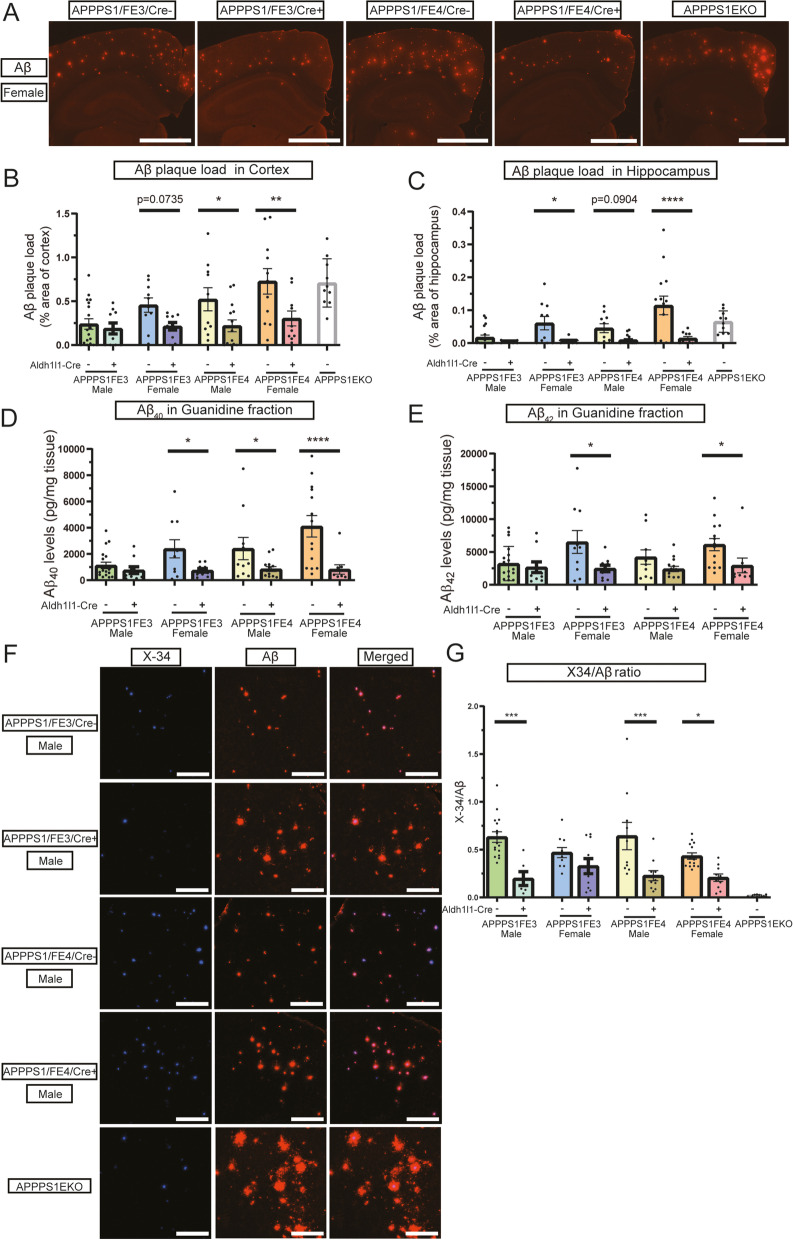
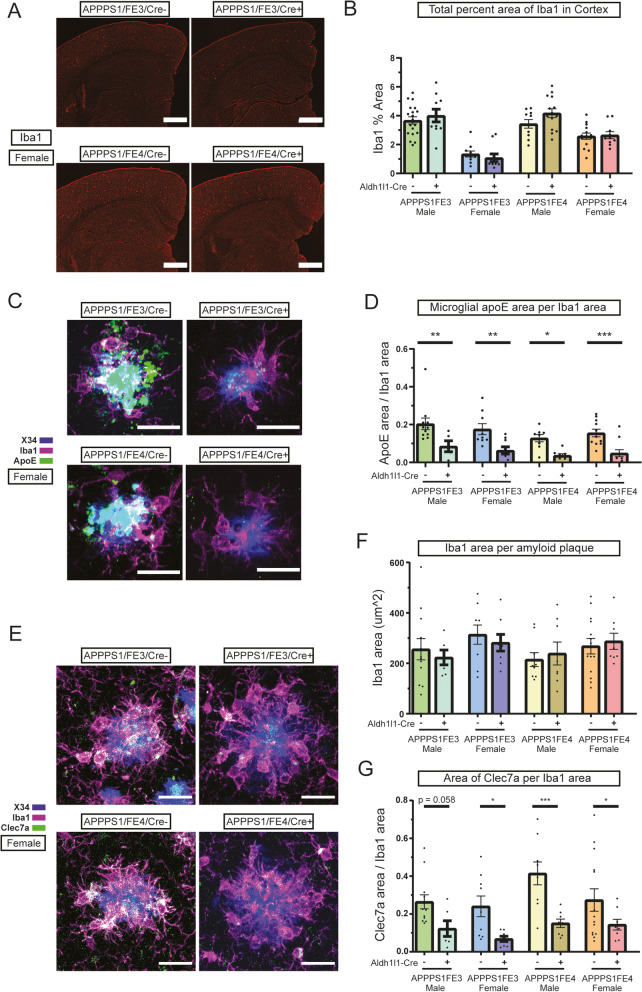
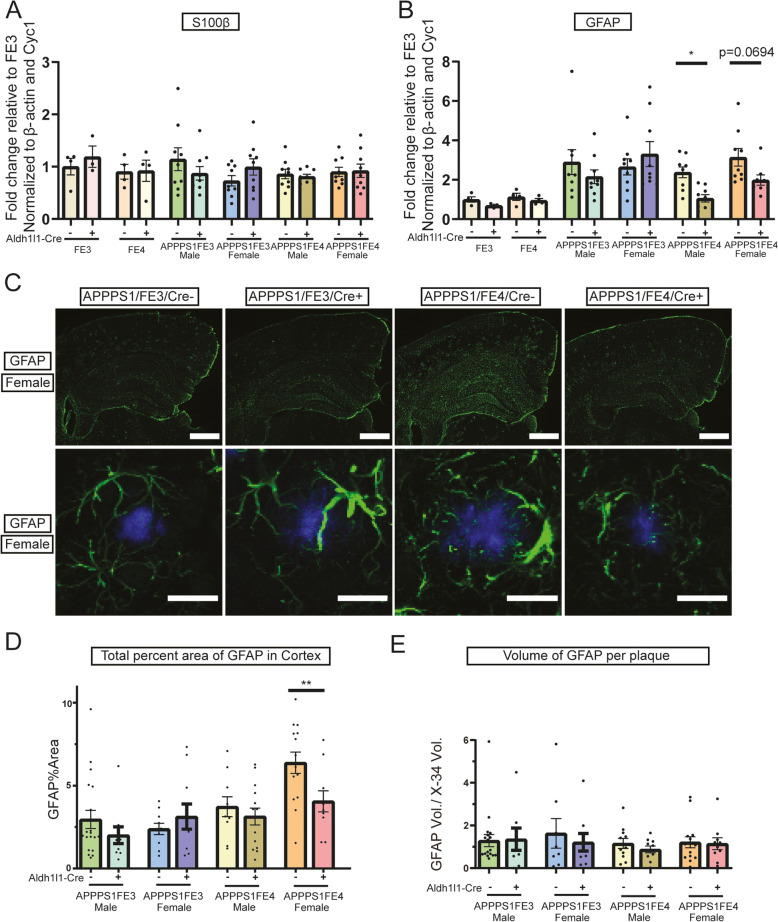
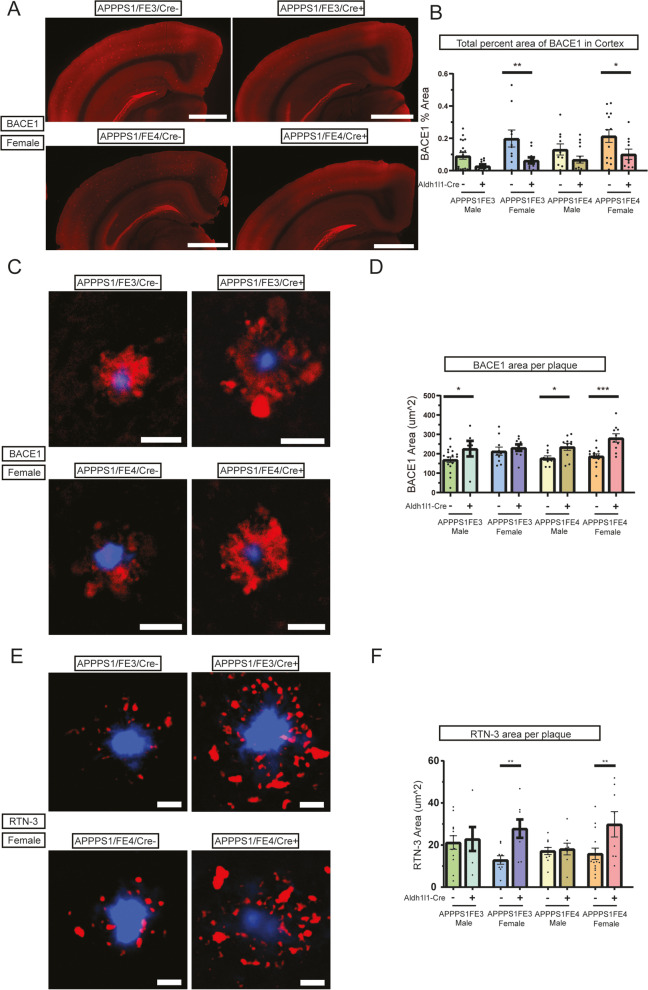
Results: Tamoxifen administration was capable of strongly reducing apoE levels in the brain by markedly reducing astrocyte apoE, while microglial apoE expression remained. Reduction of astrocytic apoE3 and apoE4 led to a large decrease in Aβ plaque deposition and less compact plaques. While overall Iba1+ microglia were unchanged in the cortex after reducing astrocyte apoE, the expression of the disease-associated microglial markers Clec7a and apoE were lower around amyloid plaques, indicating decreased microglial activation. Additionally, astrocyte GFAP levels are unchanged around amyloid plaques, but overall GFAP levels are reduced in the cortex of female apoE4 mice after a reduction in astrocytic apoE. Finally, while the amount of neuritic dystrophy around remaining individual plaques was increased with the removal of astrocytic apoE, the overall amount of cortical amyloid-associated neuritic dystrophy was significantly decreased.

Conclusion: This study reveals an important role of astrocytic apoE3 and apoE4 on the deposition and accumulation of Aβ plaques as well as on certain Aβ-associated downstream effects.

Keywords: Aldh1l1-Cre; Alzheimer disease; Amyloid; Apolipoprotein E; Astrocyte; Aβ; apoE.


Conflict of interest statement

D.M.H. is as an inventor on a patent licensed by Washington University to C2N Diagnostics on the therapeutic use of anti-tau antibodies. D.M.H. co-founded and is on the scientific advisory board of C2N Diagnostics. C2N Diagnostics has licensed certain anti-tau antibodies to AbbVie for therapeutic development. D.M.H. is on the scientific advisory board of Denali and consults for Genentech, Merck, and Cajal Neuroscience. All other authors have no competing interests.

Figures

Fig. 1
Fig. 1
Tamoxifen administration reduces ApoE levels in Aldh1l1-Cre + APPPS1;FE3Cre- and APPPS1;FE4Cre- mice. A Timeline of the experimental scheme. Mice were given once-daily IP injections of tamoxifen (TAM) (100 mg TAM/kg body weight) at 4 weeks of age for 6 consecutive days. Sample collection and analysis occurred at 18 weeks of age. B APOE mRNA expression levels in Cre- and Cre + FE3, FE4, APPPS1;FE3, and APPPS1;FE4 mice. Cortical tissue samples were analyzed by qPCR (n = 9). C Soluble apoE levels in the cortex of Cre- or Cre + mice. Cortical tissue samples were homogenized in PBS and PBS-soluble apoE protein levels were analyzed by ELISA (n = 9–19). D Insoluble apoE levels in the cortex of Cre- or Cre + mice. PBS-insoluble cortex tissue samples from (C) were further homogenized in 5 M guanidine HCl to determine the amount of PBS-insoluble apoE that was guanidine-soluble. Protein levels were analyzed by ELISA (n = 9–19). E ApoE immunostaining in the cortex and hippocampus of Cre-and Cre + mice. Representative images are of female brain sections stained with an anti-apoE antibody. Scale bars = 300 μm. F Intensity of fluorescent apoE staining in Cre- or Cre + mice. The average pixel intensity was analyzed from images of apoE immunostained brain sections (n = 10–19). G Brain sections from female APPPS1;FE4Cre- and APPPS1;FE4Cre + mice co-stained for X-34 (blue), apoE (green), GFAP (red), and Iba1 (magenta). White arrows indicate co-localization of apoE with GFAP and green arrows indicate co-localization of apoE with Iba1. Scale bars = 50 μm. A-G * p ≤ 0.05, ** p ≤ 0.01, and **** p ≤ 0.0001; two-way ANOVA and Sidak’s post hoc test in (B), three-way ANOVA and Sidak’s post hoc test in (D); three-way ANOVA and uncorrected Fisher’s LSD test in (C) and (F). Data are expressed as mean ± SEM. See Supplementary Table 1 for detailed statistics
Fig. 2
Fig. 2
Reducing astrocytic apoE decreases fibrillar plaque levels and plaque intensity. A Fibrillar amyloid plaque staining in the cortex and hippocampus of female Cre-, Cre+, and APPPS1EKO mice. Representative images are of X-34 (blue) stained female brain sections. Scale bars = 1000 μm (B) Fibrillar plaque load in the cortex of Cre-, Cre+, and APPPS1EKO mice. Percent of cortex area covered by fibrillar plaque was determined by analyzing X-34 stained brain sections (n = 10–18). C Fibrillar plaque load in hippocampus of Cre-, Cre+, and APPPS1EKO mice. Percent of hippocampus area covered by fibrillar plaque was determined by analyzing X-34 stained brain sections (n = 10–18). D Intensity of fibrillar amyloid plaques in Cre-, Cre+, and APPPS1EKO mice. Representative images are of female X-34 stained amyloid plaques. Scale bars = 20 μm. E Measure of average pixel intensity of X-34 stained fibrillar plaques in the cortex of Cre-, Cre+, and APPPS1EKO mice (n = 9–16). A-E * p ≤ 0.05, ** p ≤ 0.01, *** p ≤ 0.001, and **** p ≤ 0.0001; three-way ANOVA and uncorrected Fisher’s LSD test in (B), (C), and (E). Data are expressed as mean ± SEM. See Supplementary Table 1 for detailed statistics
Fig. 3
Fig. 3
Reducing astrocytic apoE decreases Aβ plaque levels and alters Aβ deposition. A Aβ plaque staining in the cortex and hippocampus of Cre-, Cre+, and APPPS1EKO mice. Representative images are of Aβ immunostained female brain sections using the HJ3.4 anti-Aβ antibody (orange). Scale bars = 1000 μm. B Aβ plaque load in cortex of Cre-, Cre+, and APPPS1EKO mice. Percent of cortex area covered by Aβ plaque was determined by analyzing HJ3.4 stained brain sections (n = 10–18). C Aβ plaque load in the hippocampus of Cre-, Cre+, and APPPS1EKO mice. Percent of hippocampus area covered by Aβ plaque was determined by analyzing HJ3.4 stained brain sections (n = 10–18). D Insoluble Aβ40 levels in the cortex of Cre- and Cre + mice. PBS-insoluble cortical tissue samples that were further homogenized in 5 M guanidine HCl were analyzed by ELISA to determine the guanidine-soluble Aβ40 levels (n = 9–19). E Insoluble Aβ42 levels in the cortex of Cre- and Cre + mice. PBS-insoluble cortex tissue samples that were further homogenized in 5 M guanidine HCl were analyzed by ELISA to determine the guanidine-soluble Aβ42 levels (n = 9–19). F Deposition pattern of Aβ plaque and fibrillar amyloid plaque staining in Cre-, Cre+, and APPPS1EKO mice. Representative images are of X-34 (blue) and HJ3.4 (orange) co-stained male brain sections. Scale bars = 50 μm. G Ratio of fibrillar Aβ plaques to total Aβ deposition in Cre-, Cre+, and APPPS1EKO. The ratio was determined by dividing the area of X-34 staining by the area of HJ3.4 staining. (n = 6–16) (A-F) * p ≤ 0.05, ** p ≤ 0.01, *** p ≤ 0.001, and **** p ≤ 0.0001; three-way ANOVA and Sidak’s post hoc test in (B) and (C); three-way ANOVA and uncorrected Fisher’s LSD test in (D), (E), and (G). Data are expressed as mean ± SEM. See Supplementary Table 1 for detailed statistics
Fig. 4
Fig. 4
Microglial activation is reduced in mice with a decrease in astrocytic apoE. A Microglia staining in the cortex and hippocampus of female Cre- and Cre + mice. Representative images are of female brain sections immunostained using an anti-Iba1 antibody (red). Scale bars = 200 μm. B Microglial coverage in the cortex of Cre- and Cre + mice. Percent of cortex area covered by microglia was determined by analyzing Iba1 stained brain sections (n = 10–19). C ApoE+ microglia around fibrillar amyloid plaques in female Cre- and Cre + mice. Representative images are of apoE immunostaining (green) using an anti-apoE antibody and microglia immunostaining using an anti-Iba1 antibody (magenta) around X-34 stained (blue) amyloid plaques. ApoE co-localized with Iba1 appears white. Scale bars = 20 μm. D Microglial apoE levels around fibrillar amyloid plaques in Cre- and Cre + mice. Area of apoE+ microglia per total microglia area was determined by analyzing the level of apoE+ microglia staining to total microglia staining within 10 μm of X-34 stained plaques (n = 5–12). E Microglia clustering and activated microglia around fibrillar amyloid plaques in female Cre- and Cre + mice. Representative images are of Clec7a immunostaining (green), using an anti-Clec7a antibody, and microglia immunostaining using an anti-Iba1 antibody (magenta) around X-34 stained (blue) amyloid plaques. Clec7a co-localized with Iba1 appears white. Scale bars = 20 μm. F Clustering of microglia around fibrillar amyloid plaques in Cre- or Cre + mice. Area covered by microglia around fibrillar amyloid plaques was determined by analyzing the level of Iba1 staining within 15 μm of X-34 stained plaques (n = 6–14). G Coverage of activated microglia around fibrillar amyloid plaques in Cre- or Cre + mice. Area of activated microglia around fibrillar amyloid plaques was determined by analyzing the level of cleca7a staining within 15 μm of X-34 stained plaques per total area of Iba1 (n = 6–14). A-G * p ≤ 0.05, ** p ≤ 0.01, *** p ≤ 0.001; three-way ANOVA and uncorrected Fisher’s LSD test in (B), (D), (F), and (G). Data are expressed as mean ± SEM. See Supplementary Table 1 for detailed statistics
Fig. 5
Fig. 5
Astrocyte activation is reduced in APPPS1;FE4Cre + mice. A Gene expression analysis of S100β in Cre-, Cre + FE3Cre-, FE3Cre+, FE4Cre-, and FE4Cre + mice. Graph is of S100β gene levels assessed by qPCR from cortical tissue samples (n = 3–9). B Gene expression analysis of GFAP in Cre-, Cre + FE3Cre-, FE3Cre+, FE4Cre-, and FE4Cre + mice. Graph is of GFAP gene levels assessed by qPCR from cortical tissue samples (n = 3–9). C Activated astrocyte staining in female Cre- and Cre + mice. Representative images in the top panel are of the cortex and hippocampus from brain sections immunostained using an anti-GFAP antibody (green). Images in the bottom panels are of GFAP immunostaining (green), using an anti-GFAP antibody, around X-34 stained amyloid plaques (blue). Scale bars = 200 μm (top panels), 20um (bottom panels). D Astrocyte activation in the cortex of Cre- or Cre + mice. Percent of cortical area covered by activated astrocytes was determined by analyzing GFAP stained brain sections (n = 10–14). E Astrocyte activation around fibrillar amyloid plaques in Cre- and Cre + mice. The volume of activated astrocyte processes around fibrillar amyloid plaques was determined by analyzing the amount of GFAP staining within 15 μm of X-34 stained plaques. GFAP volume was divided by the X-34 volume to normalize to the amount of plaque and account for differences in plaque size (n = 8–19). A-D * p ≤ 0.05, ** p ≤ 0.01; three way ANOVA and uncorrected Fisher’s LSD test in (A), (B), (D), and (E). Data are expressed as mean ± SEM. See Supplementary Table 1 for detailed statistics
Fig. 6
Fig. 6
Neuritic dystrophy is increased around plaques, but decreased overall, with a reduction in astrocytic apoE. A Dystrophic neurite staining in the cortex and hippocampus of Cre- and Cre + mice. Representative images are of brain sections immunostained using an anti-BACE1 antibody (red). Scale bars = 1000 μm. B Level of neuritic dystrophy in the cortex of Cre- and Cre + mice. Percent of cortical area covered by dystrophic neurites was determined by analyzing BACE1 stained brain sections (n = 10–19). C Dystrophic neurites around fibrillar amyloid plaques in Cre- and Cre + mice (BACE1). Representative images are of BACE1 immunostaining (red), using an anti-BACE1 antibody, around X-34 stained (blue) amyloid plaques. Scale bars = 20 μm. D Level of neuritic dystrophy around fibrillar amyloid plaques in Cre- and Cre + mice (BACE1). Percent of area covered by dystrophic neurites around fibrillar amyloid plaques was determined by analyzing the level of BACE1 staining within 15 μm of X-34 stained plaques (n = 6–18). E Dystrophic neurites around fibrillar amyloid plaques in Cre- and Cre + mice (RTN-3). Representative images are of female RTN-3 immunostaining (red), using an anti-RTN-3 antibody, around X-34 stained (blue) amyloid plaques. Scale bars = 20 μm. F Level of neuritic dystrophy around fibrillar amyloid plaques in Cre- and Cre + mice (RTN-3). Percent of area covered by dystrophic neurites around fibrillar amyloid plaques was determined by analyzing the level of RTN-3 staining within 15 μm of X-34 stained plaques (n = 6–14). A-D * p ≤ 0.05, ** p ≤ 0.01, and **** p ≤ 0.0001; three-way ANOVA and Sidak’s post hoc test in (B); three-way ANOVA and uncorrected Fisher’s LSD test in (D) and (F). Data are expressed as mean ± SEM. See Supplementary Table 1 for detailed statistics

Similar articles

Cited by

References

    1. 2021 Alzheimer’s disease facts and figures. Alzheimers Dement. 2021;17:327–406. https://pubmed.ncbi.nlm.nih.gov/33756057/. - PubMed
    1. International AD. Guerchet M, Prince M. Numbers of people with dementia around the world. 2020.
    1. Holtzman DM, Herz J, Bu G. Apolipoprotein E and apolipoprotein E receptors: Normal biology and roles in Alzheimer disease. Cold Spring Harb Perspect Med. 2012;2:a006312. - PMC - PubMed
    1. Jansen WJ, Ossenkoppele R, Knol DL, Tijms BM, Scheltens P, Verhey FRJ, et al. Prevalence of cerebral amyloid pathology in persons without dementia: a meta-analysis. JAMA - J Am Med Assoc. 2015;313:1924–1938. - PMC - PubMed
    1. Strittmatter WJ, Saunders AM, Schmechel D, Pericak-Vance M, Enghild J, Salvesen GS, et al. Apolipoprotein E: high-avidity binding to beta-amyloid and increased frequency of type 4 allele in late-onset familial Alzheimer disease. Proc Natl Acad Sci U S A. 1993;90:1977–1981. - PMC - PubMed

Publication types