. 2022 Mar 23;42(12):2584-2597.
doi: 10.1523/JNEUROSCI.1659-21.2021. Epub 2022 Feb 1.

Anastasis Drives Senescence and Non-Cell Autonomous Neurodegeneration in the Astrogliopathy Alexander Disease

Affiliations

Anastasis Drives Senescence and Non-Cell Autonomous Neurodegeneration in the Astrogliopathy Alexander Disease

Liqun Wang et al. J Neurosci. .

Abstract

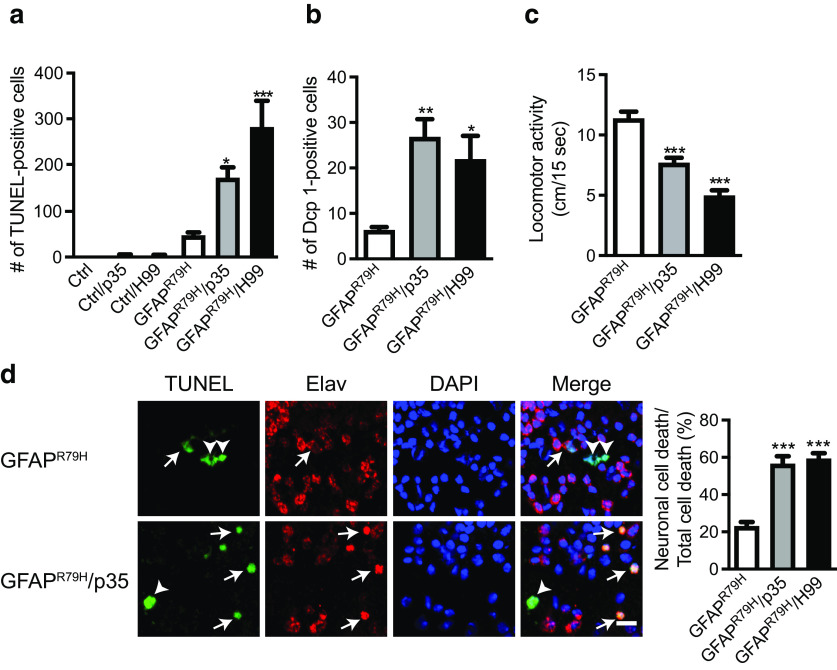
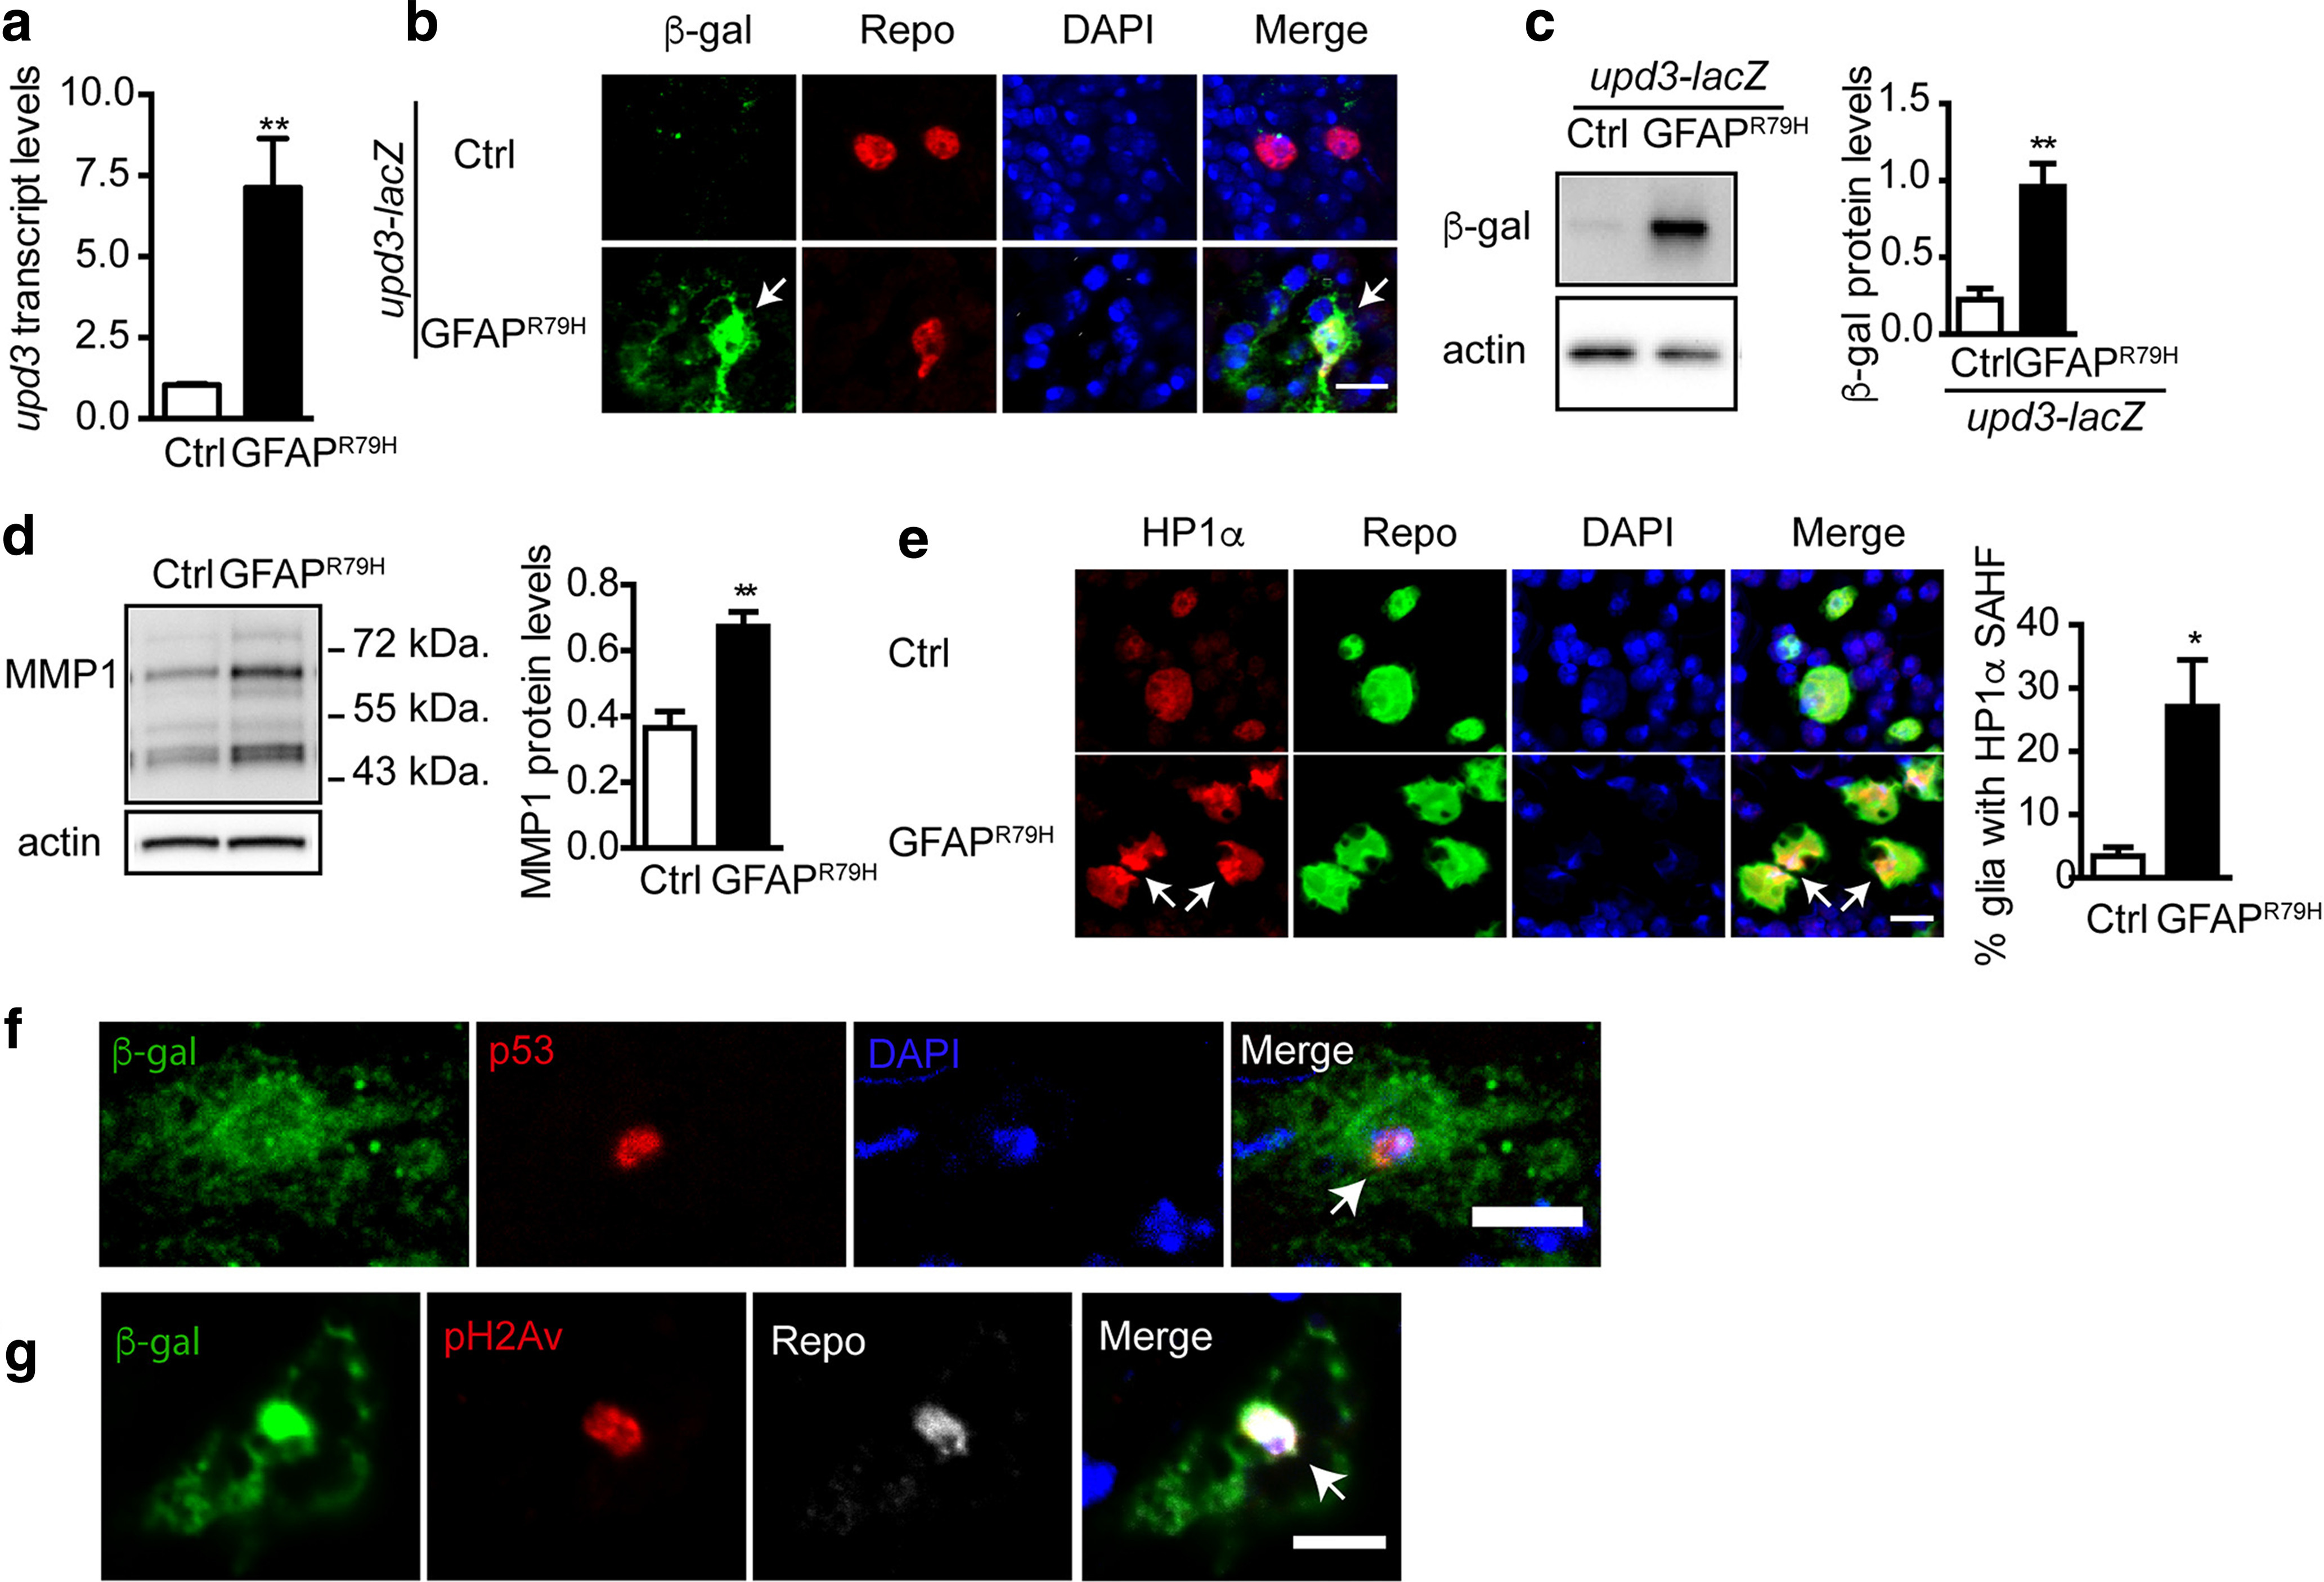
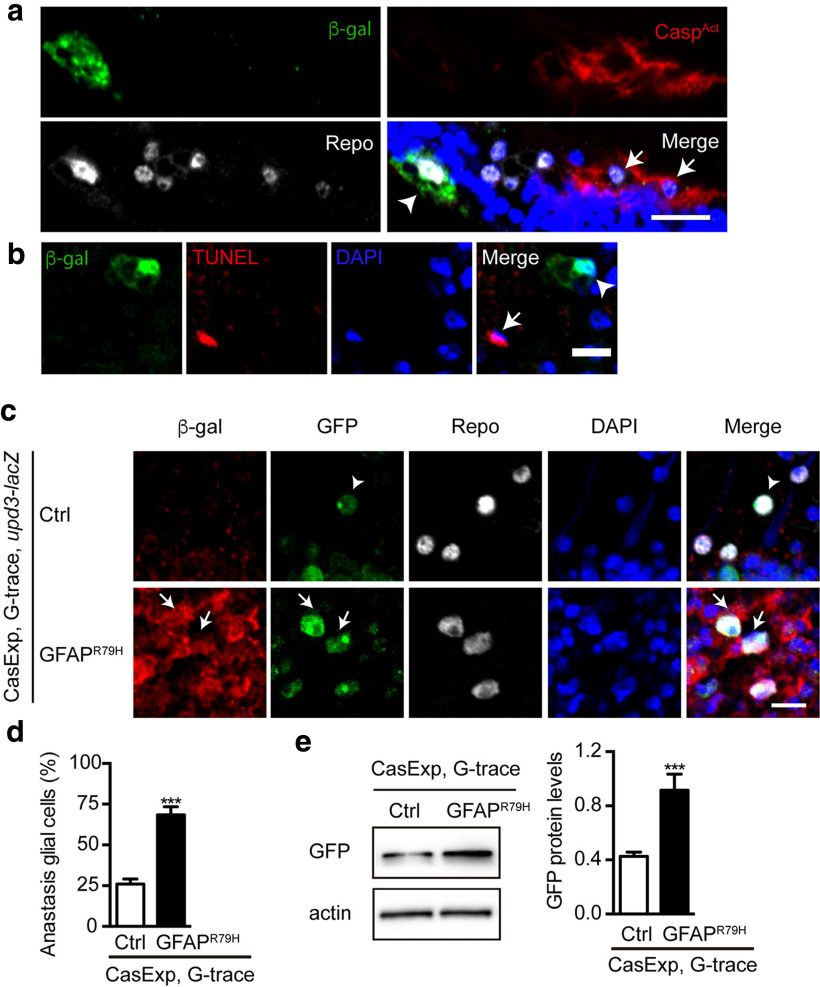
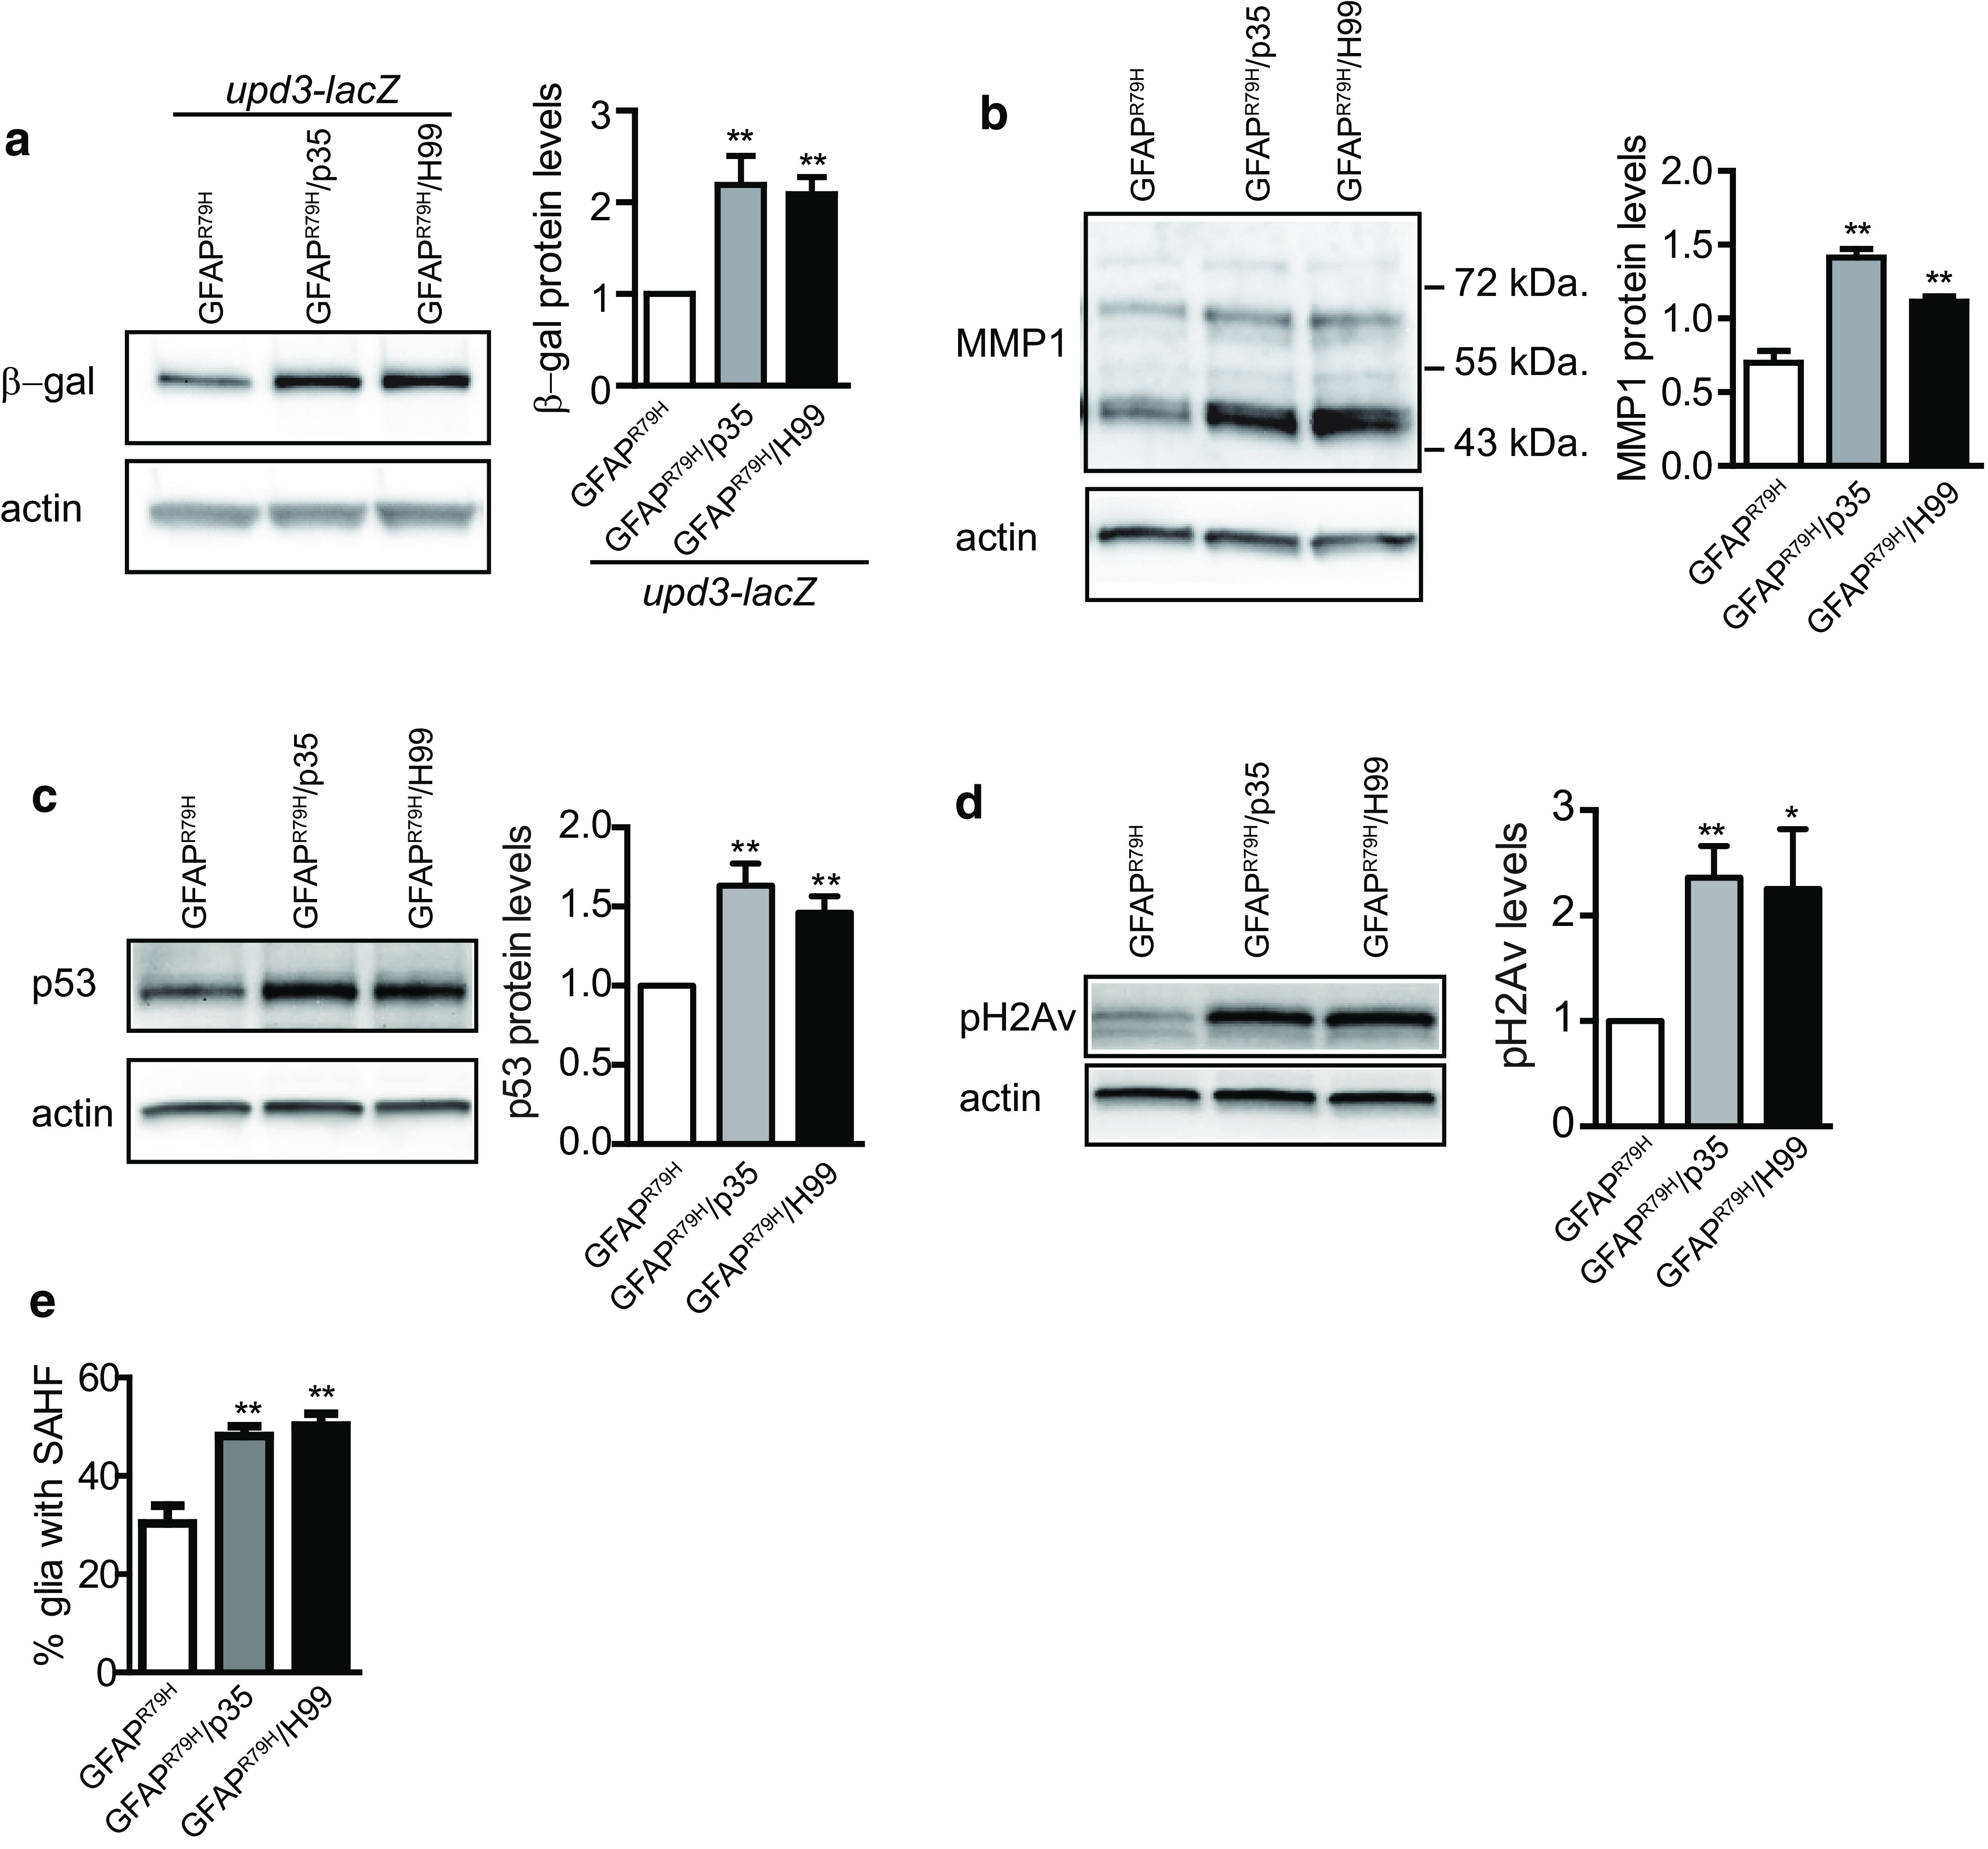
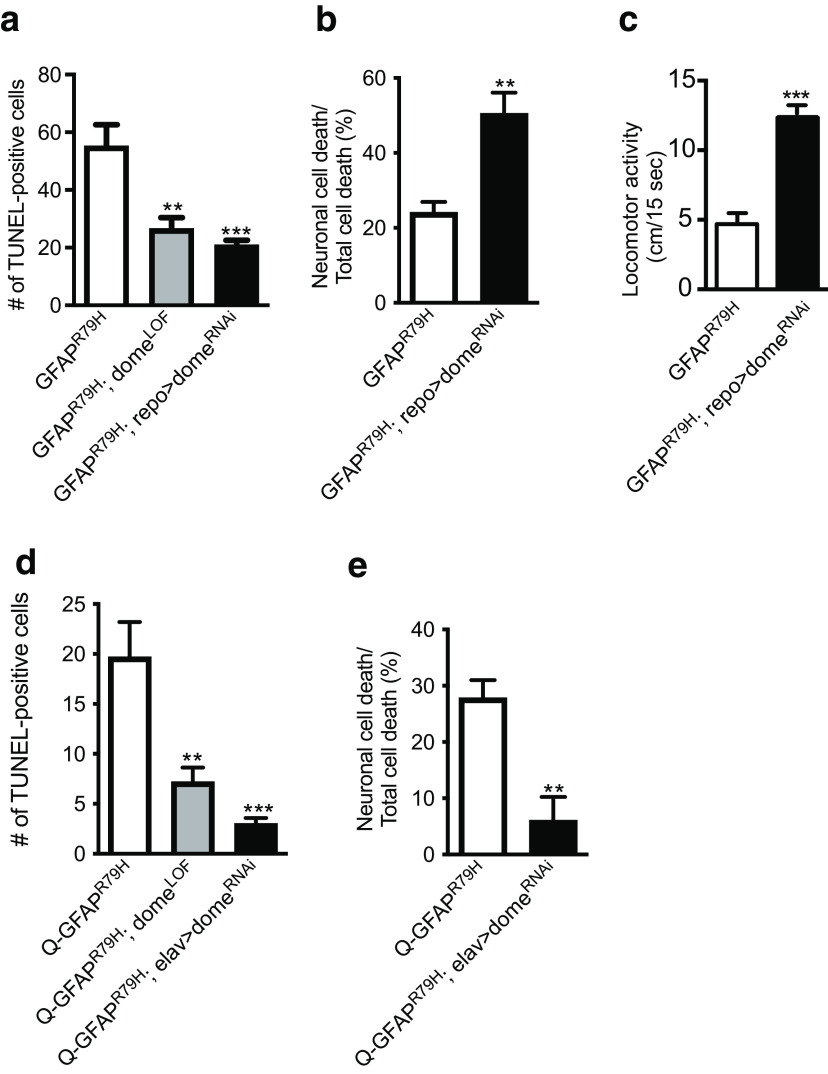
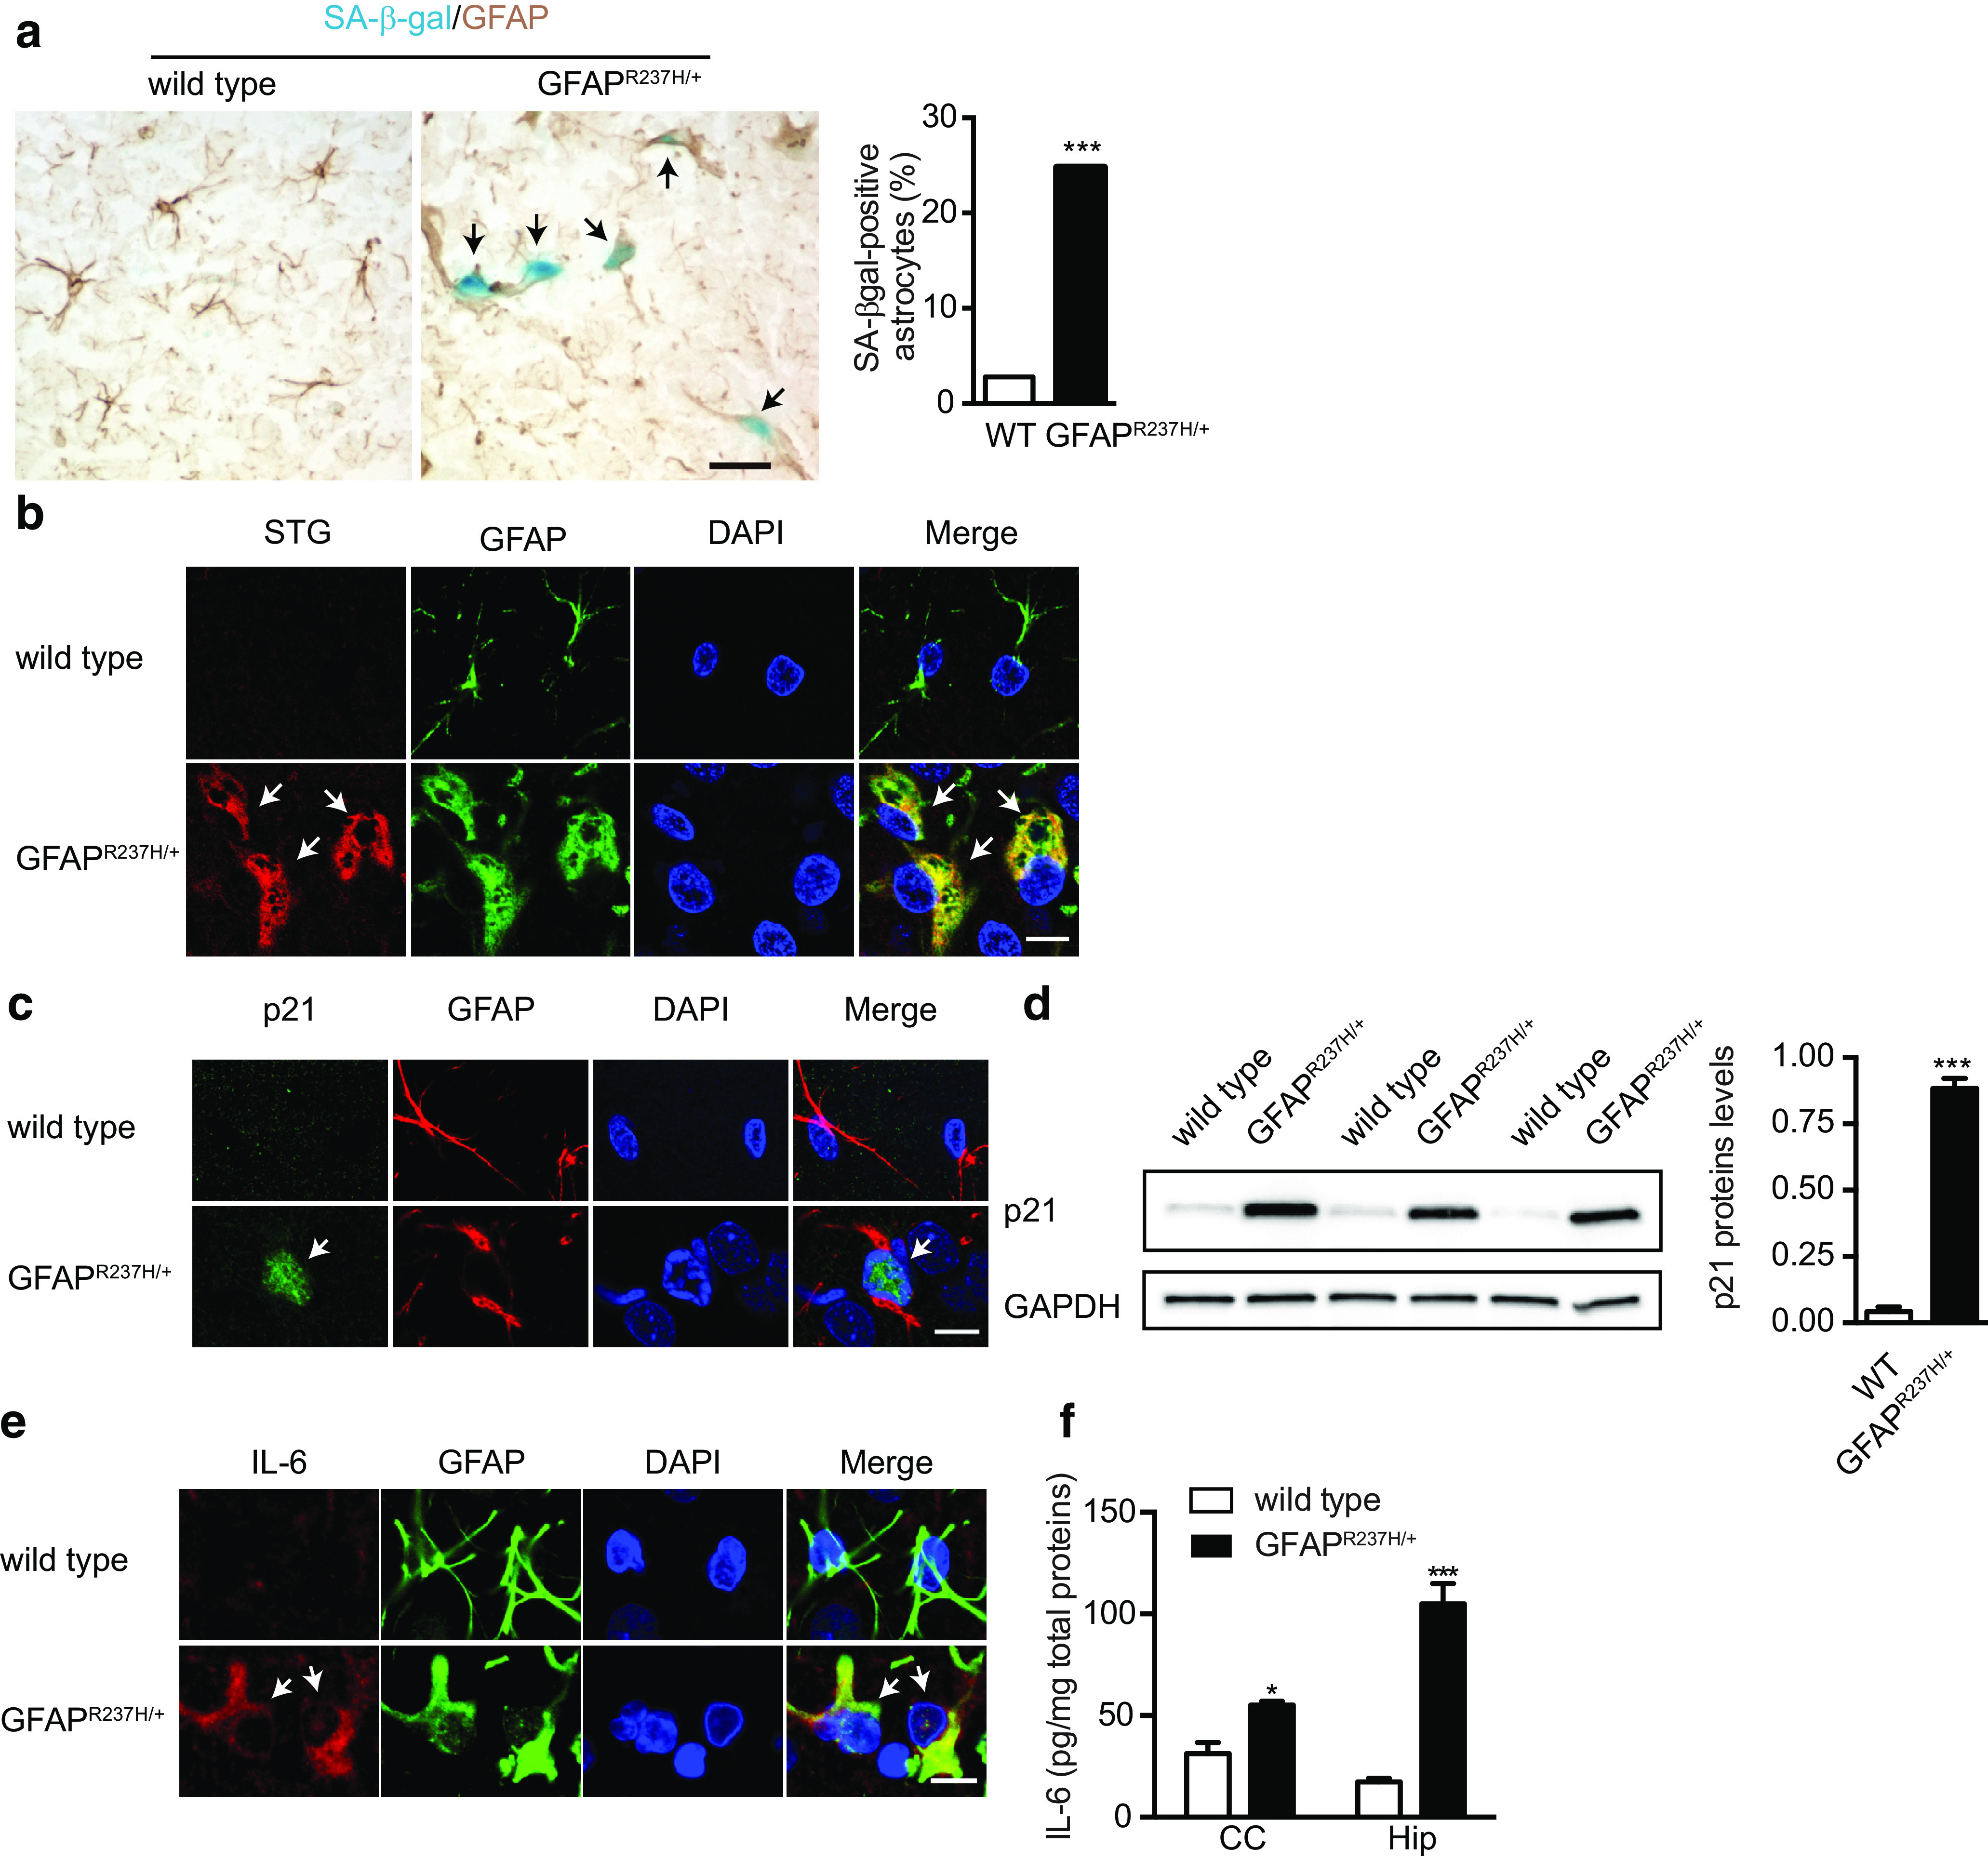
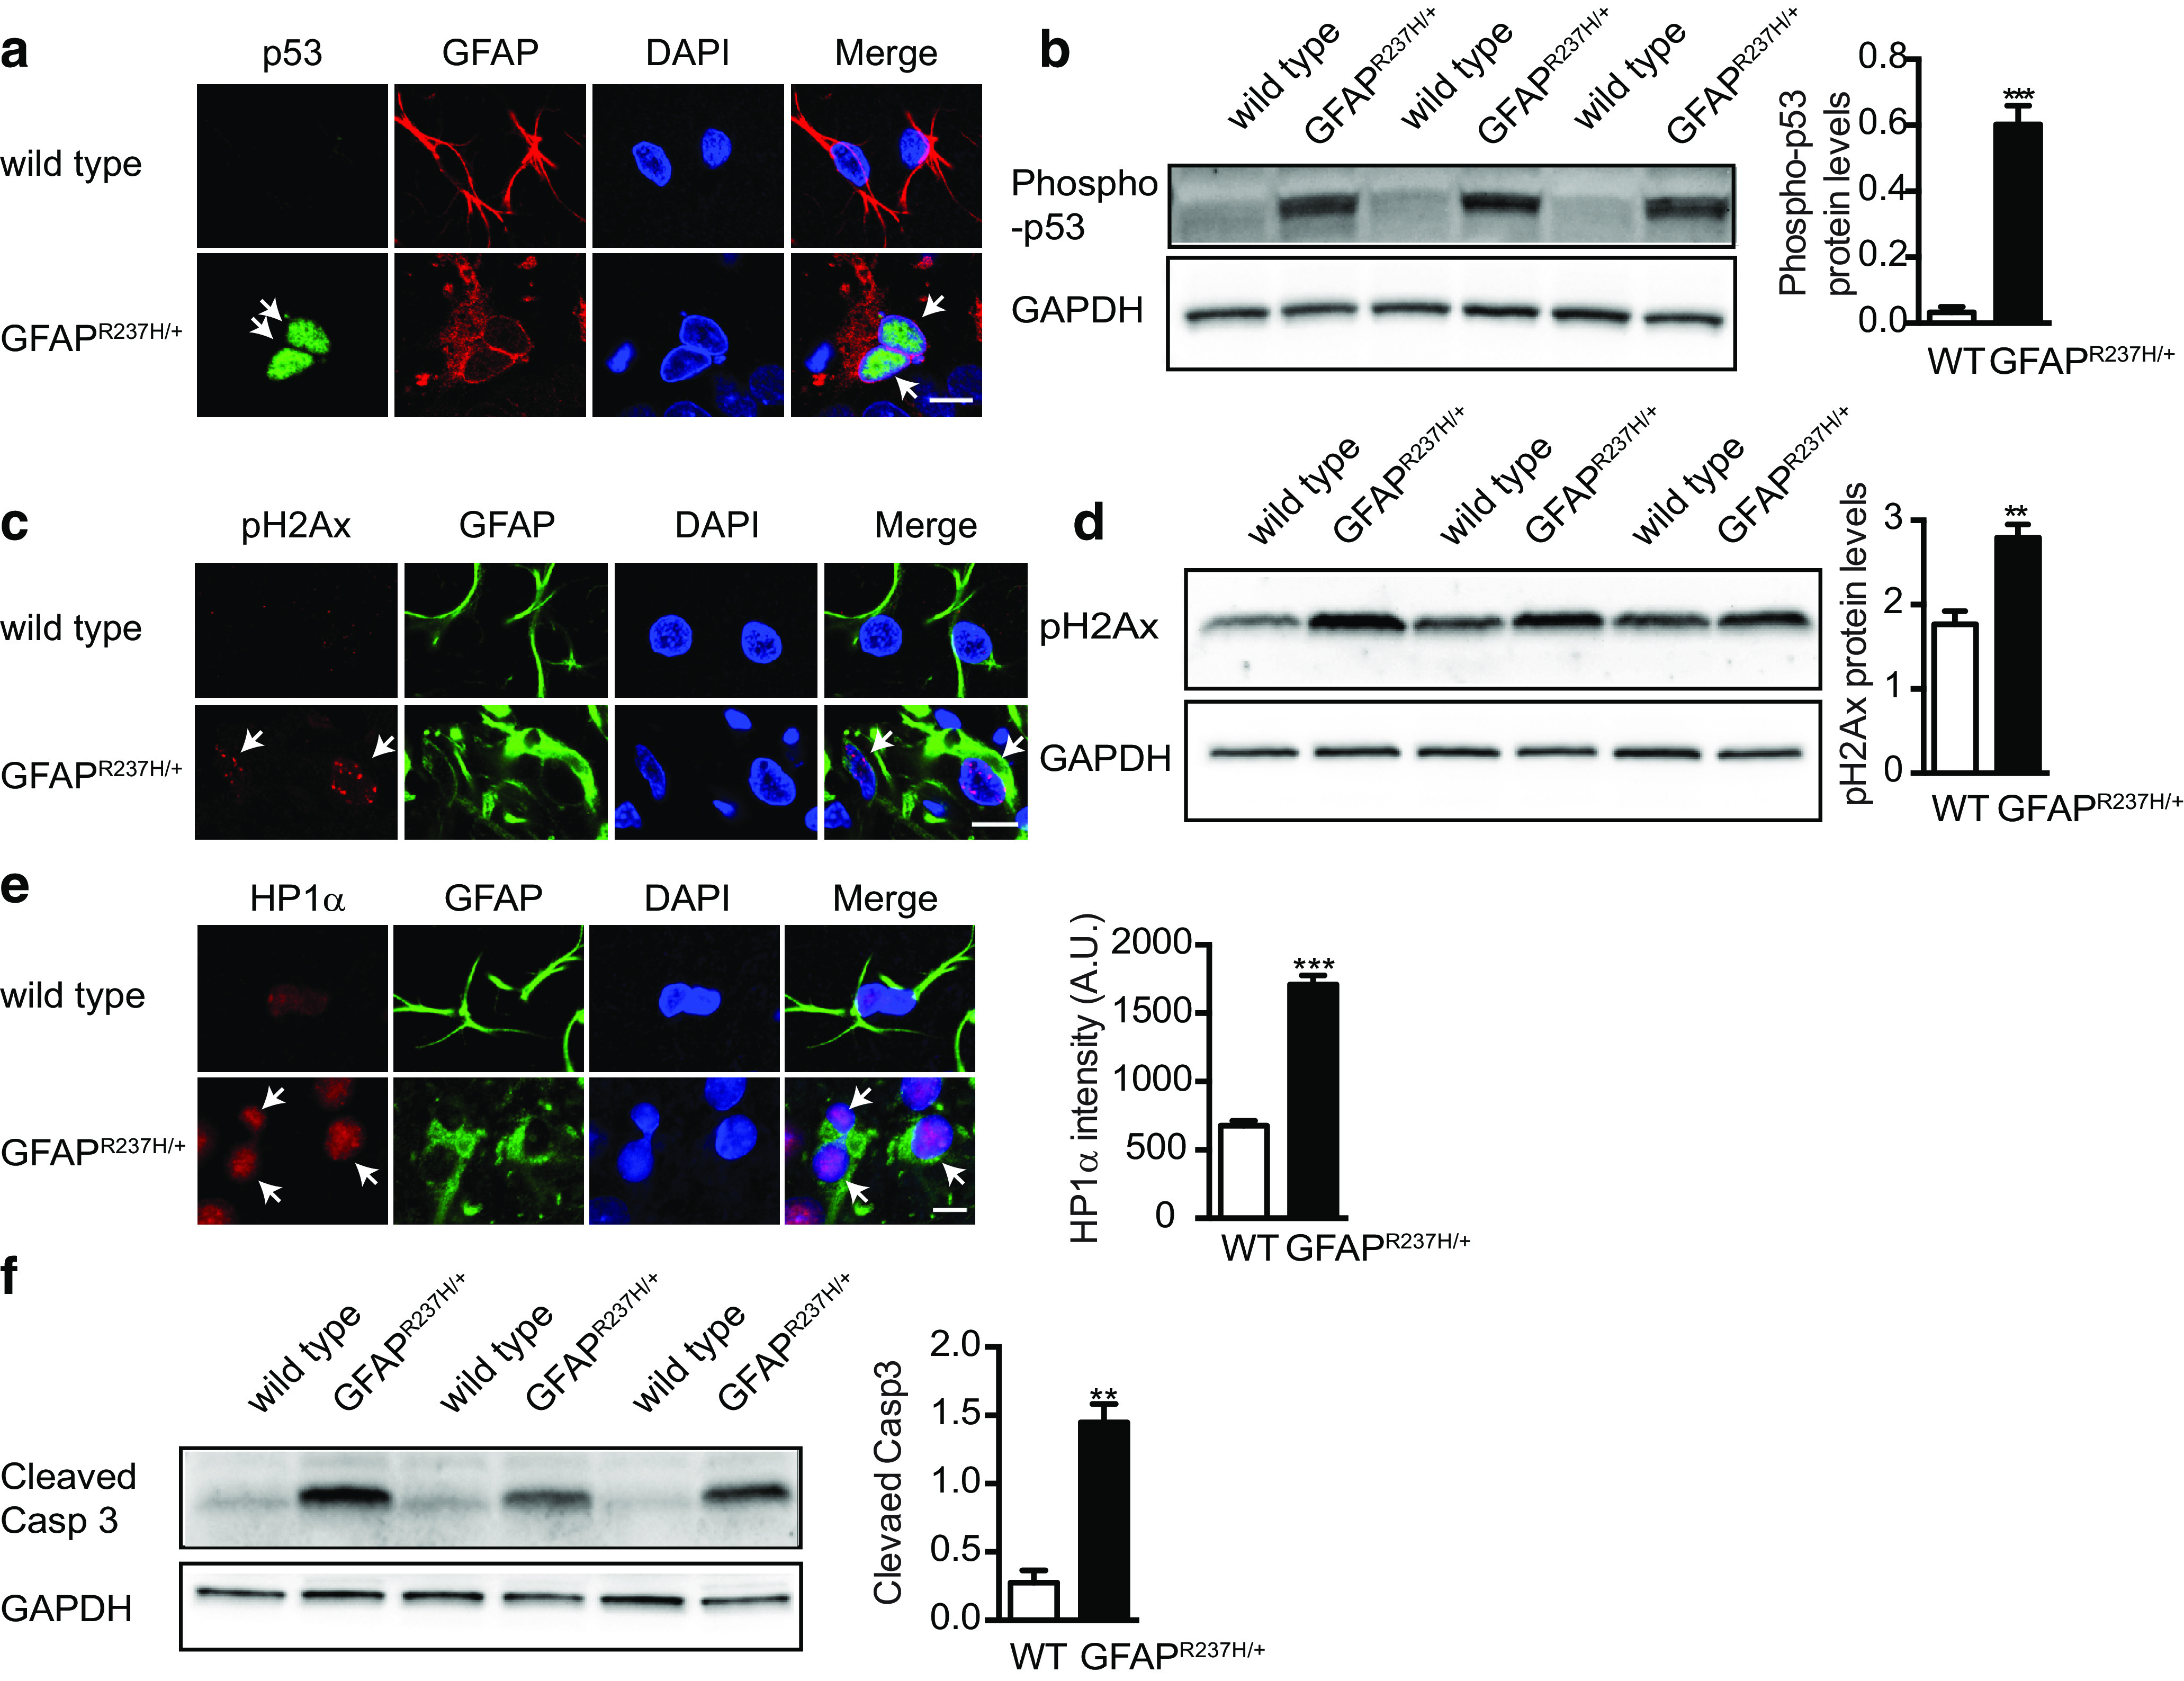
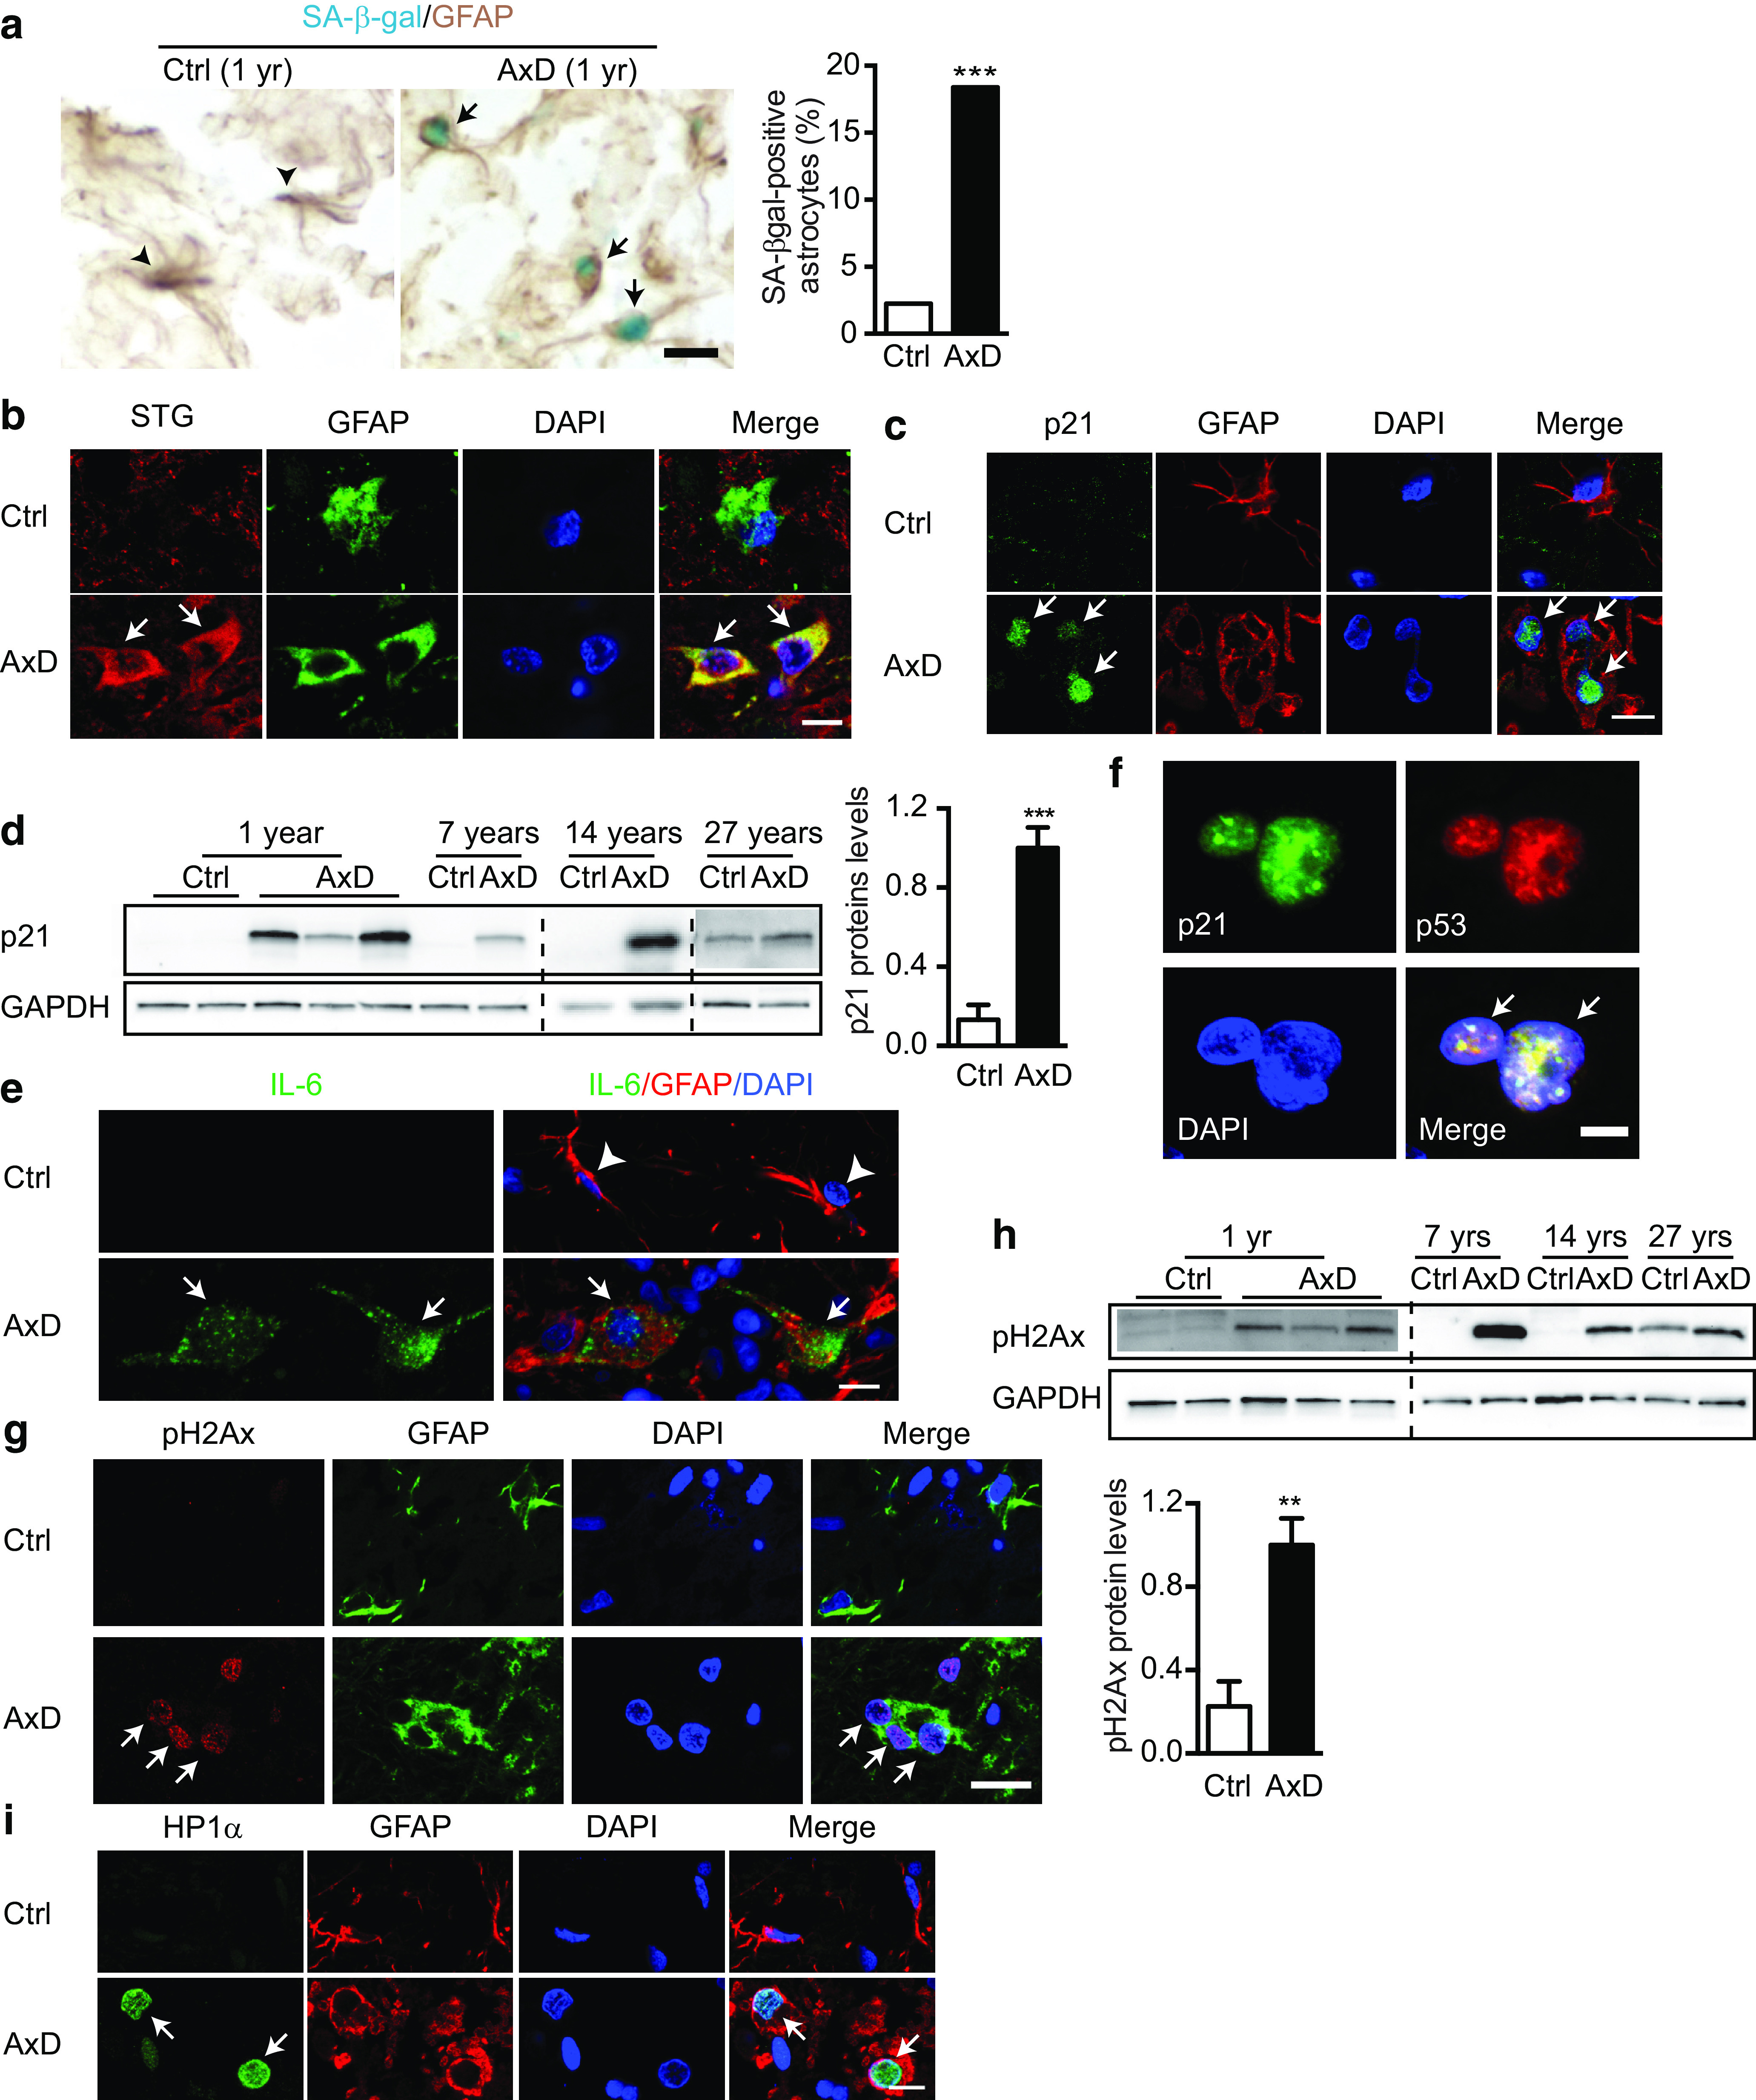
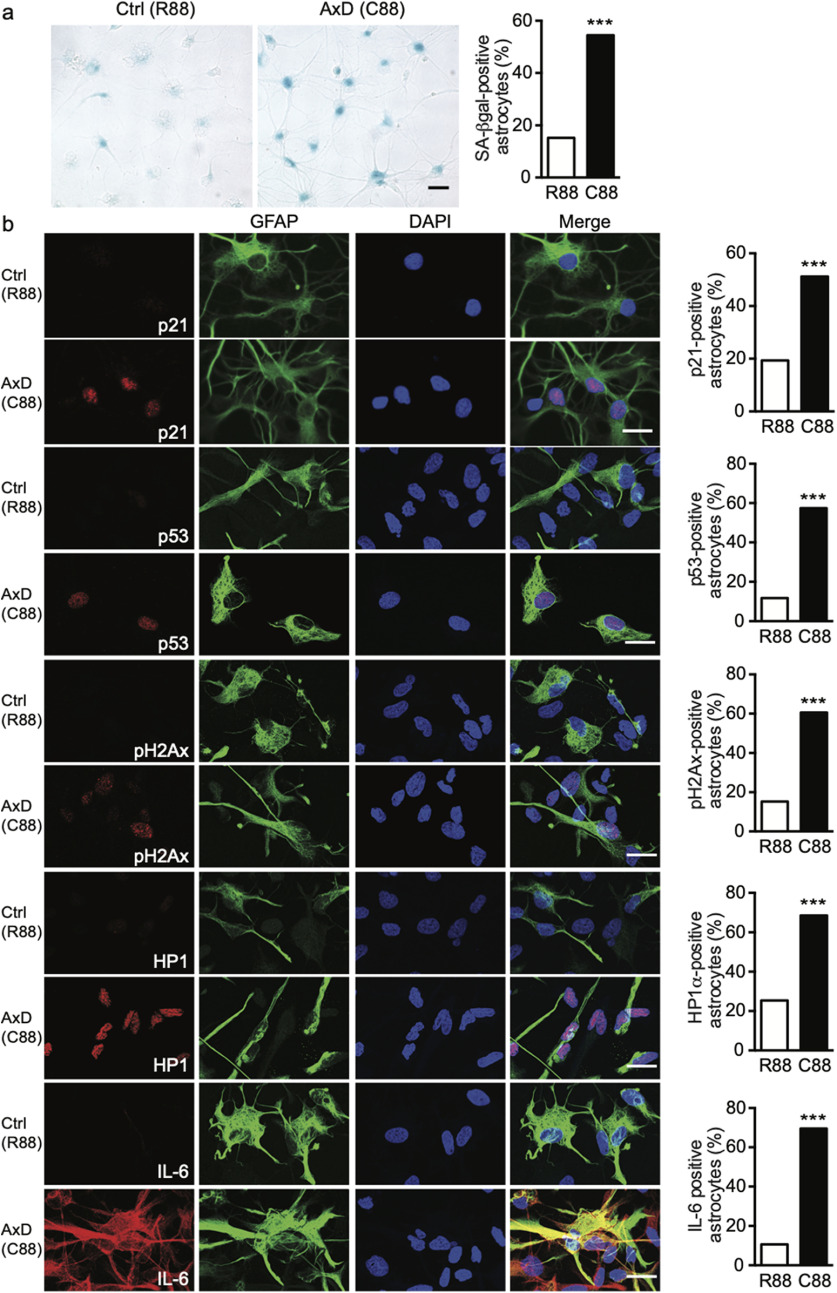
Anastasis is a recently described process in which cells recover after late-stage apoptosis activation. The functional consequences of anastasis for cells and tissues are not clearly understood. Using Drosophila, rat and human cells and tissues, including analyses of both males and females, we present evidence that glia undergoing anastasis in the primary astrogliopathy Alexander disease subsequently express hallmarks of senescence. These senescent glia promote non-cell autonomous death of neurons by secreting interleukin family cytokines. Our findings demonstrate that anastasis can be dysfunctional in neurologic disease by inducing a toxic senescent population of astroglia.SIGNIFICANCE STATEMENT Under some conditions cells otherwise destined to die can be rescued just before death in a process called anastasis, or "rising from the dead." The fate and function of cells undergoing a near death experience is not well understood. Here, we find that in models and patient cells from Alexander disease, an important brain disorder in which glial cells promote neuronal dysfunction and death, anastasis of astrocytic glia leads to secretion of toxic signaling molecules and neurodegeneration. These studies demonstrate a previously unexpected deleterious consequence of rescuing cells on the brink of death and suggest therapeutic strategies for Alexander disease and related disorders of glia.


Figures

Figure 1.
Figure 1.
Inhibition of glial caspase activity induces neuronal cell death in Alexander disease model flies. a, Genetic inhibition of caspase activity in glial cells increases the number of apoptotic cells in Alexander disease model flies. N ≥ 6 per genotype. *p < 0.01, ***p < 0.0001. b, Genetic inhibition of caspase activity in glial cells increases the number of Dcp-1 (Death caspase-1)-positive cells in Alexander disease model flies. N ≥ 6 per genotype. *p < 0.05, **p < 0.01. c, Genetic inhibition of caspase activity in glial cells reduces locomotor activity in Alexander disease model flies. N ≥ 18 per genotype. ***p < 0.0001. d, Double label immunofluorescence shows increased neuronal cell death (arrows) in Alexander disease model flies with caspase inhibition in glial cells. Arrowheads indicate non-neuronal apoptotic cells. Scale bar: 5 µm. Quantification is shown in the right panel. N ≥ 6 per genotype. ***p < 0.001. One-way ANOVA with multiple comparison analysis. Control (Ctrl): repo-GAL4/+. GFAPR79H: repo-GAL4, UAS-GFAPR79H/+. Flies are 20 d old. Extended Data Figure 1-1 is supporting this figure.
Figure 2.
Figure 2.
Glial cells in GFAP transgenic flies express markers of senescence. a, Increased upd3 transcript level in GFAP transgenic flies compared with age-matched control flies. N ≥ 6. **p < 0.01, unpaired t test. b, Double label immunofluorescence shows β-galactosidase expression of the upd3 reporter (upd3-lacZ) in glia of GFAP transgenic flies (arrow), but not in age-matched controls. Repo marks glial cells. DAPI labels nuclei. Scale bar: 5 µm. c, Western blotting demonstrates a marked increase of β-galactosidase expression (upd3-lacZ) in GFAP transgenic flies compared with age-matched controls. N = 4. **p = 0.0046, unpaired t test. d, Western blotting demonstrates a significant increase of MMP1 expression in GFAP transgenic flies compared with age-matched controls. N = 4. **p = 0.0036, unpaired t test. Blots were reprobed with an antibody to actin to illustrate equivalent protein loading. e, Double label immunofluorescence shows increased formation of senescence-associated HP1α heterochromatin foci (SAHF) in GFAP transgenic flies (arrows, bottom panel) compared with age-matched controls. Repo marks glial cells. DAPI labels nuclei. Scale bar: 5 µm. Quantification is in the right panel. N = 5 for control and 6 for GFAPR79H. p = 0.0184, unpaired t test. f, Double label immunofluorescence shows colocalization of β-galactosidase (upd3-lacZ) and p53 in GFAP transgenic flies (arrow). Scale bar: 5 µm. Genotype: repo-GAL4, UAS-GFAPR79H, upd3-lacZ/+. g, Double label immunofluorescence shows colocalization of β-galactosidase (upd3-lacZ) and pH2Av in GFAP transgenic flies (arrow). Scale bar: 5 µm. Genotype: repo-GAL4, UAS-GFAPR79H, upd3-lacZ/+. Ctrl: repo-GAL4/+. GFAPR79H: repo-GAL4, UAS-GFAPR79H/+. Flies are 20 d old.
Figure 3.
Figure 3.
Anastasis in Alexander disease model glia. a, Double label immunofluorescence shows β-galactosidase (upd3-lacZ)-positive cells (arrowhead) do not colocalize with active caspase-positive cells (CD8-PARP-Venus reporter, arrows). Scale bar: 5 µm. Genotype: repo-GAL4, UAS-GFAPR79H, upd3-lacZ/UAS-CD8-PARP-Venus. Flies are 20 d old. b, Double label immunofluorescence shows β-galactosidase (upd3-lacZ)-positive cells (arrowhead) do not colocalize with TUNEL-positive cells (arrow). Scale bar: 5 µm. Genotype: repo-GAL4, UAS-GFAPR79H, upd3-lacZ/+. Flies are 20 d old. c, Immunofluorescence staining shows β-galactosidase (upd3-lacZ)-positive cells colocalize with glial cells showing anastasis (GFP-positive cells, arrows) in GFAP transgenic flies. Arrowhead shows activation of the anastasis reporter in control flies. Scale bar: 5 µm. d, Quantification shows a marked increase of anastasis-positive glial cells in GFAP transgenic flies compared with age-matched controls. N = 6 per genotype, ***p < 0.0001, unpaired t test. Flies are 30 d old. e, Western blotting demonstrates increased anastasis marked by GFP expression in GFAP transgenic flies compared with age-matched controls. N = 4, ***p < 0.0001, unpaired t test. The blot was reprobed with an antibody to actin to illustrate equivalent protein loading. Flies carrying the anastasis reporter are heterozygous for the CasExp transgene (Ubi-CasExpress/+) and the G-trace reporter (Evans et al., 2009). Flies are 30 d old.
Figure 4.
Figure 4.
Inhibition of glial caspase activity promotes senescence in Alexander disease model flies. a, Genetic inhibition of glial caspase activity increases β-galactosidase expression (upd3-lacZ) in GFAP transgenic flies. N = 5. **p < 0.01. b, Genetic inhibition of glial caspase activity markedly increases MMP1 protein expression in GFAP transgenic flies. N = 3. **p < 0.01. c, Genetic inhibition of glial caspase activity markedly increases p53 protein expression in GFAP transgenic flies. N = 8. **p < 0.01. d, Genetic inhibition of glial caspase activity markedly increases pH2Av protein expression in GFAP transgenic flies. N = 6. *p < 0.05. e, Genetic inhibition of glial caspase activity markedly increases the percentage of glial cells with senescence-associated HP1α heterochromatin foci (SAHF) in GFAP transgenic flies. N = 6 per genotype. Blots were reprobed with an antibody to actin to illustrate equivalent protein loading. **p < 0.01. One-way ANOVA with multiple comparison was used for statistical analysis. Flies are 20 d old.
Figure 5.
Figure 5.
Genetic inhibition of dome rescues GFAP toxicity in Alexander disease model flies. a, Genetic inhibition of dome in glial cells reduces the number of TUNEL-positive cells in GFAP transgenic flies. N ≥ 6 per genotype. **p < 0.01, ***p < 0.001. b, Genetic inhibition of dome in glial cells increases the percentage of neuronal cell death. N = 6 per genotype. **p = 0.0020. c, Genetic inhibition of dome in glial cells increases locomotor activity in Alexander disease model flies. N ≥ 11 per genotype. ***p < 0.0001. d, Genetic inhibition of dome in neurons using the pan-neuronal driver elav-GAL4 reduces the number of TUNEL-positive cells in flies expressing GFAP in glia using the pan-glial driver repo-QF2. N ≥ 6 per genotype. **p < 0.01, ***p < 0.001. e, Genetic inhibition of dome in neurons reduces the percentage of neuronal cell death in flies expressing GFAP in glia. N ≥ 6 per genotype. **p = 0.0015. One-way ANOVA with multiple comparison analysis was used in a, d and unpaired t test was used in b, c, e for statistical analysis. Flies are 20 d old in a–c and 30 d old in d, e.
Figure 6.
Figure 6.
Astrocytes in the rat model of Alexander disease exhibit senescent phenotypes. a, Bright field images show SA-β-gal staining (blue) in the astrocytes (brown staining) of cortex from eight-week-old Alexander disease model rats, but not in age-matched wild-type rats. Tissue was also stained with GFAP to mark astrocytes (brown). Scale bar: 50 µm. Quantification is in the right panel. ***p < 0.0001, χ2 test. N > 350 astrocytes per genotype was used for quantification. b, Double label immunofluorescence shows senescent astrocytes labeled by SenTraGor (STG) compound in eight-week-old Alexander disease model rats (arrows, bottom panel), but not in age-matched wild-type rats. GFAP marks astrocytes. DAPI labels nuclei. Scale bar: 10 µm. c, Double label immunofluorescence shows activation of p21cip/waf1 in the astrocytes of eight-week-old Alexander disease model rats (arrow, bottom panel), but not in age-matched wild-type rats. GFAP marks astrocytes. DAPI labels nuclei. Scale bar: 10 µm. d, Western blotting demonstrates marked increase of p21cip/waf1 expression in the hippocampus of eight-week-old Alexander disease model rats compared with age-matched wild-type rats. The blot was reprobed with an antibody to GAPDH to illustrate equivalent protein loading. ***p < 0.0001. unpaired t test. e, Double label immunofluorescence shows IL-6 expression in the astrocytes of eight-week-old Alexander disease model rats (arrow, bottom panel), but not in age-matched wild-type rats. GFAP marks astrocytes. DAPI labels nuclei. Scale bar: 10 µm. f, Immunoassay demonstrates marked increases of IL-6 concentration in eight-week-old Alexander disease model rats compared with age-matched wild-type rats. N = 3 per genotype per region. CC: corpus callosum; Hip: hippocampus. *p < 0.05, ***p < 0.0001, multiple t tests.
Figure 7.
Figure 7.
DNA damage response is activated in the astrocytes Alexander disease model rats. a, Double label immunofluorescence shows activation of p53 in the astrocytes of eight-week-old Alexander disease model rats (arrows, bottom panel), but not in age-matched wild-type rats. GFAP marks astrocytes. DAPI labels nuclei. Scale bar: 10 µm. b, Western blotting demonstrates increased expression of phospho-p53 (Ser15) in the hippocampus of eight-week-old Alexander disease model rats (GFAPR237H/+) compared with age-matched wild-type rats. GAPDH was used as a loading control. N = 3 per genotype. ***p = 0.0007, unpaired t test. c, Double label immunofluorescence shows activation of DNA damage marker pH2Ax in the astrocytes of eight-week-old Alexander disease model rats (arrows, bottom panel), but not in age-matched wild-type rats. GFAP marks astrocytes. DAPI labels nuclei. Scale bar: 10 µm. d, Western blotting demonstrates increased expression of phospho-H2Ax (pH2Ax) in the hippocampus of eight-week-old Alexander disease model rats (GFAPR237H/+) compared with age-matched wild-type rats. GAPDH was used as a loading control. N = 3 per genotype. **p = 0.0098, unpaired t test. e, Double label immunofluorescence and quantification show increased expression of HP1α in the astrocytes of Alexander disease model rats than in wild-type animals. GFAP marks astrocytes. DAPI labels nuclei. Scale bar: 5 µm. HP1α intensity was quantified using ImageJ. N = 3 rats per genotype. At least 20 astrocytes were imaged and quantified from each animal. ***p < 0.0001, unpaired t test. f, Western blotting demonstrates increased expression of cleaved caspase-3 in the hippocampus of eight-week-old Alexander disease model rats (GFAPR237H/+) compared with age-matched wild-type rats. The blot was reprobed with an antibody to GAPDH to illustrate equivalent protein loading. N = 3 per genotype. **p = 0.0019, unpaired t test.
Figure 8.
Figure 8.
Astrocytes in Alexander disease patient tissue show senescent phenotypes. a, Bright field images show SA-β-gal staining (blue) in the astrocytes of a one-year-old Alexander disease patient tissue (arrows), but not in an age-matched control tissue (arrowheads). Tissue was also stained with GFAP to mark astrocytes (brown). Scale bar: 20 µm. Quantification is in the right panel. ***p < 0.0001, χ2 test. N > 500 astrocytes per genotype was used for quantification. b, Double label immunofluorescence shows senescent astrocytes labeled by SenTraGor (STG) compound in a one-year-old Alexander disease patient tissue (arrows), but not in an age-matched control tissue. GFAP marks astrocytes. DAPI labels nuclei. Scale bar: 5 µm. c, Double label immunofluorescence shows activation of p21cip/waf1 in the astrocytes of a one-year-old Alexander disease patient tissue (arrows), but not in an age-matched control. GFAP marks astrocytes. DAPI labels nuclei. Scale bar: 10 µm. d, Western blotting demonstrates a marked increase of p21cip/waf1 expression in Alexander disease patient tissue compared with age-matched controls. ***p = 0.0001, unpaired t test. e, Double label immunofluorescence shows IL-6 expression in the astrocytes of a one-year-old Alexander disease patient tissue (arrows), but not in an age-matched control. GFAP marks astrocytes. DAPI labels nuclei. Scale bar: 10 µm. f, Double label immunofluorescence shows colocalization of p21cip/waf1 and p53 (arrows) in a one-year-old Alexander disease patient. Scale bar: 10 µm. g, Double label immunofluorescence shows activation of phospho-H2Ax in the astrocytes of a one-year-old Alexander disease patient tissue (arrows) compared with age-matched control tissue. Scale bar: 10 µm. h, Western blotting demonstrates increased phospho-H2Ax expression in Alexander disease patient tissue compared with age-matched controls. **p = 0.0019, unpaired t test. Blots were reprobed with an antibody to GAPDH to illustrate equivalent protein loading. i, Double label immunofluorescence shows increased HP1α expression in the astrocytes of Alexander disease patient tissue (arrows) compared with age-matched control tissue. Scale bar: 10 µm.
Figure 9.
Figure 9.
Alexander disease astrocytes recapitulate key in vivo senescent phenotypes. a, Bright field images of Alexander disease astrocytes (C88) and corrected control cells (R88) stained with SA-β-gal staining. Quantification shows a marked increase of the percentage of SA-β-gal-positive cells in Alexander disease astrocytes (C88) compared with corrected control astrocytes(R88). Scale bar: 25 µm. SA-β-gal staining intensity was quantified using ImageJ and the threshold was set at 170 for positive cells. N = 1061 (C88) and 1300 (R88). ***p < 0.0001, χ2 test. b, Double label immunofluorescence and quantification confirm increased activation of p21cip/waf1, p53, pH2Ax, HP1α, and IL-6 in Alexander disease astrocytes (C88) compared with corrected control cells (R88). GFAP marks astrocytes. DAPI labels nuclei. Scale bar: 20 µm. N > 200 cells per genotype in each quantification. ***p < 0.0001, χ2 test.

Similar articles

Cited by

References

    1. Aram L, Yacobi-Sharon K, Arama E (2017) CDPs: caspase-dependent non-lethal cellular processes. Cell Death Differ 24:1307–1310. 10.1038/cdd.2017.111 - DOI - PMC - PubMed
    1. Baker DJ, Petersen RC (2018) Cellular senescence in brain aging and neurodegenerative diseases: evidence and perspectives. J Clin Invest 128:1208–1216. 10.1172/JCI95145 - DOI - PMC - PubMed
    1. Brenner M, Goldman JE, Quinlan RA, Messing A (2009) Alexander disease: a genetic disorder of astrocytes. In: Astrocytes in (patho)physiology of the nervous system, pp 591–648. New York: Springer.
    1. Bussian TJ, Aziz A, Meyer CF, Swenson BL, van Deursen JM, Baker DJ (2018) Clearance of senescent glial cells prevents tau-dependent pathology and cognitive decline. Nature 562:578–582. 10.1038/s41586-018-0543-y - DOI - PMC - PubMed
    1. Chen P, Nordstrom W, Gish B, Abrams JM (1996) grim, a novel cell death gene in Drosophila. Genes Dev 10:1773–1782. 10.1101/gad.10.14.1773 - DOI - PubMed

Publication types

LinkOut - more resources