. 2022 Jan 31;13(1):584.
doi: 10.1038/s41467-022-28082-5.

Duplex DNA and BLM regulate gate opening by the human TopoIIIα-RMI1-RMI2 complex

Affiliations

Duplex DNA and BLM regulate gate opening by the human TopoIIIα-RMI1-RMI2 complex

Julia A M Bakx et al. Nat Commun. .

Abstract

Topoisomerase IIIα is a type 1A topoisomerase that forms a complex with RMI1 and RMI2 called TRR in human cells. TRR plays an essential role in resolving DNA replication and recombination intermediates, often alongside the helicase BLM. While the TRR catalytic cycle is known to involve a protein-mediated single-stranded (ss)DNA gate, the detailed mechanism is not fully understood. Here, we probe the catalytic steps of TRR using optical tweezers and fluorescence microscopy. We demonstrate that TRR forms an open gate in ssDNA of 8.5 ± 3.8 nm, and directly visualize binding of a second ssDNA or double-stranded (ds)DNA molecule to the open TRR-ssDNA gate, followed by catenation in each case. Strikingly, dsDNA binding increases the gate size (by ~16%), while BLM alters the mechanical flexibility of the gate. These findings reveal an unexpected plasticity of the TRR-ssDNA gate size and suggest that TRR-mediated transfer of dsDNA may be more relevant in vivo than previously believed.


Conflict of interest statement

The combined optical tweezers and fluorescence technologies used in this article are patented and licensed to LUMICKS B.V., in which E.J.G.P. and G.J.L.W. have a financial interest. The remaining authors declare no competing interests.

Figures

Fig. 1
Fig. 1. Schematic representation of the catalytic cycle of type 1A topoisomerases.
First (top right), the enzyme (green) binds in a closed configuration to a region of ssDNA (orange). The enzyme cleaves the ssDNA backbone upon binding and forms a protein-ssDNA gate (red dot indicates the catalytic site, which forms a covalent bond with the DNA backbone). The protein subsequently undergoes a conformational rearrangement that opens the gate. This allows an adjacent strand of T-DNA (blue) to bind to the protein cavity. Finally, the enzyme-ssDNA gate closes and the ssDNA backbone is re-ligated. For two entwined DNA strands, this cycle results in (de)catenation of the two strands.
Fig. 2
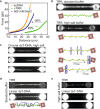
Fig. 2. Direct observation of TRR gate opening on ssDNA.
a (Top) Representative mCherry fluorescence image of TRR-ssDNA. Scale bar represents 5 µm, and applies to all snapshots. (Bottom) Representative FD-curves of bare ssDNA (orange) and TRR-ssDNA (green). The black line shows the FD-curve of ssDNA shifted to a 50% longer contour length, while the dashed grey lines highlight the shoulder in the FD-curve which signifies an additional, force-induced length increase from ~15 to 30 pN. The schematic representation depicts the length increase of ssDNA due to TRR binding and gate opening. Representative data are shown from at least 30 independent measurements. b Relative (rel.) lengthening of ssDNA as a function of mCherry fluorescence (fluores.) intensity from bound TRR, based on at least 10 independent experiments (green), together with a linear fit to the data (black line). c ‘Subtraction plot’ showing the relative lengthening for TRR-ssDNA compared to bare ssDNA as a function of force, based on the data shown in panel (a). Dashed grey lines highlight the transition (o/w) between the open (o) and the widened (w) states of the TRR-ssDNA gate. d Step-size distribution of single gate opening events (green) following TRR-induced cleavage of ssDNA, fitted to a single Gaussian function (black line, based on N = 176; average step size 8.5 ± 3.8 nm; mean ± SD). Inset: Representative length–time trace recorded for ssDNA in the presence of a low concentration (~1 nM) of TRR, measured at a constant force of 15 pN (from six independent measurements). Raw data (black) are shown, together with steps fitted using a step-fitting algorithm (green). e (Top) Representative mCherry fluorescence image (from N ≥ 10) following incubation of a tethered ssDNA substrate in TRR in Mg2+-deficient buffer. (Bottom) Representative FD-curves (from N ≥ 10) of bare ssDNA (orange), TRR-ssDNA in the absence of Mg2+ (purple), and the same TRR-ssDNA molecule after incubation in Mg2+-containing buffer (green). f (Top) Representative mCherry fluorescence image (from N ≥ 15) following incubation of a tethered ssDNA substrate in TRR in standard buffer (i.e., containing Mg2+). (Bottom) Representative FD-curves (from N ≥ 15) of bare ssDNA (orange), TRR-ssDNA in the presence of Mg2+ (green), and the same TRR-ssDNA after incubation in Mg2+-deficient buffer (purple). Source data are provided as a Source Data file.
Fig. 3
Fig. 3. Direct observation of ds/ssT-DNA binding to TRR-ssDNA.
a Representative fluorescence images (from N ≥ 10) of TRR-ssDNA (i) bound by either dsT-DNA (ii) or ssT-DNA (iii). TRR was visualized using mCherry fluorescence, while dsT- and ssT-DNA were stained with intercalator dye. Note that images i and ii correspond to the same substrate (the TRR-mCherry fluorescence image corresponding to the substrate in iii is not shown). A schematic representation of ssDNA coated with TRR and T-DNA is shown underneath (iv). Scale bar represents 5 µm, and applies to all snapshots. b Representative FD-curves (from N ≥ 10) of bare ssDNA (orange), TRR-ssDNA (green) and TRR-ssDNA bound by either dsT-DNA (dark blue) or ssT-DNA (light blue). c Change in length of TRR-ssDNA (in the force range from 5 to 15 pN) upon binding of either ssT-DNA (light blue, from N ≥ 10) or dsT-DNA (dark blue, from N ≥ 10). Error bars indicate SEM. d ‘Subtraction plots’ showing the relative (rel.) lengthening for TRR-ssDNA (green), and TRR-ssDNA bound by either ssT-DNA (light blue) or dsT-DNA (dark blue) compared to bare ssDNA. Plots were generated using the FD-curves in panel (b). Dashed grey lines highlight the transition (o/w) between the open (o) and the widened (w) states of the TRR-ssDNA gate. Source data are provided as a Source Data file.
Fig. 4
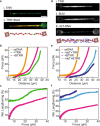
Fig. 4. Catenation of circular dsDNA around tethered ssDNA by TRR.
a Representative FD-curves (from N ≥ 20) of TRR-ssDNA before (green) and after (blue) incubation in high-salt buffer. For reference, the FD-curve of bare ssDNA is shown in orange. Arrows depict the changes in end-to-end distance: TRR binding in standard buffer results in ~49% lengthening of the ssDNA, which was reversed by ~−38% after moving the substrate into high-salt buffer due to TRR unbinding. b Representative mCherry fluorescence images (from N ≥ 20) of TRR-ssDNA before (top) and after (bottom) incubation in high-salt buffer. The scale bar represents 5 µm, and applies to all snapshots. c Representative intercalator fluorescence images (left; from N ≥ 10) and schematic representations (right) of circular dsT-DNA catenated around tethered TRR-ssDNA after incubation in high-salt buffer under different buffer flow conditions. The applied flow helps visualize the high mobility of the dsT-DNA. d Representative fluorescence images (from N = 3) of TRR-ssDNA (mCherry fluorescence, top) bound by linear dsT-DNA (intercalator staining, centre), recorded in standard buffer. A schematic representation of the interaction is also shown (bottom). e Representative fluorescence images (from N = 3) of TRR-ssDNA (mCherry fluorescence, top) bound by residual linear dsT-DNA (intercalator staining, bottom two images), recorded in high-salt buffer (same molecule as in panel (d)). The two bottom images were obtained several seconds apart and show a similar (albeit weak) fluorescence intensity pattern, suggesting that the dsT-DNA was bound to residual TRR that remained on the ssDNA. Note that when incubating in high-salt buffer, the tension was reduced to <1 pN in order promote protein unbinding. Source data are provided as a Source Data file.
Fig. 5
Fig. 5. Binding and catenation of dsT- and ssT-DNA to tethered ssDNA by EcTopoI.
a Representative FD-curves (from N ≥ 30) of bare ssDNA (orange), TRR-ssDNA (green) and EcTopoI-ssDNA (purple). Upwards and downwards arrows indicate extension and retraction curves, respectively. b ‘Subtraction plots’ showing the relative (rel.) lengthening for TRR-coated ssDNA (top, green) and EcTopoI-coated ssDNA (bottom, purple) compared to bare ssDNA. These plots were generated from the FD-curves shown in panel (a). Dashed grey lines highlight the transitions (c/o, o/w) between the closed (c), open (o) and widened (w) states of the topoisomerase-ssDNA gate. c Representative intercalator fluorescence image (from N ≥ 5) of circular dsT-DNA bound to EcTopoI-ssDNA in standard buffer. d Representative intercalator fluorescence image (from N ≥ 5) of circular dsT-DNA obtained after moving the substrate shown in panel (c) into high-salt buffer. e Representative FD-curves (from N ≥ 5) of bare ssDNA (orange), EcTopoI-ssDNA (purple) and EcTopoI-ssDNA in the presence of either ssT-DNA (light blue) or dsT-DNA (dark blue) in standard buffer. f Representative intercalator fluorescence image (from N = 4) of circular ssT-DNA bound to EcTopoI-ssDNA in standard buffer. g Representative intercalator fluorescence image (from N = 4) of circular ssT-DNA catenated around ssDNA obtained after moving the substrate shown in panel (f) into high-salt buffer. Scale bar represents 5 µm, and applies to all snapshots. Source data are provided as a Source Data file.
Fig. 6
Fig. 6. BLM alters the flexibility of the TRR-ssDNA gate.
a Representative fluorescence images (from N ≥ 10) of TRR-ssDNA (i) and BTRR-ssDNA (ii), visualized using mCherry/SNAP649 fluorescence (green/red), respectively. A schematic representation of BTRR complexes bound to ssDNA is shown underneath. The scale bar represents 5 µm, and applies to all snapshots. b Representative FD-curves (from N ≥ 10) of TRR-ssDNA (green) and BTRR-ssDNA (pink). For reference, the FD-curve of bare ssDNA is shown in orange. c ‘Subtraction plots’ showing the relative (rel.) lengthening for TRR-ssDNA (green) and BTRR-ssDNA (pink) compared to bare ssDNA. Plots were generated from the FD-curves shown in panel (b). d Representative fluorescence images (from N ≥ 5) of BTRR-ssDNA bound by dsT-DNA. TRR and BLM were visualized using mCherry (i) and SNAP649 (ii) fluorescence, while dsT-DNA was stained with intercalator dye (iii). A schematic representation is shown below. e Representative FD-curves (from N ≥ 5) of BTRR-ssDNA in the absence (pink) and presence (light blue) of dsT-DNA. For reference, the FD-curves of bare ssDNA (orange) and TRR-ssDNA bound by dsT-DNA (dark blue) are also shown. f ‘Subtraction plots’ showing the relative lengthening for dsT-coated TRR-ssDNA (dark blue), BTRR-ssDNA (pink) and dsT-coated BTRR-ssDNA (light blue) compared to bare ssDNA. Plots were generated from the data shown in panel (e). Source data are provided as a Source Data file.
Fig. 7
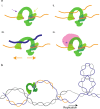
Fig. 7. Schematic representation of TRR-ssDNA gate plasticity and its potential relevance in vivo.
a Effects of co-factors on TRR-ssDNA gate mechanics. i Upon binding to ssDNA (orange), TRR (green) pivots to create an open gate in the TRR-ssDNA complex. The purple line and arrow highlight the location of a primary hinge in the enzyme that facilitates gate opening. An additional potential hinge is indicated by the yellow line and arrow. ii Binding of ssT-DNA (second orange strand) to the open TRR-ssDNA gate does not influence the gate size. iii Binding of dsT-DNA (blue) to the open TRR-ssDNA gate induces an increase of the gate size by at least ~16%. iv Proposed interaction of BLM (pink) with TRR in the BTRR complex. BLM is hypothesized to alter the overall flexibility of the gate by making contact near the primary hinge (purple line and arrow) of the topoisomerase. b Schematic representation of potential in vivo activity of TRR on pre-catenanes behind the replication fork (arrow indicates the direction of replication). TRR (green) may bind to ssDNA on the lagging strand template (blue), between Okasaki fragments (orange), and mediate transfer of the leading strand dsDNA (grey).

Similar articles

Cited by

References

    1. Bizard AH, Hickson ID. The many lives of type IA topoisomerases. J. Biol. Chem. 2020;295:7138–7153. - PMC - PubMed
    1. Brochu J, Breton ÉV, Drolet M. Supercoiling, R-loops, replication and the functions of bacterial type 1A topoisomerases. Genes. 2020;11:249. - PMC - PubMed
    1. Champoux JJ. DNA Topoisomerases: structure, function, and mechanism. Annu. Rev. Biochem. 2001;70:369–413. - PubMed
    1. Li Z, Mondragón A, Hiasa H, Marians KJ, DiGate RJ. Identification of a unique domain essential for Escherichia coli DNA topoisomerase III-catalysed decatenation of replication intermediates. Mol. Microbiol. 2000;35:888–895. - PubMed
    1. Mondragón A, DiGate R. The structure of Escherichia coli DNA topoisomerase III. Structure. 1999;7:1373–1383. - PubMed

Publication types

LinkOut - more resources