. 2022 Apr 4;220(4):iyac004.
doi: 10.1093/genetics/iyac004.

Linkage disequilibrium between rare mutations

Affiliations

Linkage disequilibrium between rare mutations

Benjamin H Good. Genetics. .

Abstract

The statistical associations between mutations, collectively known as linkage disequilibrium, encode important information about the evolutionary forces acting within a population. Yet in contrast to single-site analogues like the site frequency spectrum, our theoretical understanding of linkage disequilibrium remains limited. In particular, little is currently known about how mutations with different ages and fitness costs contribute to expected patterns of linkage disequilibrium, even in simple settings where recombination and genetic drift are the major evolutionary forces. Here, I introduce a forward-time framework for predicting linkage disequilibrium between pairs of neutral and deleterious mutations as a function of their present-day frequencies. I show that the dynamics of linkage disequilibrium become much simpler in the limit that mutations are rare, where they admit a simple heuristic picture based on the trajectories of the underlying lineages. I use this approach to derive analytical expressions for a family of frequency-weighted linkage disequilibrium statistics as a function of the recombination rate, the frequency scale, and the additive and epistatic fitness costs of the mutations. I find that the frequency scale can have a dramatic impact on the shapes of the resulting linkage disequilibrium curves, reflecting the broad range of time scales over which these correlations arise. I also show that the differences between neutral and deleterious linkage disequilibrium are not purely driven by differences in their mutation frequencies and can instead display qualitative features that are reminiscent of epistasis. I conclude by discussing the implications of these results for recent linkage disequilibrium measurements in bacteria. This forward-time approach may provide a useful framework for predicting linkage disequilibrium across a range of evolutionary scenarios.

Keywords: epistasis; genetic drift; linkage disequilibrium; purifying selection; recombination.


Figures

Fig. 1.
Fig. 1.
Schematic illustration of mutation trajectories that contribute to the SFS. Left: Mutations arise at different times and drift to their present-day frequencies (shaded region). Dark and light blue lines show examples of present-day mutations with upward and downward trajectories, respectively. In both cases, deleterious mutations are prevented from growing much larger than the drift barrier, fsel1/Ns (gray dashed line). Right: The SFS is the sum of the probabilities of all mutation trajectories with a present-day frequency f. Each mutation can be characterized by its age T and historical trajectory f(t), with f(T)f. When the frequency spectrum is dominated by upward trajectories, the effects of negative selection are similar to imposing a present-day frequency threshold f0 (black dashed line).
Fig. 2.
Fig. 2.
Schematic of different lineage dynamics that contribute to LD. a) Separate mutations: A and B mutations arise on independent wildtype backgrounds and are both still segregating at the time of observation (blue region). b) Recent nested mutations: a double mutant (AB) is produced by a single-mutant background (A) in the recent past, and both haplotypes are still segregating at the time of observation. c) Older nested mutations: a double mutant is produced by a larger single-mutant lineage in the distant past, but drifts back down to lower frequencies by the time of observation. d) Recombination produces double-mutant lineages from single-mutant lineages, and vice versa.
Fig. 3.
Fig. 3.
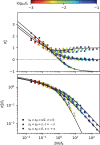
Frequency-resolved LD between deleterious mutations as a function of the scaled fitness cost of the double mutant. Top: the signed LD moment, σd1(f0), in Equation (7) is depicted for pairs of nonrecombining loci with additive (ϵ = 0), antagonistic (ϵ<0), and synergistic (ϵ>0) epistasis, which were chosen to have the same total cost for the double mutant (sAB=s). Symbols denote the results of forward-time simulations (Appendix A) across a range of parameters with s>10/N, and each symbol is colored by the corresponding value of f0. The solid lines shows the theoretical prediction from Equation (C8). Bottom: an analogous figure for the squared LD moment, σd2(f0), where solid lines show the theoretical predictions from Equation (C9). The “data collapse” in both panels indicates that frequency-weighted LD is primarily determined by the compound parameters Nsf0 and Nϵf0. Weak scaled fitness costs (Nsf01) lead to an excess of coupling linkage (σd1>0), which qualitatively resembles the effects of antagonistic epistasis (ϵ<0).
Fig. 4.
Fig. 4.
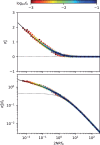
Frequency-resolved LD between neutral mutations as a function of the scaled recombination rate. An analogous version of Fig. 3, showing the first (top) and second (bottom) LD moments in Equation (7) for pairs of neutral mutations with a range of recombination rates, R>2/N. As above, symbols denote the results of forward time simulations, and solid lines denote the theoretical predictions from Equations (D21) (top) and (D22) (bottom). Dashed lines show the classical predictions for the f0 limit (Ohta and Kimura 1971). The “data collapse” in both panels indicates that frequency-weighted LD is primarily determined by compound parameter NRf0. Low scaled recombination rates (NRf01) lead to an excess of coupling linkage (σd1>0), which qualitatively resembles the effects of antagonistic epistasis (ϵ<0).
Fig. 5.
Fig. 5.
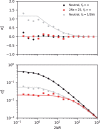
LD contains residual signatures of purifying selection after controlling for mutation frequencies. The top and bottom panels compare the first (top) and second (bottom) LD moments for a pair of neutral (black) and strongly deleterious mutations (red) across a range of recombination rates. Symbols denote the results of forward-time simulations, and the solid lines denote the theoretical predictions from Equation (2) (black) and Equation (66) (red). The gray symbols show frequency-weighted neutral mutations with the same present-day frequency spectrum as the deleterious mutations (f0=1/2Ns=0.04). For small recombination rates, the neutral control group displays an excess of coupling linkage (σd1>0) driven by ancient nested mutations, which are suppressed in the deleterious case.
Fig. 6.
Fig. 6.
Higher-order fluctuations reveal the transition to QLE. Left panel: an analogous version of the neutral collapse plot in Fig. 4 for the higher-order LD moment σd4(f0). Symbols denote the results of forward time simulations for a range of recombination rates, which are colored by the corresponding value of f0. The solid black line shows the prediction from the perturbation expansion in Equations (D22) and (D23), and the dashed lines indicate the position, NRf01/f0, where the perturbation expansion is predicted to break down. The solid colored lines show the asymptotically matched predictions from Equation (F5), which capture the transition to the quasi-linkage equilibrium regime. Right panel: the conditional distribution of the double-mutant frequency for fixed values of the marginal mutation frequencies, fAfBf0. Colored lines show forward-time simulations for pairs of neutral mutations, in which the marginal frequencies of both mutations were observed in the range 0.13fA,fB0.17; the double-mutant frequency was further downsampled to n = 200 individuals to enhance visualization. The dashed lines indicate the approximate positions of linkage equilibrium (fABf02; left) and perfect linkage (fABf0; right). Conditional distributions are shown for three different recombination rates, whose characteristic shapes illustrate the transition between the mutation-dominated (NRf01; orange), clonal recombinant (1NRf01/f0; green) and QLE (NRf01/f0; blue) regimes.
Fig. 7.
Fig. 7.
Frequency-resolved LD in the commensal human gut bacterium Eubacterium rectale. SNVs were obtained for a sample of n = 109 unrelated strains reconstructed from different human hosts (Garud et al. 2019) (Appendix H). a) Frequency-weighted LD (σd2(f0)) as a function of coordinate distance () between 4-fold degenerate synonymous SNVs in core genes. Solid lines were obtained by applying the unbiased estimator in Appendix G to all pairs of SNVs within 0.2 log units of , while the points depict genome-wide averages calculated from randomly sampled pairs of SNVs from widely separated genes. The two estimates are connected by a dashed line for visualization. b) Analogous σd2(f0) curves as a function of the frequency scale f0. c) The single SFS, estimated from the fraction of SNV pairs in which the first mutation is observed with a given minor allele count, nA. d) The conditional distribution of the double-mutant frequency for fixed values of the marginal mutation frequencies, fAfBf0. Colored lines show the observed distributions for pairs of SNVs with marginal mutation frequencies in the range 0.13fA,fB0.17; dashed lines indicate approximate positions of linkage equilibrium (fABf02; left) and perfect linkage (fABf0; right). The shapes of the three distributions are qualitatively similar to the mutation-dominated (NRf01; orange), clonal recombinant (1NRf01/f0; green) and quasi-linkage equilibrium (NRf01/f0; blue) regimes predicted in Fig. 6.

Similar articles

Cited by

References

    1. Allix-Béguec C, Arandjelovic I, Bi L, Clifton D, Crook D, Fowler P, Gibertoni Cruz A, Hoosdally S, Hunt M, et al.Prediction of susceptibility to first-line tuberculosis drugs by DNA sequencing. N Engl J Med. 2018;379:1403–1415. - PMC - PubMed
    1. Ansari MA, Didelot X.. Inference of the properties of the recombination process from whole bacterial genomes. Genetics. 2014;196(1):253–265. - PMC - PubMed
    1. Arnold B, Sohail M, Wadsworth C, Corander J, Hanage WP, Sunyaev S, Grad YH.. Fine-scale haplotype structure reveals strong signatures of positive selection in a recombining bacterial pathogen. Mol Biol Evol. 2020;37(2):417–428. - PMC - PubMed
    1. Chakravarti A, Buetow KH, Antonarakis S, Waber P, Boehm C, Kazazian H.. Nonuniform recombination within the human beta-globin gene cluster. Am J Hum Genet. 1984;36(6):1239–1258. - PMC - PubMed
    1. Coop G, Ralph P.. Patterns of neutral diversity under general models of selective sweeps. Genetics. 2012;192(1):205–224. - PMC - PubMed

Publication types