Spatial patterns of West Nile virus distribution in the Volgograd region of Russia, a territory with long-existing foci
- PMID: 35100289
- PMCID: PMC8803152
- DOI: 10.1371/journal.pntd.0010145
Spatial patterns of West Nile virus distribution in the Volgograd region of Russia, a territory with long-existing foci
Abstract
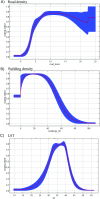
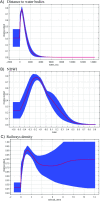
Southern Russia remains affected by West Nile virus (WNV). In the current study, we identified the spatial determinants of WNV distribution in an area with endemic virus transmission, with special reference to the urban settings, by mapping probable points of human infection acquisition and points of virus detection in mosquitoes, ticks, birds, and mammals during 1999-2016. The suitability of thermal conditions for extrinsic virus replication was assessed based on the approach of degree-day summation and their changes were estimated by linear trend analysis. A generalized linear model was used to analyze the year-to-year variation of human cases versus thermal conditions. Environmental suitability was determined by ecological niche modelling using MaxEnt software. Human population density was used as an offset to correct for possible bias. Spatial analysis of virus detection in the environment showed significant contributions from surface temperature, altitude, and distance from water bodies. When indicators of location and mobility of the human population were included, the relative impact of factors changed, with roads becoming most important. When the points of probable human case infection were added, the percentage of leading factors changed only slightly. The urban environment significantly increased the epidemic potential of the territory and created quite favorable conditions for virus circulation. The private building sector with low-storey houses and garden plots located in the suburbs provided a connection between urban and rural transmission cycles.
Conflict of interest statement
The authors have declared that no competing interests exist.
Figures


Similar articles
-
Epidemiology of West Nile virus in Connecticut: a five-year analysis of mosquito data 1999-2003.Vector Borne Zoonotic Dis. 2004 Winter;4(4):360-78. doi: 10.1089/vbz.2004.4.360. Vector Borne Zoonotic Dis. 2004. PMID: 15682518
-
Evaluation of potential West Nile virus vectors in Volgograd region, Russia, 2003 (Diptera: Culicidae): species composition, bloodmeal host utilization, and virus infection rates of mosquitoes.J Med Entomol. 2006 May;43(3):552-63. doi: 10.1603/0022-2585(2006)43[552:eopwnv]2.0.co;2. J Med Entomol. 2006. PMID: 16739415
-
West Nile virus and other zoonotic viruses in Russia: examples of emerging-reemerging situations.Arch Virol Suppl. 2004;(18):85-96. doi: 10.1007/978-3-7091-0572-6_7. Arch Virol Suppl. 2004. PMID: 15119764
-
[West Nile virus transmission risk in the Czech Republic].Epidemiol Mikrobiol Imunol. 2015 Jun;64(2):80-6. Epidemiol Mikrobiol Imunol. 2015. PMID: 26099611 Review. Czech.
-
West Nile virus and its vectors.Curr Opin Insect Sci. 2017 Aug;22:28-36. doi: 10.1016/j.cois.2017.05.002. Epub 2017 May 9. Curr Opin Insect Sci. 2017. PMID: 28805636 Review.
Cited by
-
Genomic epidemiology of West Nile virus in Europe.One Health. 2023 Dec 16;18:100664. doi: 10.1016/j.onehlt.2023.100664. eCollection 2024 Jun. One Health. 2023. PMID: 38193029 Free PMC article. Review.
-
Indication of West Nile Virus (WNV) Lineage 2 Overwintering among Wild Birds in the Regions of Peloponnese and Western Greece.Vet Sci. 2023 Nov 18;10(11):661. doi: 10.3390/vetsci10110661. Vet Sci. 2023. PMID: 37999484 Free PMC article.
-
Assessing the risk of West Nile Virus seasonal outbreaks and its vector control in an urbanizing bird community: An integrative R0-modelling study in the city of Merida, Mexico.PLoS Negl Trop Dis. 2023 May 30;17(5):e0011340. doi: 10.1371/journal.pntd.0011340. eCollection 2023 May. PLoS Negl Trop Dis. 2023. PMID: 37253060 Free PMC article.
-
West Nile Virus diffusion in temperate regions and climate change. A systematic review.Infez Med. 2023 Mar 1;31(1):20-30. doi: 10.53854/liim-3101-4. eCollection 2022. Infez Med. 2023. PMID: 36908379 Free PMC article. Review.
-
Predicting Plasmodium knowlesi transmission risk across Peninsular Malaysia using machine learning-based ecological niche modeling approaches.Front Microbiol. 2023 Feb 16;14:1126418. doi: 10.3389/fmicb.2023.1126418. eCollection 2023. Front Microbiol. 2023. PMID: 36876062 Free PMC article.
References
MeSH terms
Grants and funding
LinkOut - more resources
Full Text Sources
Medical

