. 2022 Jan 12:12:809896.
doi: 10.3389/fimmu.2021.809896. eCollection 2021.

Cytohesin-2/ARNO: A Novel Bridge Between Cell Migration and Immunoregulation in Synovial Fibroblasts

Affiliations

Cytohesin-2/ARNO: A Novel Bridge Between Cell Migration and Immunoregulation in Synovial Fibroblasts

Yilin Wang et al. Front Immunol. .

Abstract

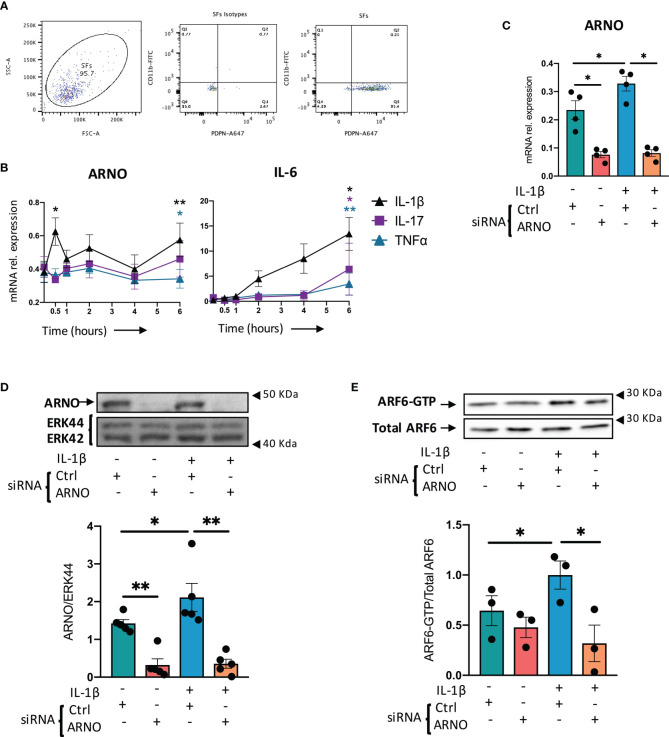
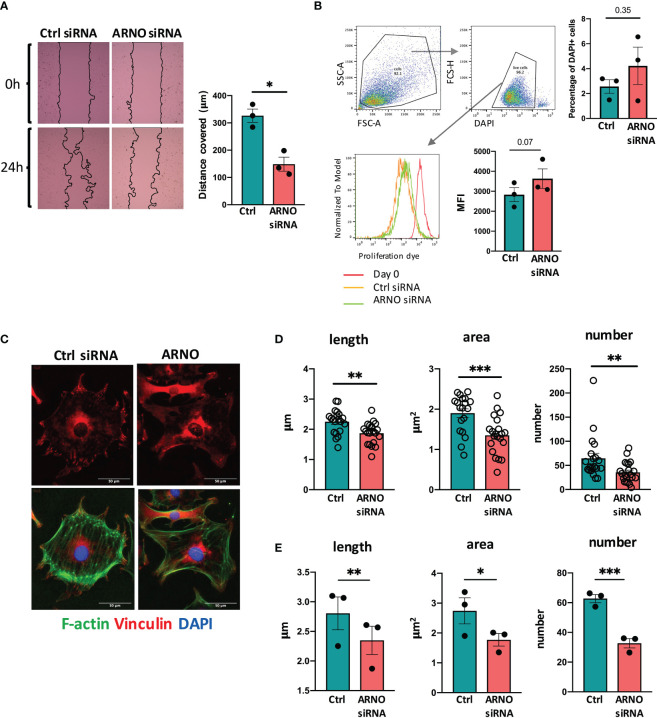
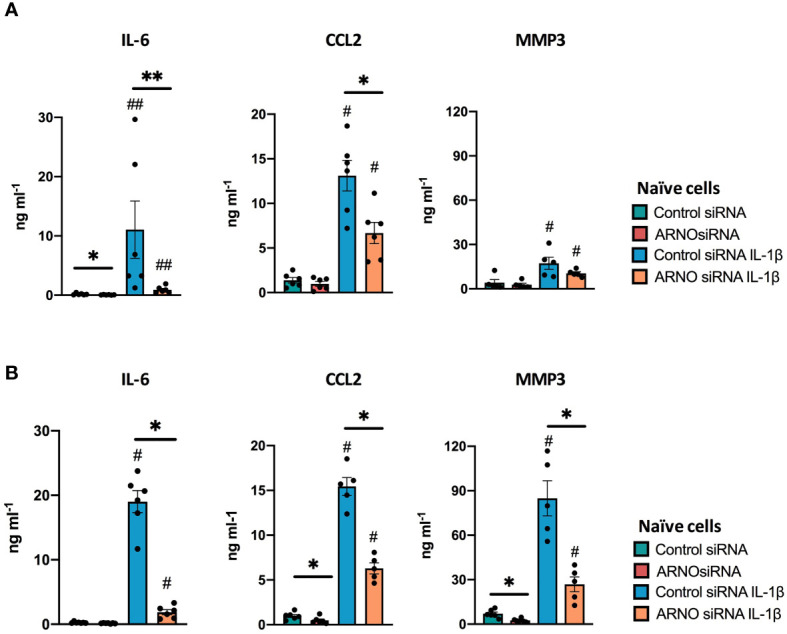
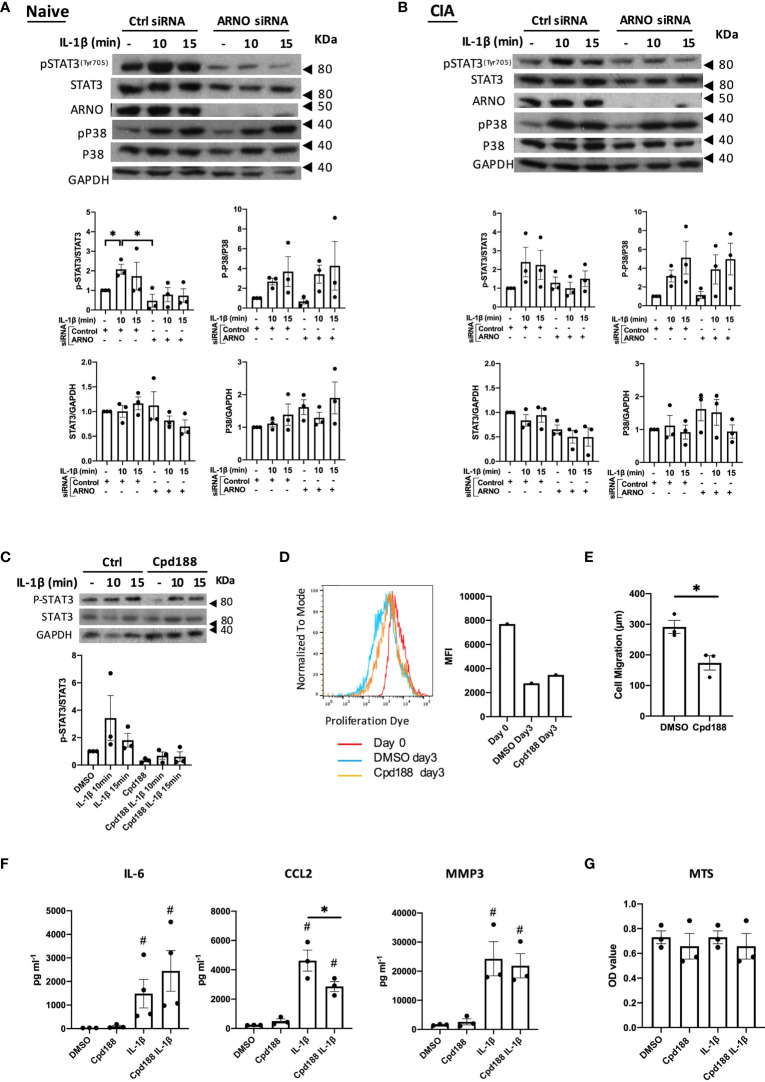
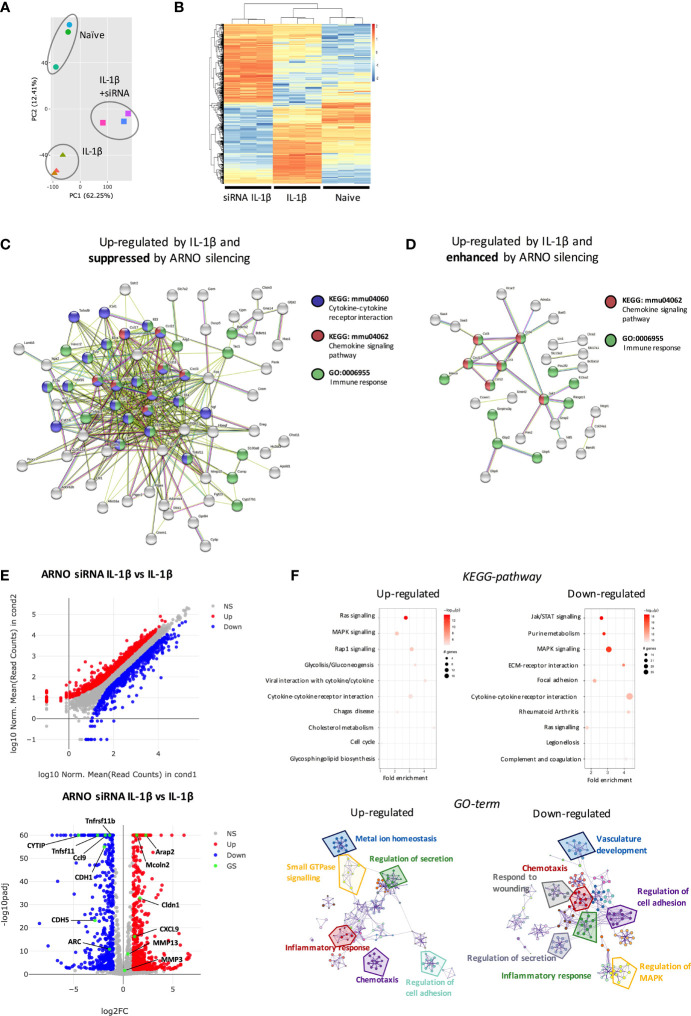
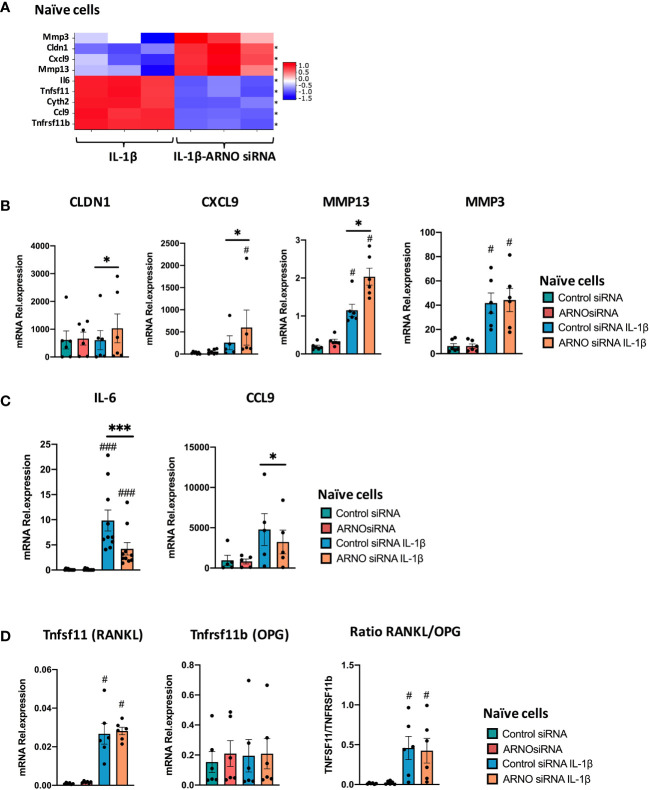
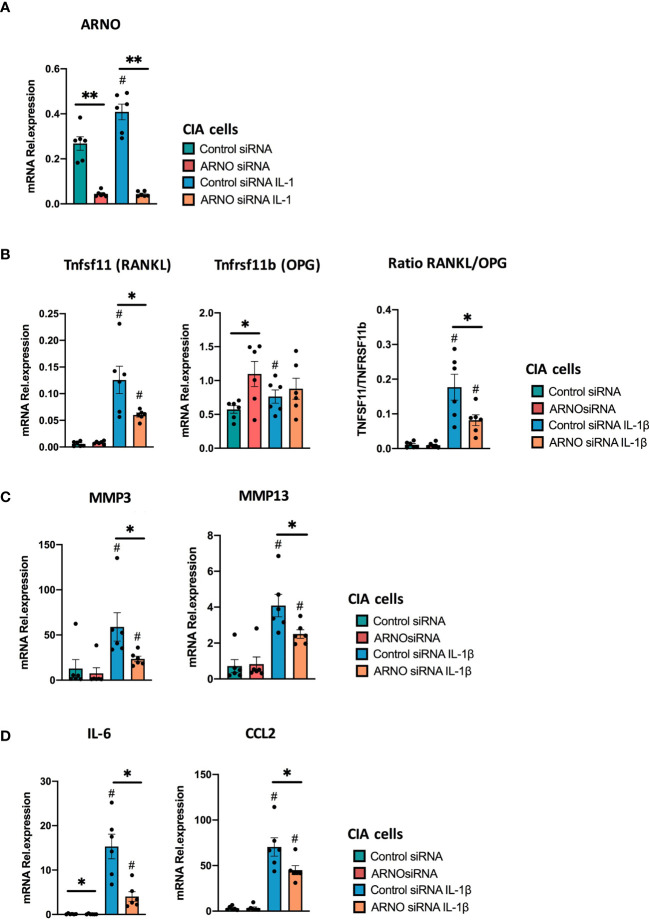
The guanine nucleotide exchange factor cytohesin-2 (ARNO) is a major activator of the small GTPase ARF6 that has been shown to play an important role(s) in cell adhesion, migration and cytoskeleton reorganization in various cell types and models of disease. Interestingly, dysregulated cell migration, in tandem with hyper-inflammatory responses, is one of the hallmarks associated with activated synovial fibroblasts (SFs) during chronic inflammatory joint diseases, like rheumatoid arthritis. The role of ARNO in this process has previously been unexplored but we hypothesized that the pro-inflammatory milieu of inflamed joints locally induces activation of ARNO-mediated pathways in SFs, promoting an invasive cell phenotype that ultimately leads to bone and cartilage damage. Thus, we used small interference RNA to investigate the impact of ARNO on the pathological migration and inflammatory responses of murine SFs, revealing a fully functional ARNO-ARF6 pathway which can be rapidly activated by IL-1β. Such signalling promotes cell migration and formation of focal adhesions. Unexpectedly, ARNO was also shown to modulate SF-inflammatory responses, dictating their precise cytokine and chemokine expression profile. Our results uncover a novel role for ARNO in SF-dependent inflammation, that potentially links pathogenic migration with initiation of local joint inflammation, offering new approaches for targeting the fibroblast compartment in chronic arthritis and joint disease.

Keywords: ARNO; arthritis (including rheumatoid arthritis); cytohesin 2; inflammation; synovial fibroblast (FLS).


Conflict of interest statement

The authors declare that the research was conducted in the absence of any commercial or financial relationships that could be construed as a potential conflict of interest.

Figures

Figure 1
Figure 1
IL-1β upregulates ARNO in SFs. (A) SFs were isolated from mouse synovium and expanded ex vivo. Cells were trypsinased and expression of podoplanin (PDPN) and CD11b was evaluated by flow cytometry. (B) SFs were stimulated with IL-1β, IL-17 and TNFα (10 ng/ml) for 30 minutes and 1, 2, 4 and 6 hours, when RNA was extracted. Expression of ARNO and IL-6 mRNA was then quantified by RT-qPCR. Data show the mean of at least three independent experiments (analysed in technical triplicates) ± SEM. (C) Naïve SFs were transfected with either ARNO or control Allstars siRNA, followed by stimulation with recombinant IL-1β (10 ng/ml) when indicated. RNA was extracted after 6 hours and ARNO mRNA expression was evaluated by RT-qPCR. Each dot represents an independent experiment (analysed in technical triplicate), and error bars represent SEM. (D) SFs were transfected and stimulated as in (C), and proteins were extracted 24h after stimulation. ARNO protein was detected by specific monoclonal antibodies by Western bloting and total Erk was used as loading control. Image shows one representative experiment. Column graph shows quantification of band intensity for ARNO normalised to Erk44. (E) SFs treated with Allstars or ARNO siRNA followed by IL-1β stimulation (5 minutes) were assayed by ARF6-GTP pull down assay and subsequently immunoblotted with anti-ARF6 antibody. Relative activation of ARF6 was normalised to unstimulated control siRNA-treated samples. For (D, E), each dot represents an independent experiment and error bars represent SEM. *p < 0.05, **p < 0.01 by Wilcoxon’s matched-paired signed rank test in (B), by Mann-Whitney test in (C–E).
Figure 2
Figure 2
ARNO regulates SFs migration and assembly of focal adhesions. (A) SFs were seeded in migration chambers and grown until monolayer confluence. Cells were then treated with either Allstars control or ARNO siRNAs, when inserts were removed to perform migration assays. Pictures show one representative experiment, superimposed black lines delineate the cell-free area. Bar chart shows the mean of cell migration distance ± SEM from three independent experiments calculated with ImageJ software. (B) SFs were labelled with proliferation dye eFluor 670 (eBioscience), analysed by flow cytometry (day 0) or treated with control or ARNO siRNA, when cells were maintained in culture. After 5 days, mean fluorescence intensity was evaluated in live cells (identified by low DAPI staining). Histogram shows one representative experiment. Mean fluorescence intensity (MFI) of three independent experiments is shown in the column graph, error bars represent ± SEM. (C) Representative immunofluorescence staining of Vinculin (red) and F-actin (green) in SFs treated with Allstars control or ARNO siRNA. Scale bar: 50um. (D) Number, length and area of vinculin positive areas were analysed with ImageJ in SFs treated with Allstars control or ARNO siRNA. Each dot represents one single cell, data are from one representative experiment. (E) Mean of number, length and area of vinculin positive areas from three independent experiments, in SFs treated with Allstars control or ARNO siRNA. Error bars error bars represent ± SEM. *p < 0.05, **p < 0.01, ***p < 0.001 by Mann-Whitney test.
Figure 3
Figure 3
Reduction of ARNO expression down-regulates IL-1β-mediated cytokine expression. Secretion of IL-6, CCL2 and MMP3 was analysed by ELISA in the supernatant of control and ARNO siRNA treated naïve SFs (A) and SFs expanded from mice undergoing experimental Collagen-Induced Arthritis (B). Cells were stimulated with IL-1β as indicated, and cell supernatants were collected after 24h for cytokine quantification. Each dot represents one independent experiment analysed in triplicate, error bars represent SEM. *p < 0.05, **p < 0.01 versus respective siRNA control; #p < 0.05, ##p < 0.01 versus unstimulated control, Statistical significance was evaluated by the Mann-Whitney test.
Figure 4
Figure 4
ARNO is required for STAT3 phosphorylation in SFs. Representative Western blots of the naïve (A) and CIA (B) SFs treated with control and ARNO siRNA followed by IL-1β stimulation (10 ng/ml) at indicated times. Anti-pSTAT3Tyr705, STAT3, ARNO, p-p38, p38 and GAPDH antibodies were used. Graphs show the relative quantification of phosphorylated STAT3 and p38 in naïve SFs and CIA SFs, calculated as pSTAT3/STAT3 and p-p38/p38 band intensity, and changes in total protein expression were calculated as STAT3/GAPDH and p38/GAPDH. Error bars represent SEM (n=3). Each dot represents one independent experiment. *p < 0.05 by Mann-Whitney test. (C) Representative Western blots and quantification of phosphorylated and total STAT3 in control (DMSO) and Cpd188 (STAT3 inhibitor, 73uM) treated naïve SFs followed by IL-1β stimulation at indicated times (n=3). (D) Mean fluorescence intensity of proliferation dye in SFs cultured for 3 days after treated with Cpd188 compared to control SFs. (E) Migration distance of SFs was measured 24 hours after Cpd188 treatment, error bars represent SEM (n=3). *p < 0.05. (F) Control or Cpd188-treated SFs were stimulated by IL-1β (24h), when cell supernatants were collected to analyse cytokine secretion by ELISA. #p < 0.05 versus unstimulated control, statistical significance was evaluated by the Mann-Whitney test. (G) cell viability was assessed using MTS cell proliferation kit. In all cases, one dot represents one individual experiment, analysed in triplicate for ELISA and MTS assays.
Figure 5
Figure 5
ARNO knocked-down SFs show a distinct transcriptomic profile in response to IL-1β stimulation. (A) RNA was isolated (RIN>9) from naïve, IL-1β stimulated and IL-1β stimulated ARNO knocked down SFs (6 hours, n=3) and subjected to bulk RNA-Seq (75bp paired-end, 30M reads). Principal component analysis (PCA) is shown. (B) Differential expression (DE) of genes amongst the three experimental groups. Genes were considered significant if they passed a threshold of padj < 0.01 and |log2foldChange| > 4 among any paired comparison. DE genes were then subjected to unsupervised hierarchical clustering and represented as Z scores. (C,D) Function enrichment and network analysis regulated by IL-1β and ARNO expression. STRING protein-protein interaction network (https://string-db.org) was performed on DE genes from (B), with genes up-regulated only in the IL-1β-treated group (C) or genes up-regulated only in the ARNO siRNA group (D). Significantly modulated pathways components associated with ARNO silencing upon IL-1β are shown. (E) DE of genes in IL-1β stimulated SFs compared to ARNO siRNA IL-1β SFs. Genes are plotted as a scatter plot where x= gene expression in IL-1β SFs, y=gene expression in siRNA ARNO IL-1β SFs. Volcano plot shows gene expression versus p value for each gene. Genes that pass a threshold of padj < 0.01 and |foldChange| > 2 in DE analysis are colored in blue when they are down regulated and red when they are upregulated in IL-1β treated cells. (F) DE genes identified in (E) were used to conduct KEGG pathway enrichment analysis and GO-term pathway analysis. KEGG pathways are represented by circles and are plotted according to fold enrichment on the x-axis and -log10 p-value on the coloured scale. The size is proportional to the number of DE genes. Metascape enrichment network diagrams illustrate GO-term pathways significantly enriched for top up-regulated and down-regulated genes.
Figure 6
Figure 6
ARNO knock-down remodels the type of IL-1β-mediated inflammatory response. (A) mRNA expression as detected by RNA-Seq from Figure 5 for ARNO (Cyth2), IL-6, CXCL9, CCL9, CLDN1, MMP3, MMP13, TNFRSF11b and TNFSF11. Differentially expressed genes with a adjp < 0.01 are shown by *. (B–D) RNA was isolated from unstimulated and IL-1β-stimulated naïve SFs upon Allstars/ARNO siRNA transfection. Relative mRNA expression of genes shown in (A) was evaluated by RT-qPCR using the ΔΔCt method and actin as housekeeping gene. (B) CLDN1, Cxcl9, MMP13, MMP3, (C) IL-6, Ccl9, and (D) TNFRSF11b and TNFSF11 mRNA relative expression. For (B–D), each dot represents one independent experiment (analysed in triplicate), error bars represent SEM (n≥5), *p < 0.05, ***p < 0.001 versus respective siRNA control, #p < 0.05, ###p < 0.001 versus unstimulated control, statistical significance was evaluated by the Mann-Whitney test.
Figure 7
Figure 7
ARNO knock-down decreases IL-1β-dependent responses of CIA SFs. SFs were expanded from mice undergoing Collagen-Induced Arthritis, and RNA was isolated from unstimulated and IL-1β-stimulated cells upon ARNO knock-down by siRNA or Allstar treatment. ARNO (A) TNFRSF11b and TNFSF11 (B), MMP3, MMP13 (C) and IL-6, CCL2 (D) relative mRNA expression was evaluated by RT-qPCR using the ΔΔCt method and actin as housekeeping gene. Each dot represents one independent experiment (analysed in triplicate), error bars represent SEM, *p < 0.05, **p < 0.01 versus respective siRNA control, #p < 0.05 versus unstimulated control, statistical significance was evaluated by the Mann-Whitney test.

Similar articles

Cited by

References

    1. Chang HY, Chi J-T, Dudoit S, Bondre C, van de Rijn M, Botstein D, et al. . Diversity, Topographic Differentiation, and Positional Memory in Human Fibroblasts. Proc Natl Acad Sci USA (2002) 99(20):12877–82. doi: 10.1073/pnas.162488599 - DOI - PMC - PubMed
    1. Koliaraki V, Prados A, Armaka M, Kollias G. The Mesenchymal Context in Inflammation, Immunity and Cancer. Nat Immunol (2020) 21(9):974–82. doi: 10.1038/s41590-020-0741-2 - DOI - PubMed
    1. Culemann S, Grüneboom A, Nicolás-Ávila JÁ, Weidner D, Lämmle KF, Rothe T, et al. . Locally Renewing Resident Synovial Macrophages Provide a Protective Barrier for the Joint. Nature (2019) 572(7771):670–5. doi: 10.1038/s41586-019-1471-1 - DOI - PMC - PubMed
    1. Klein K, Gay S. Epigenetics in Rheumatoid Arthritis. Curr Opin Rheumatol (2015) 27(1):76–82. doi: 10.1097/BOR.0000000000000128 - DOI - PubMed
    1. Filer A, Bik M, Parsonage GN, Fitton J, Trebilcock E, Howlett K, et al. . Galectin 3 Induces a Distinctive Pattern of Cytokine and Chemokine Production in Rheumatoid Synovial Fibroblasts via Selective Signaling Pathways. Arthritis Rheumatol (2009) 60(6):1604–14. doi: 10.1002/art.24574 - DOI - PMC - PubMed

Publication types