

QiShenYiQi Inhibits Tissue Plasminogen Activator-Induced Brain Edema and Hemorrhage after Ischemic Stroke in Mice
- PMID: 35095486
- PMCID: PMC8790519
- DOI: 10.3389/fphar.2021.759027
QiShenYiQi Inhibits Tissue Plasminogen Activator-Induced Brain Edema and Hemorrhage after Ischemic Stroke in Mice
Abstract
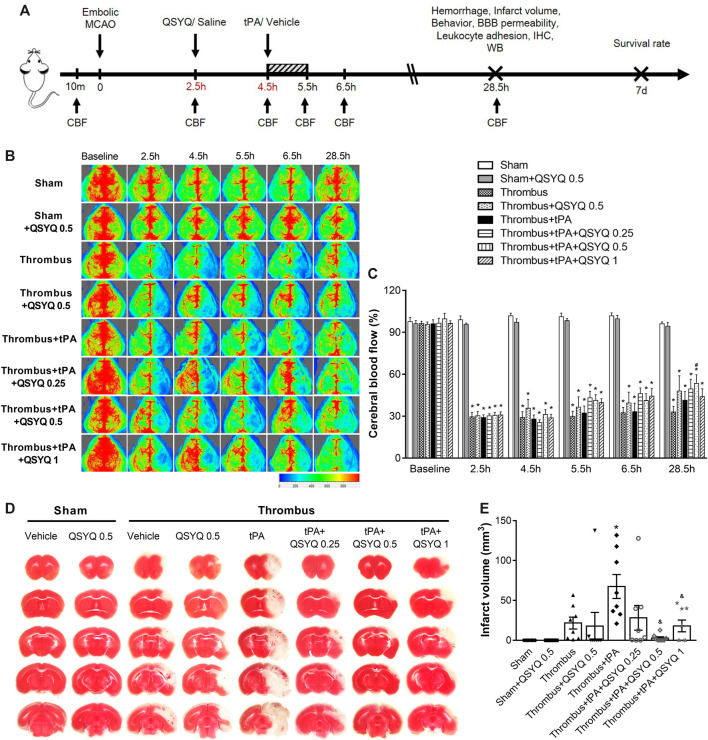
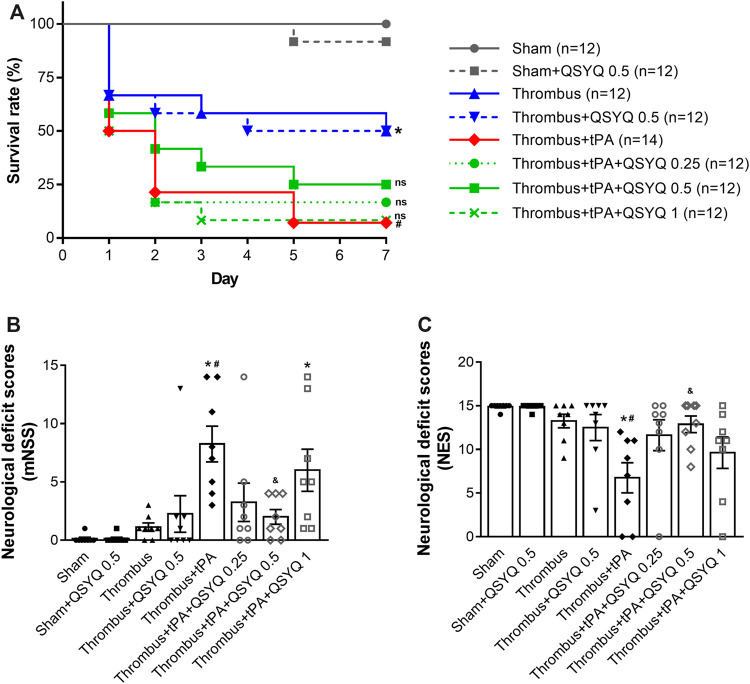
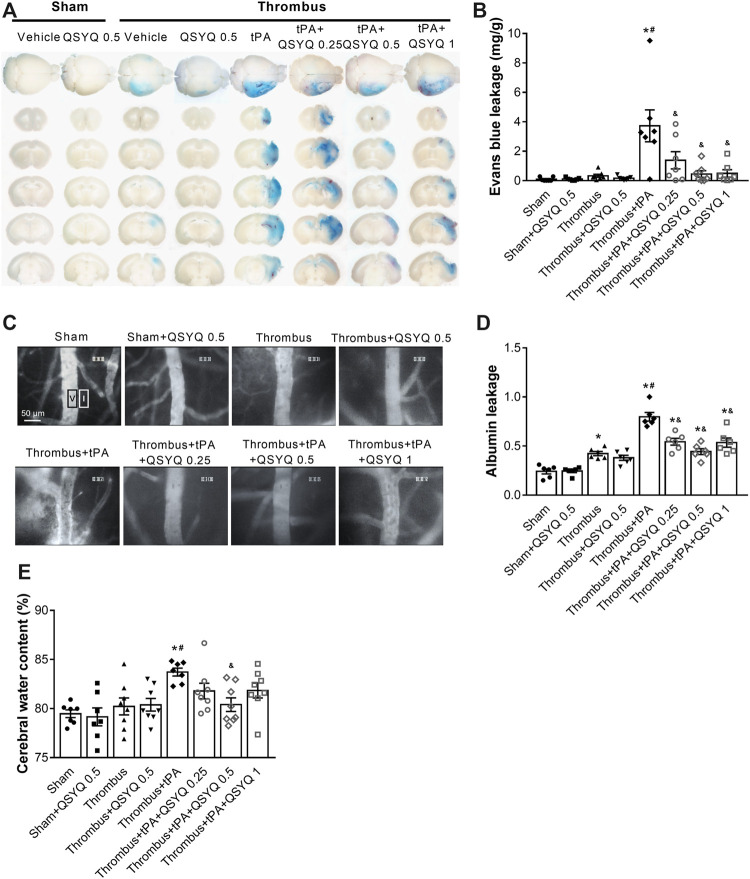
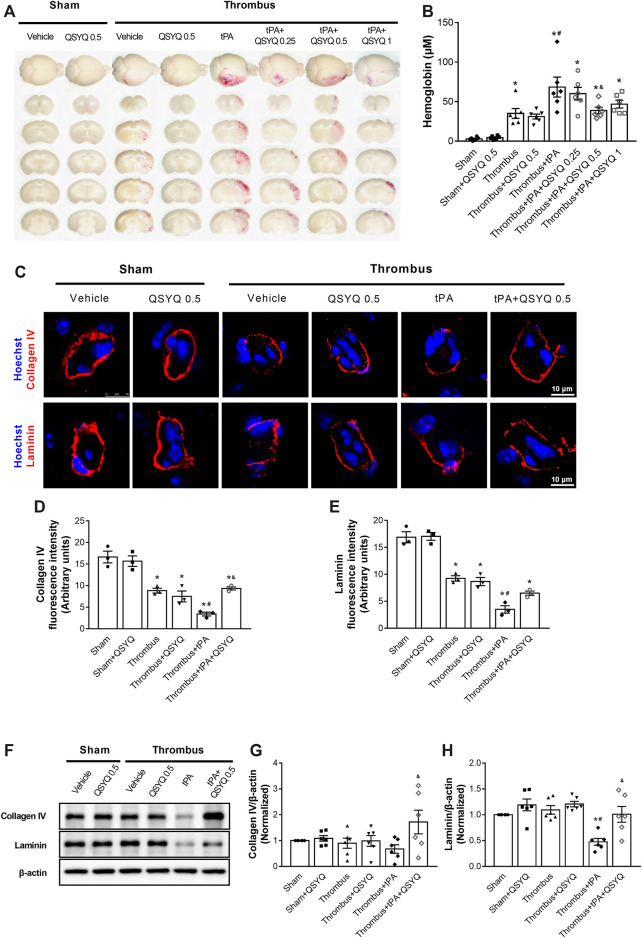
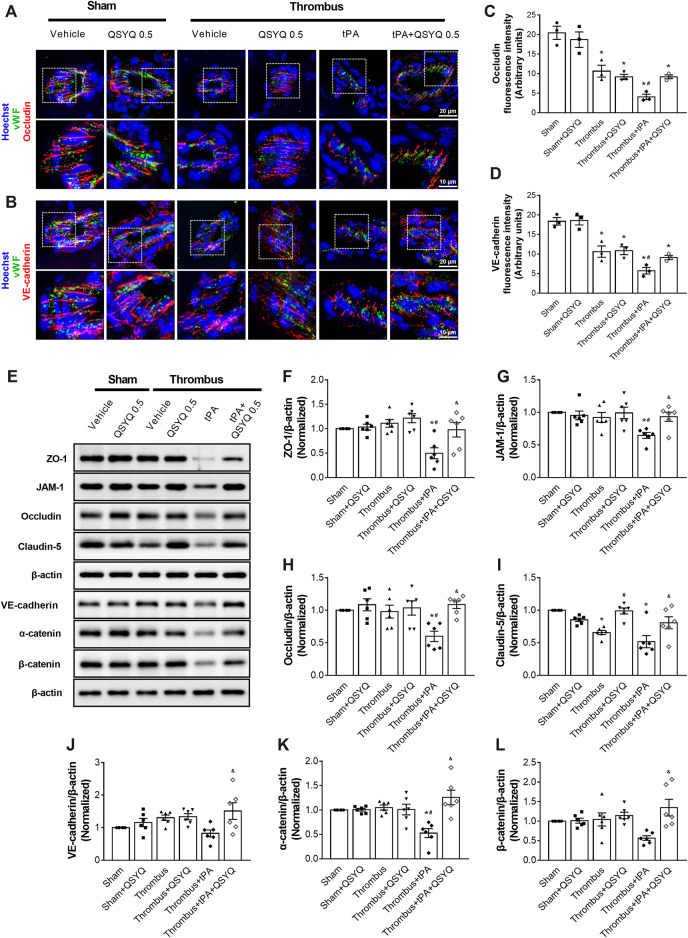
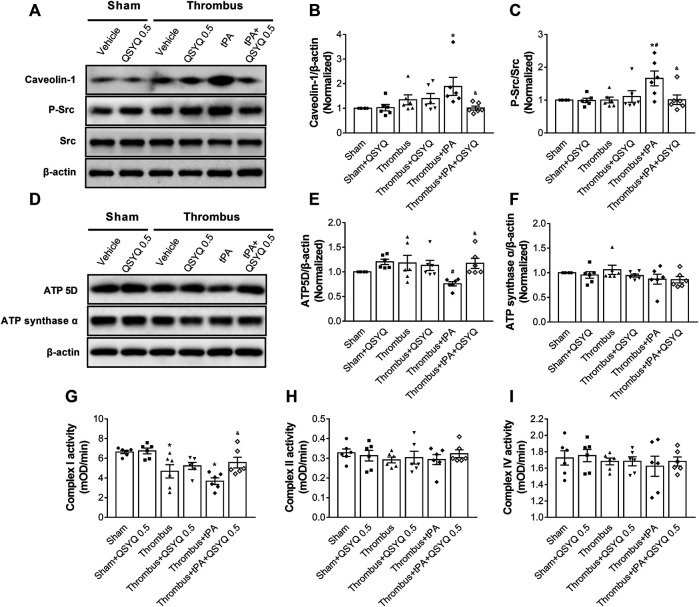
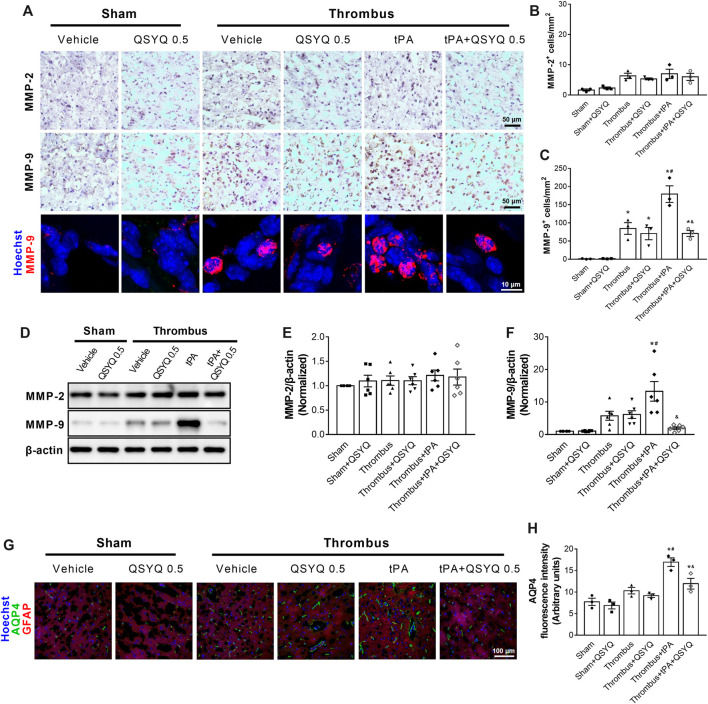
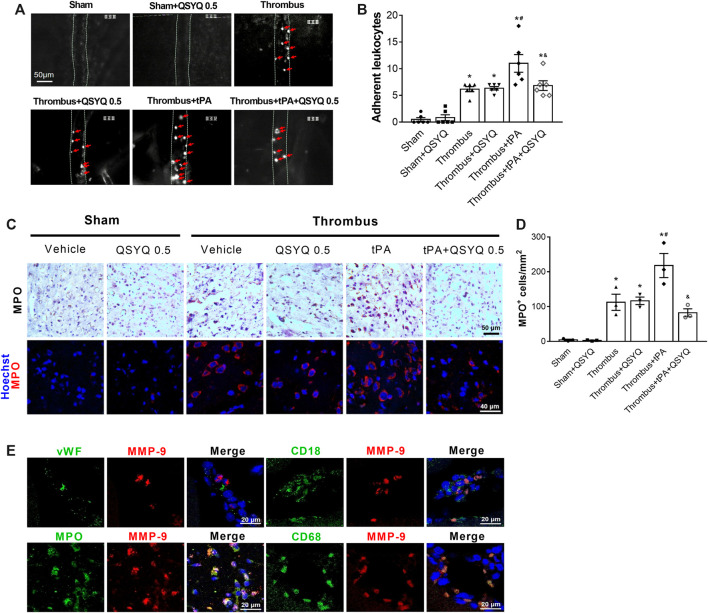
Background: Thrombolysis with tissue plasminogen activator (tPA) remains the only approved drug therapy for acute ischemic stroke. However, delayed tPA treatment is associated with an increased risk of brain hemorrhage. In this study, we assessed whether QiShenYiQi (QSYQ), a compound Chinese medicine, can attenuate tPA-induced brain edema and hemorrhage in an experimental stroke model. Methods: Male mice were subjected to ferric chloride-induced carotid artery thrombosis followed by mechanical detachment of thrombi. Then mice were treated with QSYQ at 2.5 h followed by administration of tPA (10 mg/kg) at 4.5 h. Hemorrhage, infarct size, neurological score, cerebral blood flow, Evans blue extravasation, FITC-labeled albumin leakage, tight and adherens junction proteins expression, basement membrane proteins expression, matrix metalloproteinases (MMPs) expression, leukocyte adhesion, and leukocyte infiltration were assessed 24 h after tPA administration. Results: Compared with tPA alone treatments, the combination therapy of QSYQ and tPA significantly reduced hemorrhage, infarction, brain edema, Evans blue extravasation, albumin leakage, leukocyte adhesion, MMP-9 expression, and leukocyte infiltration at 28.5 h after stroke. The combination also significantly improved the survival rate, cerebral blood flow, tight and adherens junction proteins (occludin, claudin-5, junctional adhesion molecule-1, zonula occludens-1, VE-cadherin, α-catenin, β-catenin) expression, and basement membrane proteins (collagen IV, laminin) expression. Addition of QSYQ protected the downregulated ATP 5D and upregulated p-Src and Caveolin-1 after tPA treatment. Conclusion: Our results show that QSYQ inhibits tPA-induced brain edema and hemorrhage by protecting the blood-brain barrier integrity, which was partly attributable to restoration of energy metabolism, protection of inflammation and Src/Caveolin signaling activation. The present study supports QSYQ as an effective adjunctive therapy to increase the safety of delayed tPA thrombolysis for ischemic stroke.
Keywords: QiShenYiQi; blood-brain barrier; hemorrhage; ischemic stroke; tissue plasminogen activator.
Copyright © 2022 Ye, Li, Pan, Yan, Sun, Wang, Yao, Fan and Han.
Conflict of interest statement
The authors declare that the research was conducted in the absence of any commercial or financial relationships that could be construed as a potential conflict of interest.
Figures
Similar articles
-
YangXueQingNaoWan attenuated blood brain barrier disruption after thrombolysis with tissue plasminogen activator in ischemia stroke.J Ethnopharmacol. 2024 Jan 10;318(Pt B):117024. doi: 10.1016/j.jep.2023.117024. Epub 2023 Aug 11. J Ethnopharmacol. 2024. PMID: 37572928
-
Angioedema and Hemorrhage After 4.5-Hour tPA (Tissue-Type Plasminogen Activator) Thrombolysis Ameliorated by T541 via Restoring Brain Microvascular Integrity.Stroke. 2018 Sep;49(9):2211-2219. doi: 10.1161/STROKEAHA.118.021754. Stroke. 2018. PMID: 30354988
-
Phthalide derivative CD21 attenuates tissue plasminogen activator-induced hemorrhagic transformation in ischemic stroke by enhancing macrophage scavenger receptor 1-mediated DAMP (peroxiredoxin 1) clearance.J Neuroinflammation. 2021 Jun 24;18(1):143. doi: 10.1186/s12974-021-02170-7. J Neuroinflammation. 2021. PMID: 34162400 Free PMC article.
-
Mechanisms of hemorrhagic transformation after tissue plasminogen activator reperfusion therapy for ischemic stroke.Stroke. 2004 Nov;35(11 Suppl 1):2726-30. doi: 10.1161/01.STR.0000143219.16695.af. Epub 2004 Sep 30. Stroke. 2004. PMID: 15459442 Review.
-
Ameliorating effects of traditional Chinese medicine preparation, Chinese materia medica and active compounds on ischemia/reperfusion-induced cerebral microcirculatory disturbances and neuron damage.Acta Pharm Sin B. 2015 Jan;5(1):8-24. doi: 10.1016/j.apsb.2014.11.002. Epub 2015 Jan 24. Acta Pharm Sin B. 2015. PMID: 26579420 Free PMC article. Review.
Cited by
-
Heart-brain interaction in cardiogenic dementia: pathophysiology and therapeutic potential.Front Cardiovasc Med. 2024 Jan 24;11:1304864. doi: 10.3389/fcvm.2024.1304864. eCollection 2024. Front Cardiovasc Med. 2024. PMID: 38327496 Free PMC article. Review.
-
Yin Huo Tang, a traditional Chinese herbal formula, relives ovariectomy and empty bottle stimulation-induced menopause-like symptoms in mice.Front Endocrinol (Lausanne). 2022 Oct 19;13:994642. doi: 10.3389/fendo.2022.994642. eCollection 2022. Front Endocrinol (Lausanne). 2022. PMID: 36339416 Free PMC article.
-
A modified mouse model of haemorrhagic transformation associated with tPA administration after thromboembolic stroke.Heliyon. 2023 Jan 19;9(1):e13102. doi: 10.1016/j.heliyon.2023.e13102. eCollection 2023 Jan. Heliyon. 2023. PMID: 36747951 Free PMC article.
-
Editorial: Complementary therapies for neurological disorders: from bench to clinical practices.Front Neurol. 2023 Jun 14;14:1224144. doi: 10.3389/fneur.2023.1224144. eCollection 2023. Front Neurol. 2023. PMID: 37388551 Free PMC article. No abstract available.
References
-
- Chen Q. F., Liu Y. Y., Pan C. S., Fan J. Y., Yan L., Hu B. H., et al. (2018a). Angioedema and Hemorrhage after 4.5-Hour tPA (Tissue-Type Plasminogen Activator) Thrombolysis Ameliorated by T541 via Restoring Brain Microvascular Integrity. Stroke 49 (9), 2211–2219. 10.1161/STROKEAHA.118.021754 - DOI - PubMed
-
- Ding X. W., Sun X., Shen X. F., Lu Y., Wang J. Q., Sun Z. R., et al. (2019). Propofol Attenuates TNF-α-Induced MMP-9 Expression in Human Cerebral Microvascular Endothelial Cells by Inhibiting Ca2+/CAMK II/ERK/NF-κB Signaling Pathway. Acta Pharmacol. Sin 40 (10), 1303–1313. 10.1038/s41401-019-0258-0 - DOI - PMC - PubMed
LinkOut - more resources
Full Text Sources
Miscellaneous