. 2022 Jan 11:8:794841.
doi: 10.3389/fnut.2021.794841. eCollection 2021.

Mechanisms for Improving Hepatic Glucolipid Metabolism by Cinnamic Acid and Cinnamic Aldehyde: An Insight Provided by Multi-Omics

Affiliations

Mechanisms for Improving Hepatic Glucolipid Metabolism by Cinnamic Acid and Cinnamic Aldehyde: An Insight Provided by Multi-Omics

You Wu et al. Front Nutr. .

Abstract

Cinnamic acid (AC) and cinnamic aldehyde (AL) are two chemicals enriched in cinnamon and have been previously proved to improve glucolipid metabolism, thus ameliorating metabolic disorders. In this study, we employed transcriptomes and proteomes on AC and AL treated db/db mice in order to explore the underlying mechanisms for their effects. Db/db mice were divided into three groups: the control group, AC group and AL group. Gender- and age-matched wt/wt mice were used as a normal group. After 4 weeks of treatments, mice were sacrificed, and liver tissues were used for further analyses. Functional enrichment of differentially expressed genes (DEGs) and differentially expressed proteins (DEPs) were performed using Gene Ontology (GO) and Kyoto Encyclopedia of Genes and Genomes (KEGG) databases. DEPs were further verified by parallel reaction monitoring (PRM). The results suggested that AC and AL share similar mechanisms, and they may improve glucolipid metabolism by improving mitochondrial functions, decreasing serotonin contents and upregulating autophagy mediated lipid clearance. This study provides an insight into the molecular mechanisms of AC and AL on hepatic transcriptomes and proteomes in disrupted metabolic situations and lays a foundation for future experiments.

Keywords: cinnamaldehyde; cinnamic acid; db/db; glucolipid metabolism; liver; proteome; transcriptome.


Conflict of interest statement

The authors declare that the research was conducted in the absence of any commercial or financial relationships that could be construed as a potential conflict of interest.

Figures
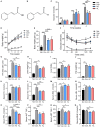
Figure 1
Figure 1
Effects of AC and AL on glucolipid metabolism in mice. (A,B) The chemical structure of AC (A) and AL (B). (C,D) Fast glucose levels (C) and body weight (D) of mice. (E) Body weight gain of mice at the fourth week of treatment. (F) Glucose levels of mice during ITT (hypodermically injected with insulin 1 IU/kg body weight). (G) Area under curve of ITT experiment. (H–J) Liver weight, liver index and epididymal fat weight of mice, respectively. (K–R) Serum lipid profile and ALT, AST and BUN of mice measured by automated chemistry analyzer. Nor: wt/wt mice treated with vehicle. Con: db/db mice treated with vehicle. AC: db/db mice treated with 20 mg/kg bodyweight/day cinnamic acid. AL: db/db mice treated with 20 mg/kg bodyweight/day cinnamic aldehyde. One-way ANOVA analysis applied for statistical analysis, N = 6–7/group. *p < 0.05, **p < 0.01, ***p < 0.001.
Figure 2
Figure 2
Histological observation. (A) HandE staining of liver tissues harvested from mice. (B) HandE staining of epididymal fat (the left side) of mice. (C) PAS staining of liver from mice. All images were recorded under 200× magnification. (D) Steatosis grade scores of liver HandE staining. (E) Adipocyte size measured from epidydimal fat HandE staining. (One-way ANOVA analysis applied for statistical analysis, N = 3/group.) Normal: wt/wt mice treated with vehicle. Control: db/db mice treated with vehicle. Acid: db/db mice treated with 20 mg/kg bodyweight/day cinnamic acid. Aldehyde: db/db mice treated with 20 mg/kg bodyweight/day cinnamic aldehyde. *p < 0.05, **p < 0.01, ***p < 0.001.
Figure 3
Figure 3
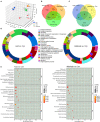
Overview of transcriptomes and proteomes of mice livers and functional enrichment of differentially expressed genes (DEGs) and differentially expressed proteins (DEPs). (A) Principal component analysis (PCA) of proteome results. (B,C) Venn diagram of DEGs (B) and DEPs (C). (D) Donut diagram of GO enrichment of DEGs and DEPs between the acid group and control group and aldehyde group and control group. The outer ring indicates the functional annotation of DEGs, and the inner ring indicates the functional annotation of DEPs. (E) GO enrichment of DEPs depicted by bubble diagrams. The color indicates the p-value, and the size indicates the enrichment score of each pathway. Nor: wt/wt mice treated with vehicle. Con: db/db mice treated with vehicle. AC: db/db mice treated with 20 mg/kg bodyweight/day cinnamic acid. AL: db/db mice treated with 20 mg/kg bodyweight/day cinnamic aldehyde.
Figure 4
Figure 4
Effect of AC and AL on key factors involved in glucolipid metabolism. (A) Normalized abundance of indicated proteins in mice livers. Data are quantile normalized before log2 transformation. (B) Results of PRM analysis. Blue column indicates the fold change of DIA proteome analysis, and red column indicates the fold change of PRM verification. Nor: wt/wt mice treated with vehicle. Con: db/db mice treated with vehicle. AC: db/db mice treated with 20 mg/kg bodyweight/day cinnamic acid. AL: db/db mice treated with 20 mg/kg bodyweight/day cinnamic aldehyde. *p < 0.05, **p < 0.01, ***p < 0.001.
Figure 5
Figure 5
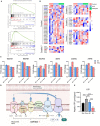
AC and AL improved mitochondrial function in db/db Mice. (A) Gene set enrichment analysis (GSEA) of oxidative phosphorylation (OXPHOS) pathway. (B) Heatmap of expression of proteins involved in OXPHOS pathway. Red indicates high expression level, and blue indicates low expression level. (C) Results from PRM analysis. Blue column indicates the fold change of DIA proteome analysis, and red column indicates the fold change of PRM verification. (D) Diagram of the OXPHOS pathway in mitochondria. (E) ATP content in mice livers tested by colorimetric method (one-way ANOVA analysis applied, N = 6/group). Nor: wt/wt mice treated with vehicle. Con/control: db/db mice treated with vehicle. AC/acid: db/db mice treated with 20 mg/kg bodyweight/day cinnamic acid. AL/aldehyde: db/db mice treated with 20 mg/kg bodyweight/day cinnamic aldehyde. *p < 0.05, **p < 0.01, ***p < 0.001.
Figure 6
Figure 6
Effect of AC and AL on tryptophan metabolism in db/db mice livers. (A) Normalized abundance of indicated proteins in mice livers. Data are quantile normalized before log2 transformation. (B,D) Results from PRM analysis. Blue column indicates the fold change of DIA proteome analysis, and red column indicates the fold change of PRM verification. (C) Heatmap of expression of DEPs involved in tryptophan metabolism pathway. Red indicates high expression level, and blue indicates low expression level. (E) Serotonin content in mice livers tested by enzyme linked immunosorbent assay (ELISA) (one-way ANOVA analysis applied, N = 6/group). (F) Diagram of tryptophan metabolism pathway in mice. Red color indicates upregulated proteins, and blue indicates downregulated proteins, either by AC or AL treatment, revealed by DIA proteome analysis. Nor: wt/wt mice treated with vehicle. Con/control: db/db mice treated with vehicle. AC/acid: db/db mice treated with 20 mg/kg bodyweight/day cinnamic acid. AL/aldehyde: db/db mice treated with 20 mg/kg bodyweight/day cinnamic aldehyde. *p < 0.05, ***p < 0.001.
Figure 7
Figure 7
Effect of AC and AL on autophagy mediated lipid clearance. (A) Normalized abundance of indicated proteins in mice livers. Data are quantile normalized before log2 transformation. (B) Results from PRM analysis. Blue column indicates the fold change of DIA proteome analysis, and red column indicates the fold change of PRM verification. (C) Diagram of LRP1 and LDLR mediated lipoprotein clearance and autophagy in mice liver. Nor: wt/wt mice treated with vehicle. Con/control: db/db mice treated with vehicle. AC/acid: db/db mice treated with 20 mg/kg bodyweight/day cinnamic acid. AL/aldehyde: db/db mice treated with 20 mg/kg bodyweight/day cinnamic aldehyde. *p < 0.05, **p < 0.01, ***p < 0.001.

Similar articles

Cited by

References

    1. Fabbrini E, Sullivan S, Klein S. Obesity and nonalcoholic fatty liver disease: biochemical, metabolic, and clinical implications. Hepatology. (2010) 51:679–89. 10.1002/hep.23280 - DOI - PMC - PubMed
    1. Chooi YC, Ding C, Magkos F. The epidemiology of obesity. Metabolism. (2019) 92:6–10. 10.1016/j.metabol.2018.09.005 - DOI - PubMed
    1. Saeedi P, Petersohn I, Salpea P, Malanda B, Karuranga S, Unwin N, et al. . Global and regional diabetes prevalence estimates for 2019 and projections for 2030 and 2045: Results from the International Diabetes Federation Diabetes Atlas, 9(th) edition. Diabetes Res Clin Pract. (2019) 157:107843. 10.1016/j.diabres.2019.107843 - DOI - PubMed
    1. Zheng Y, Ley SH, Hu FB. Global aetiology and epidemiology of type 2 diabetes mellitus and its complications. Nat Rev Endocrinol. (2018) 14:88–98. 10.1038/nrendo.2017.151 - DOI - PubMed
    1. Loh M, Zhou L, Ng HK, Chambers JC. Epigenetic disturbances in obesity and diabetes: Epidemiological and functional insights. Mol Metab 27s. (2019) S33–41. 10.1016/j.molmet.2019.06.011 - DOI - PMC - PubMed