

A dysbiotic microbiome promotes head and neck squamous cell carcinoma
- PMID: 35087236
- PMCID: PMC8882136
- DOI: 10.1038/s41388-021-02137-1
A dysbiotic microbiome promotes head and neck squamous cell carcinoma
Abstract
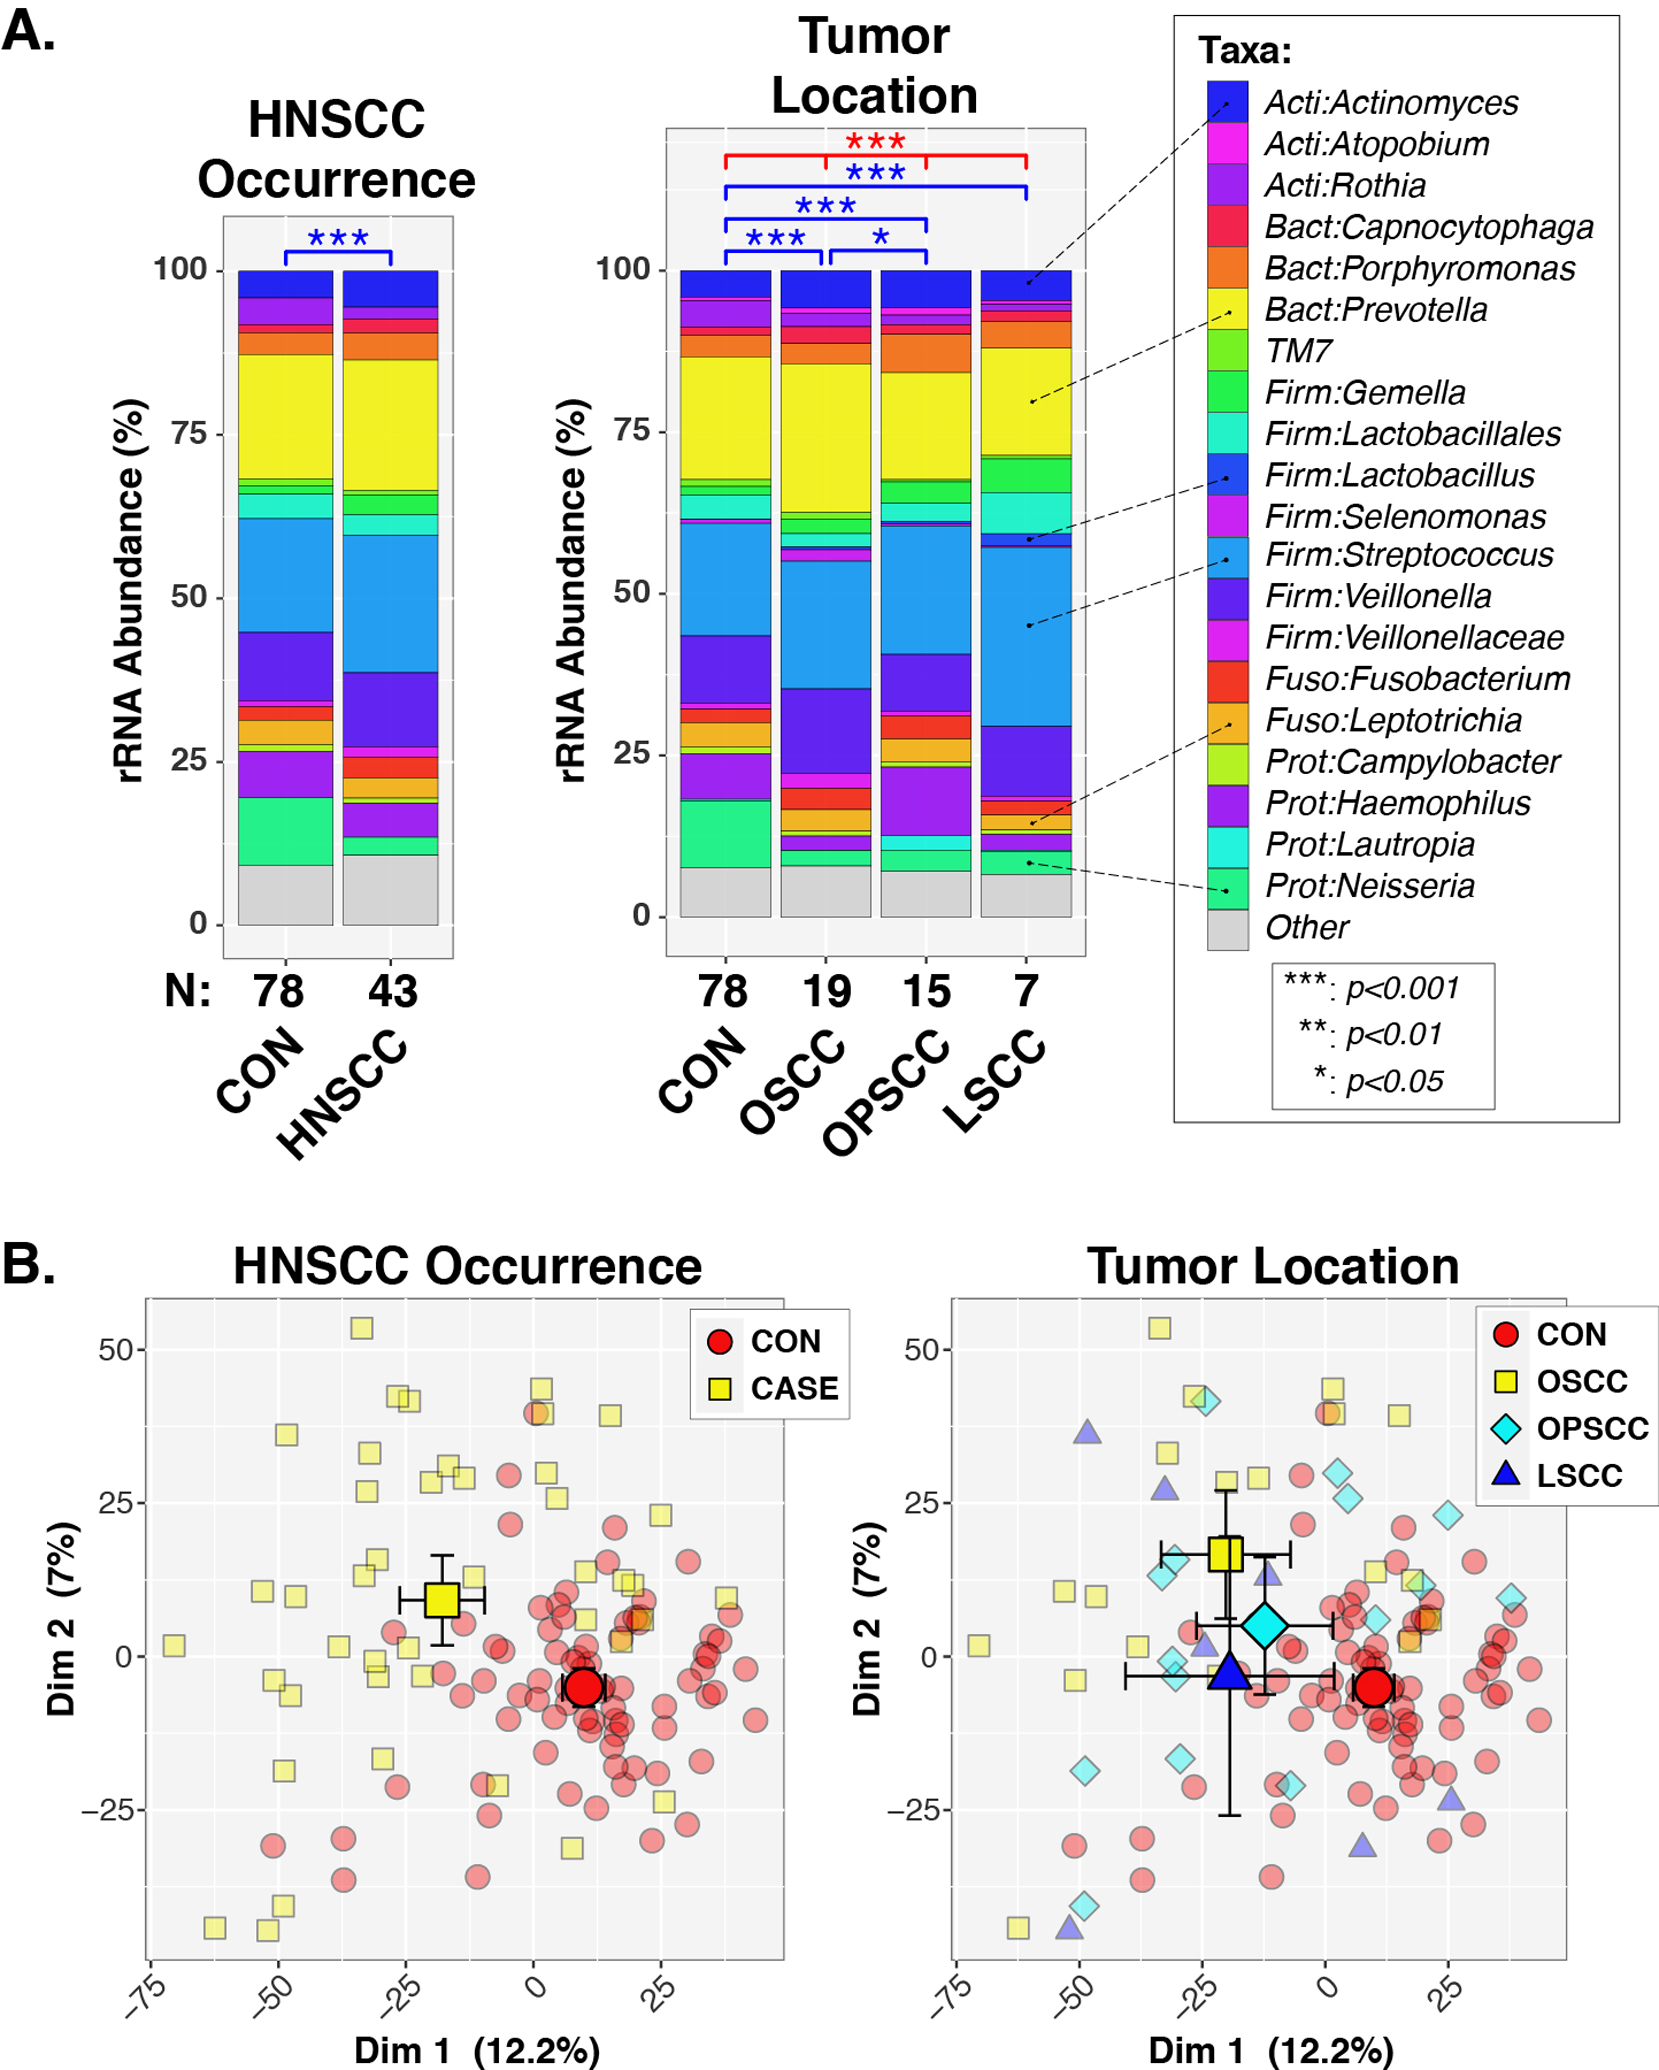
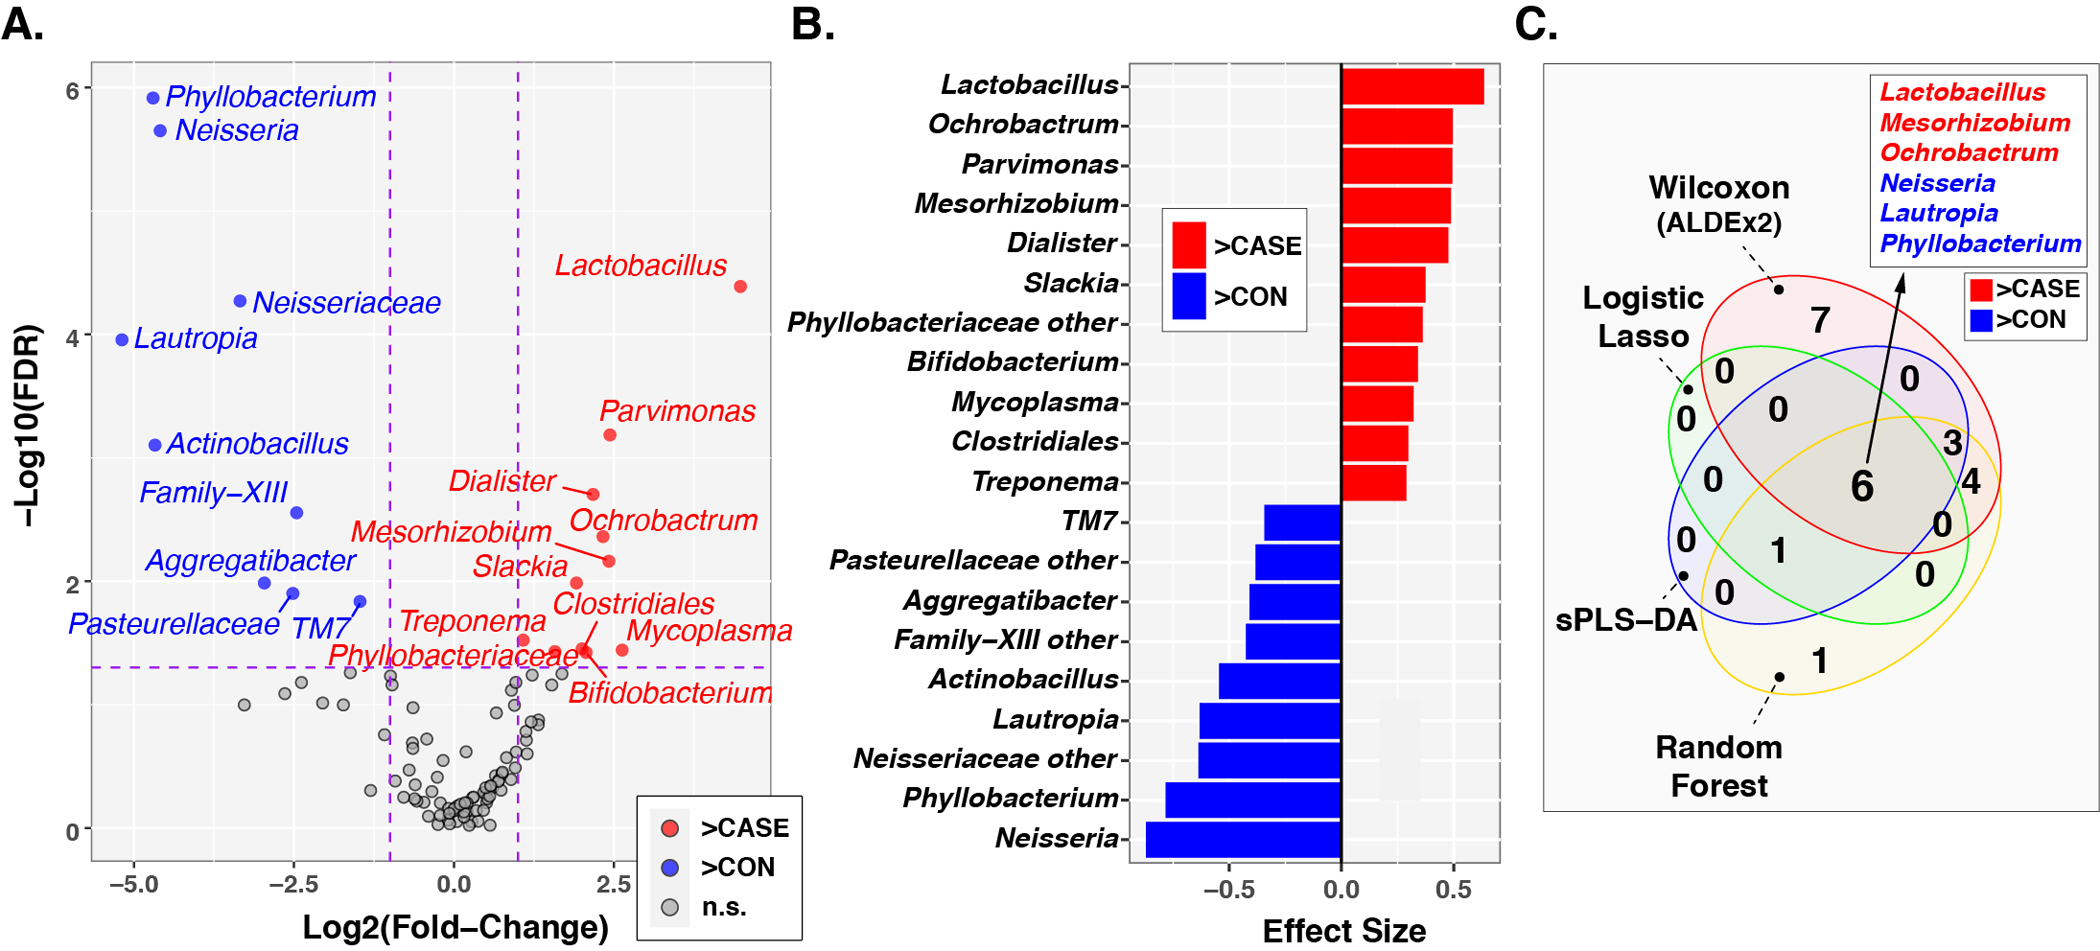
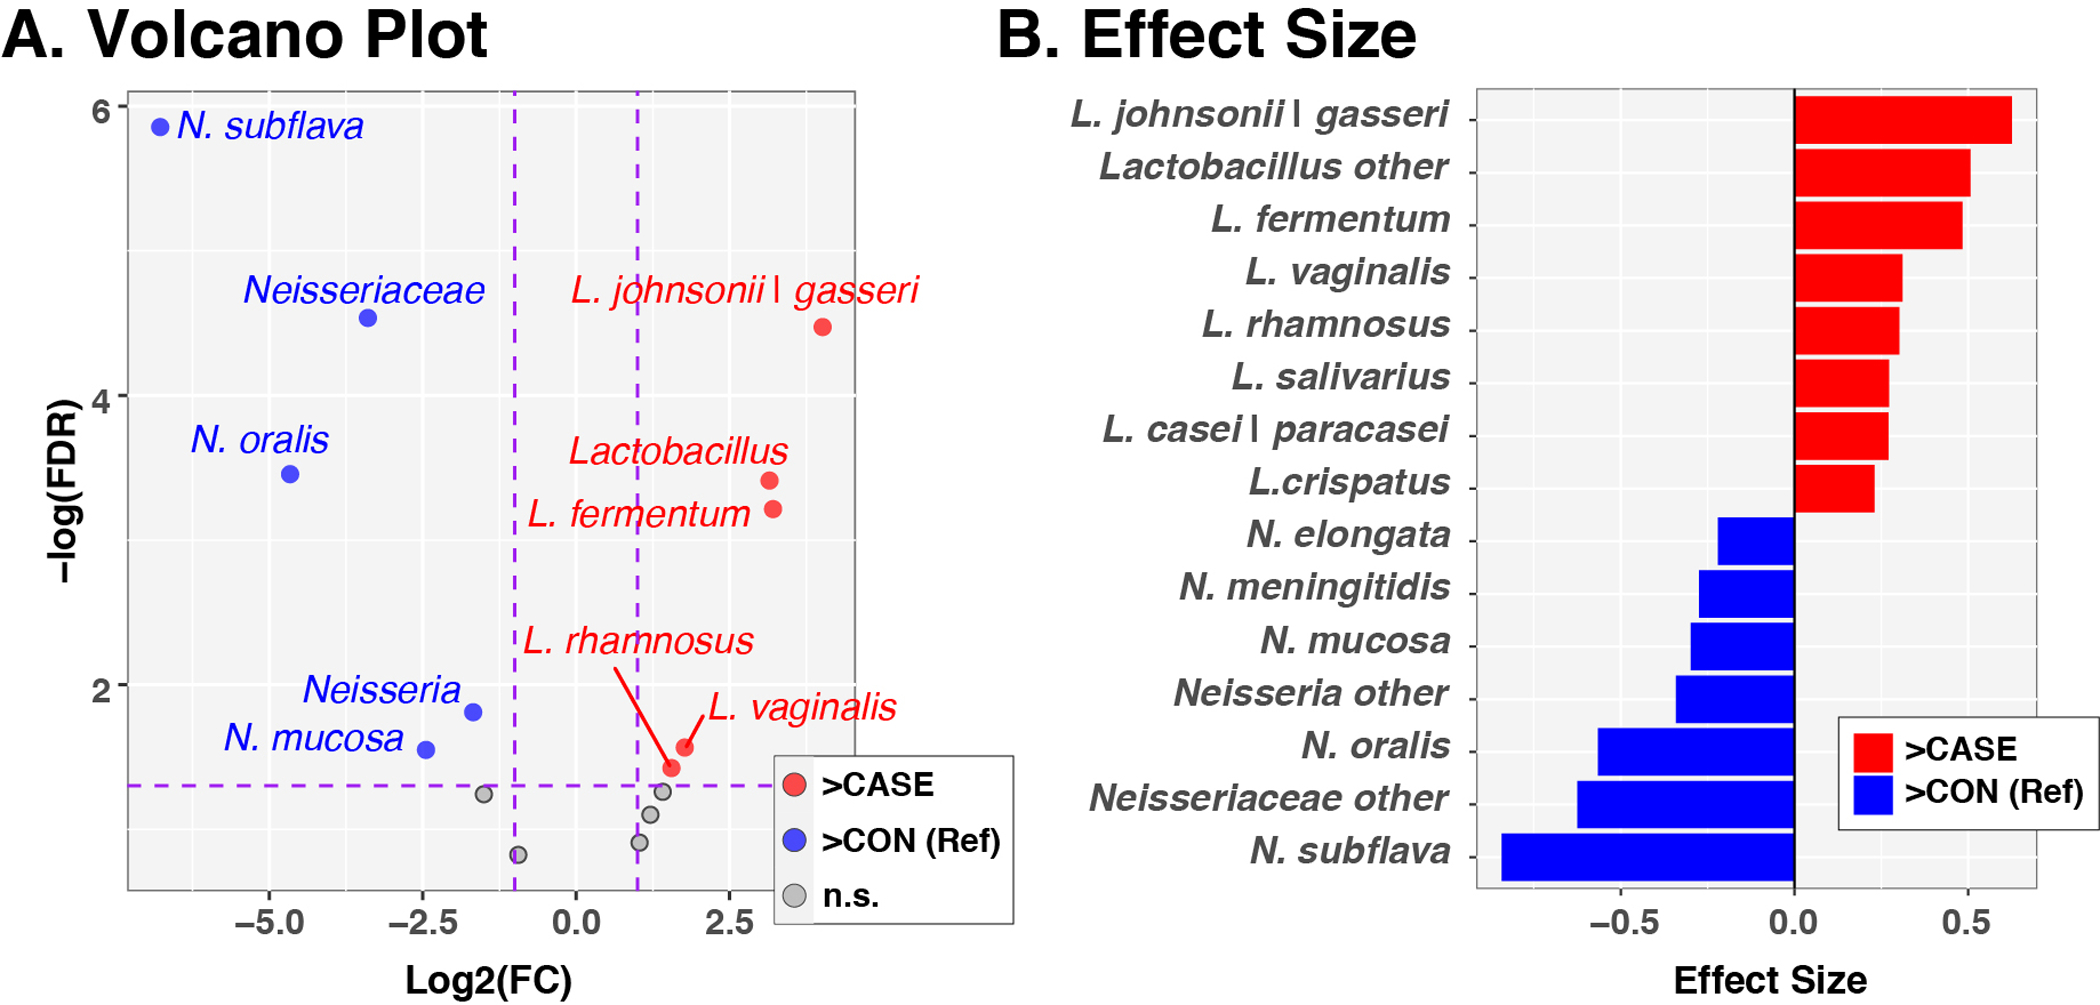
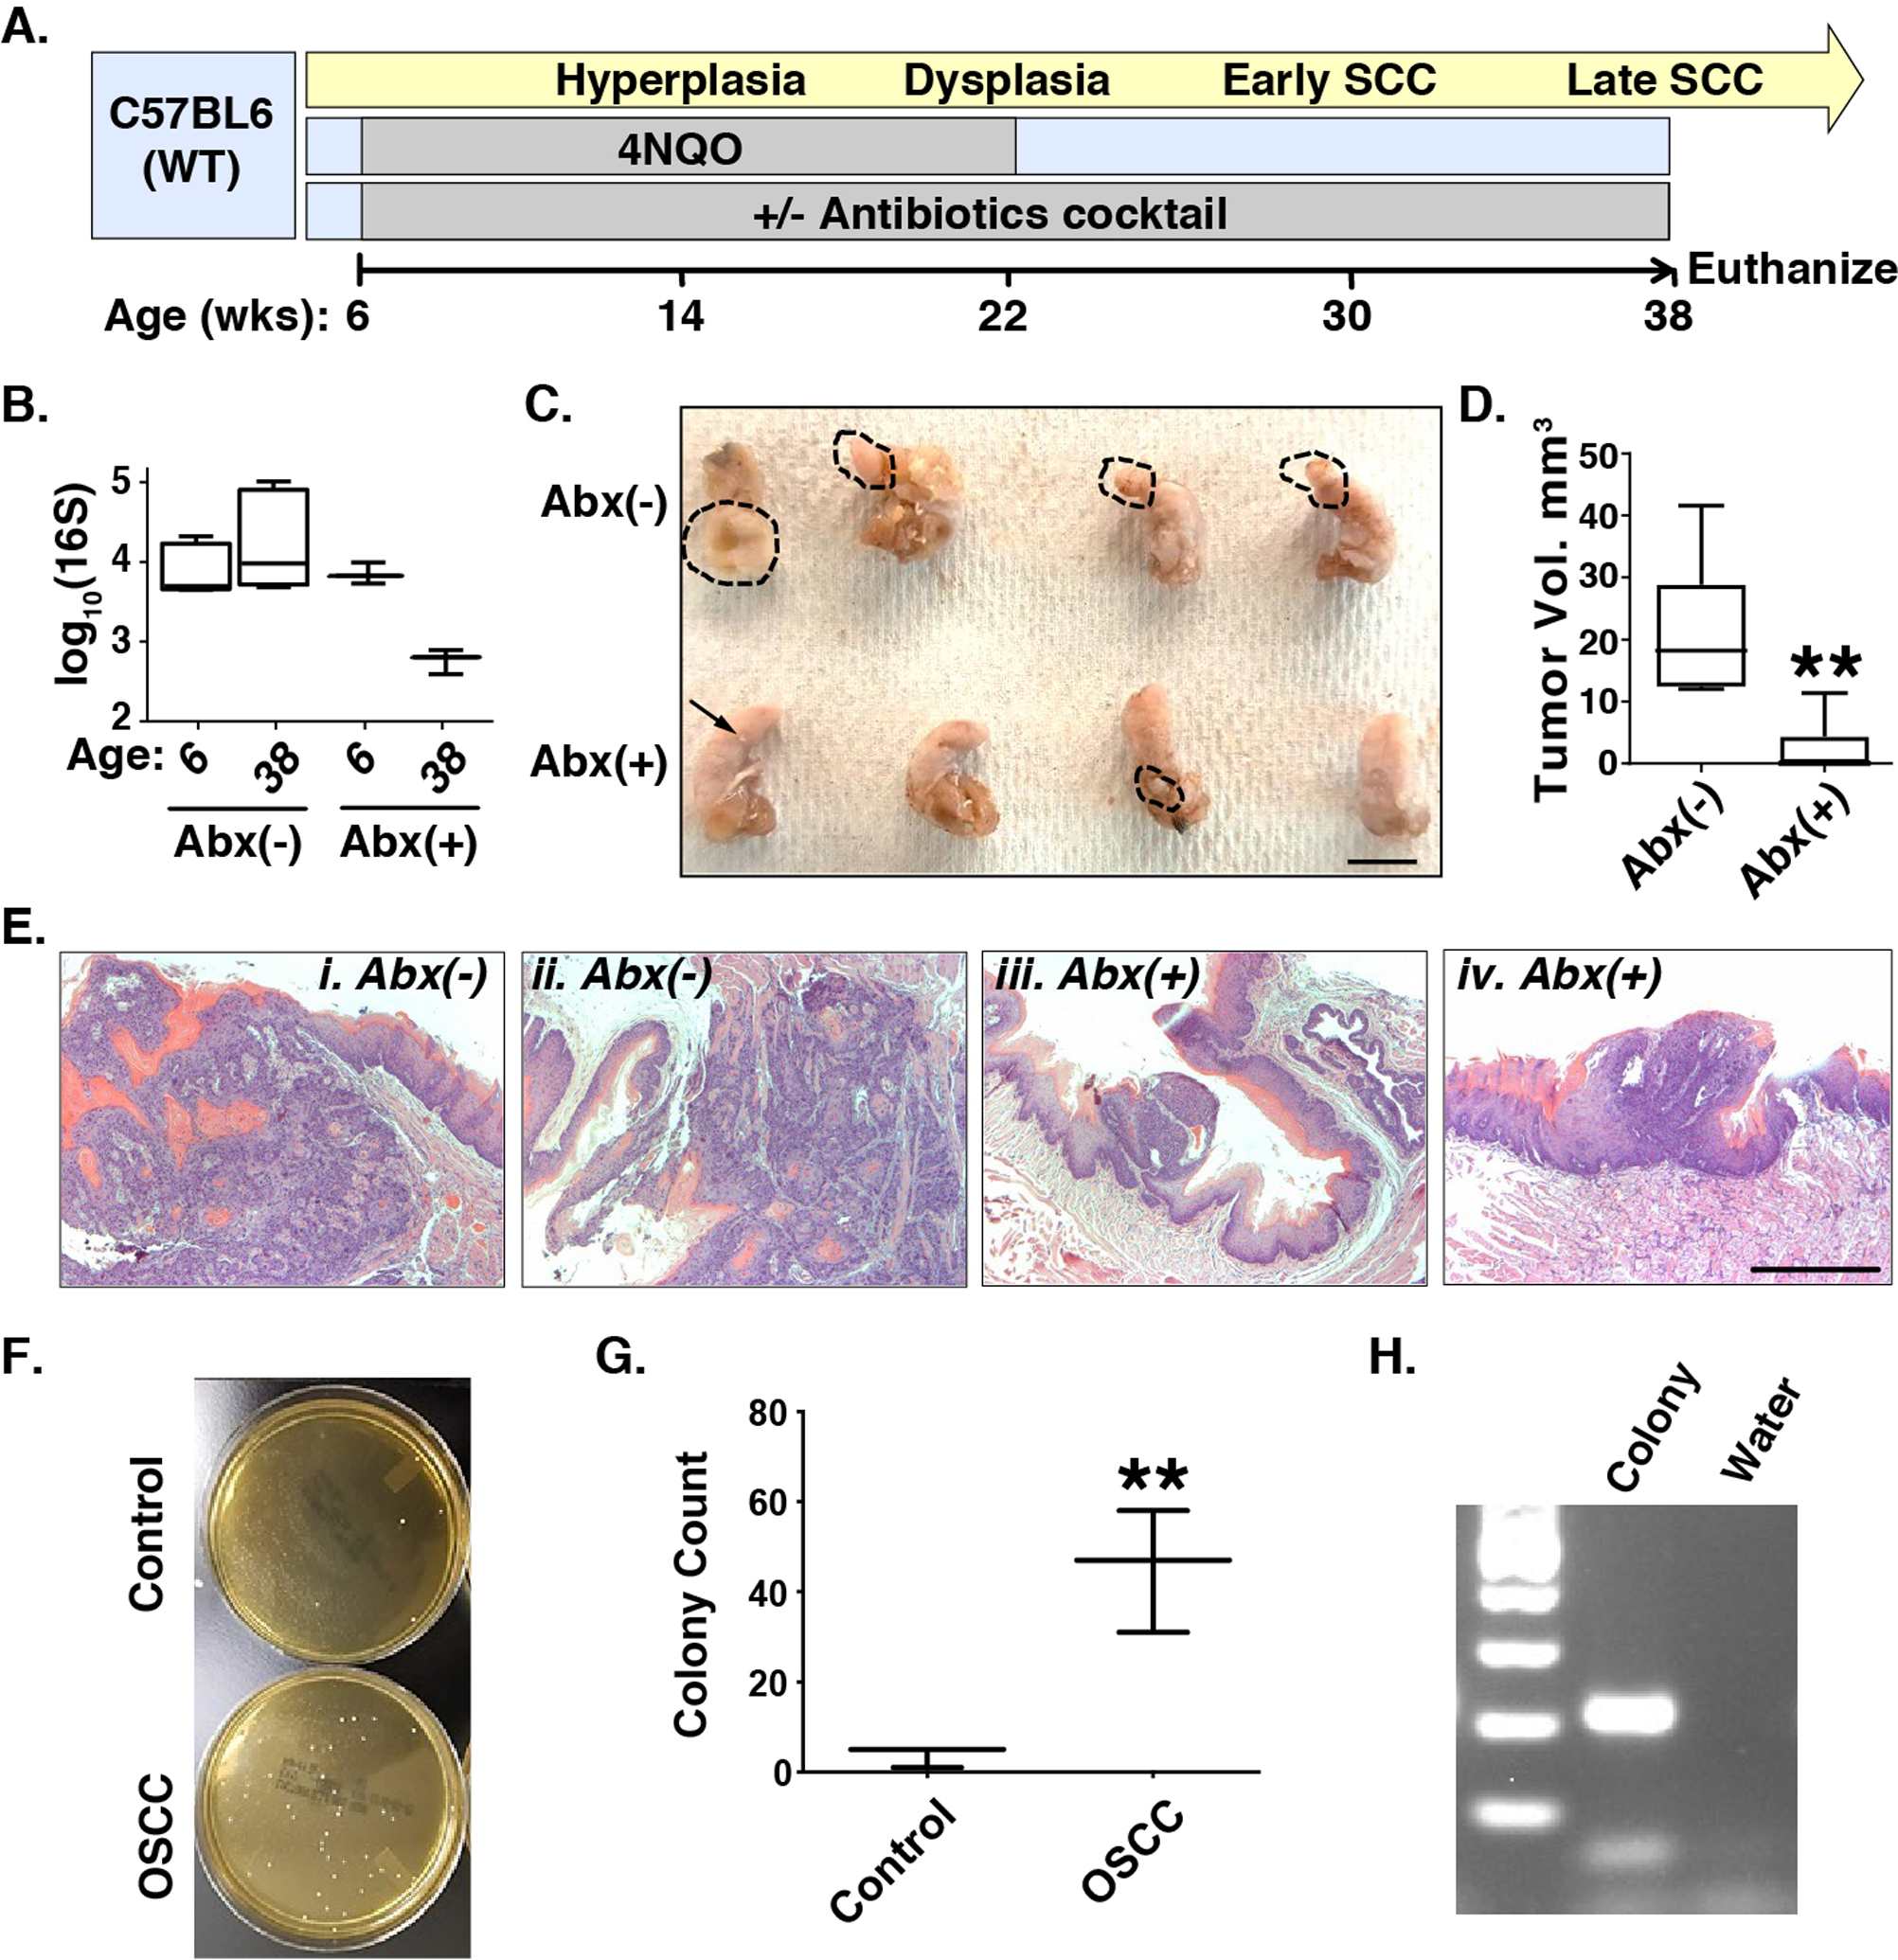
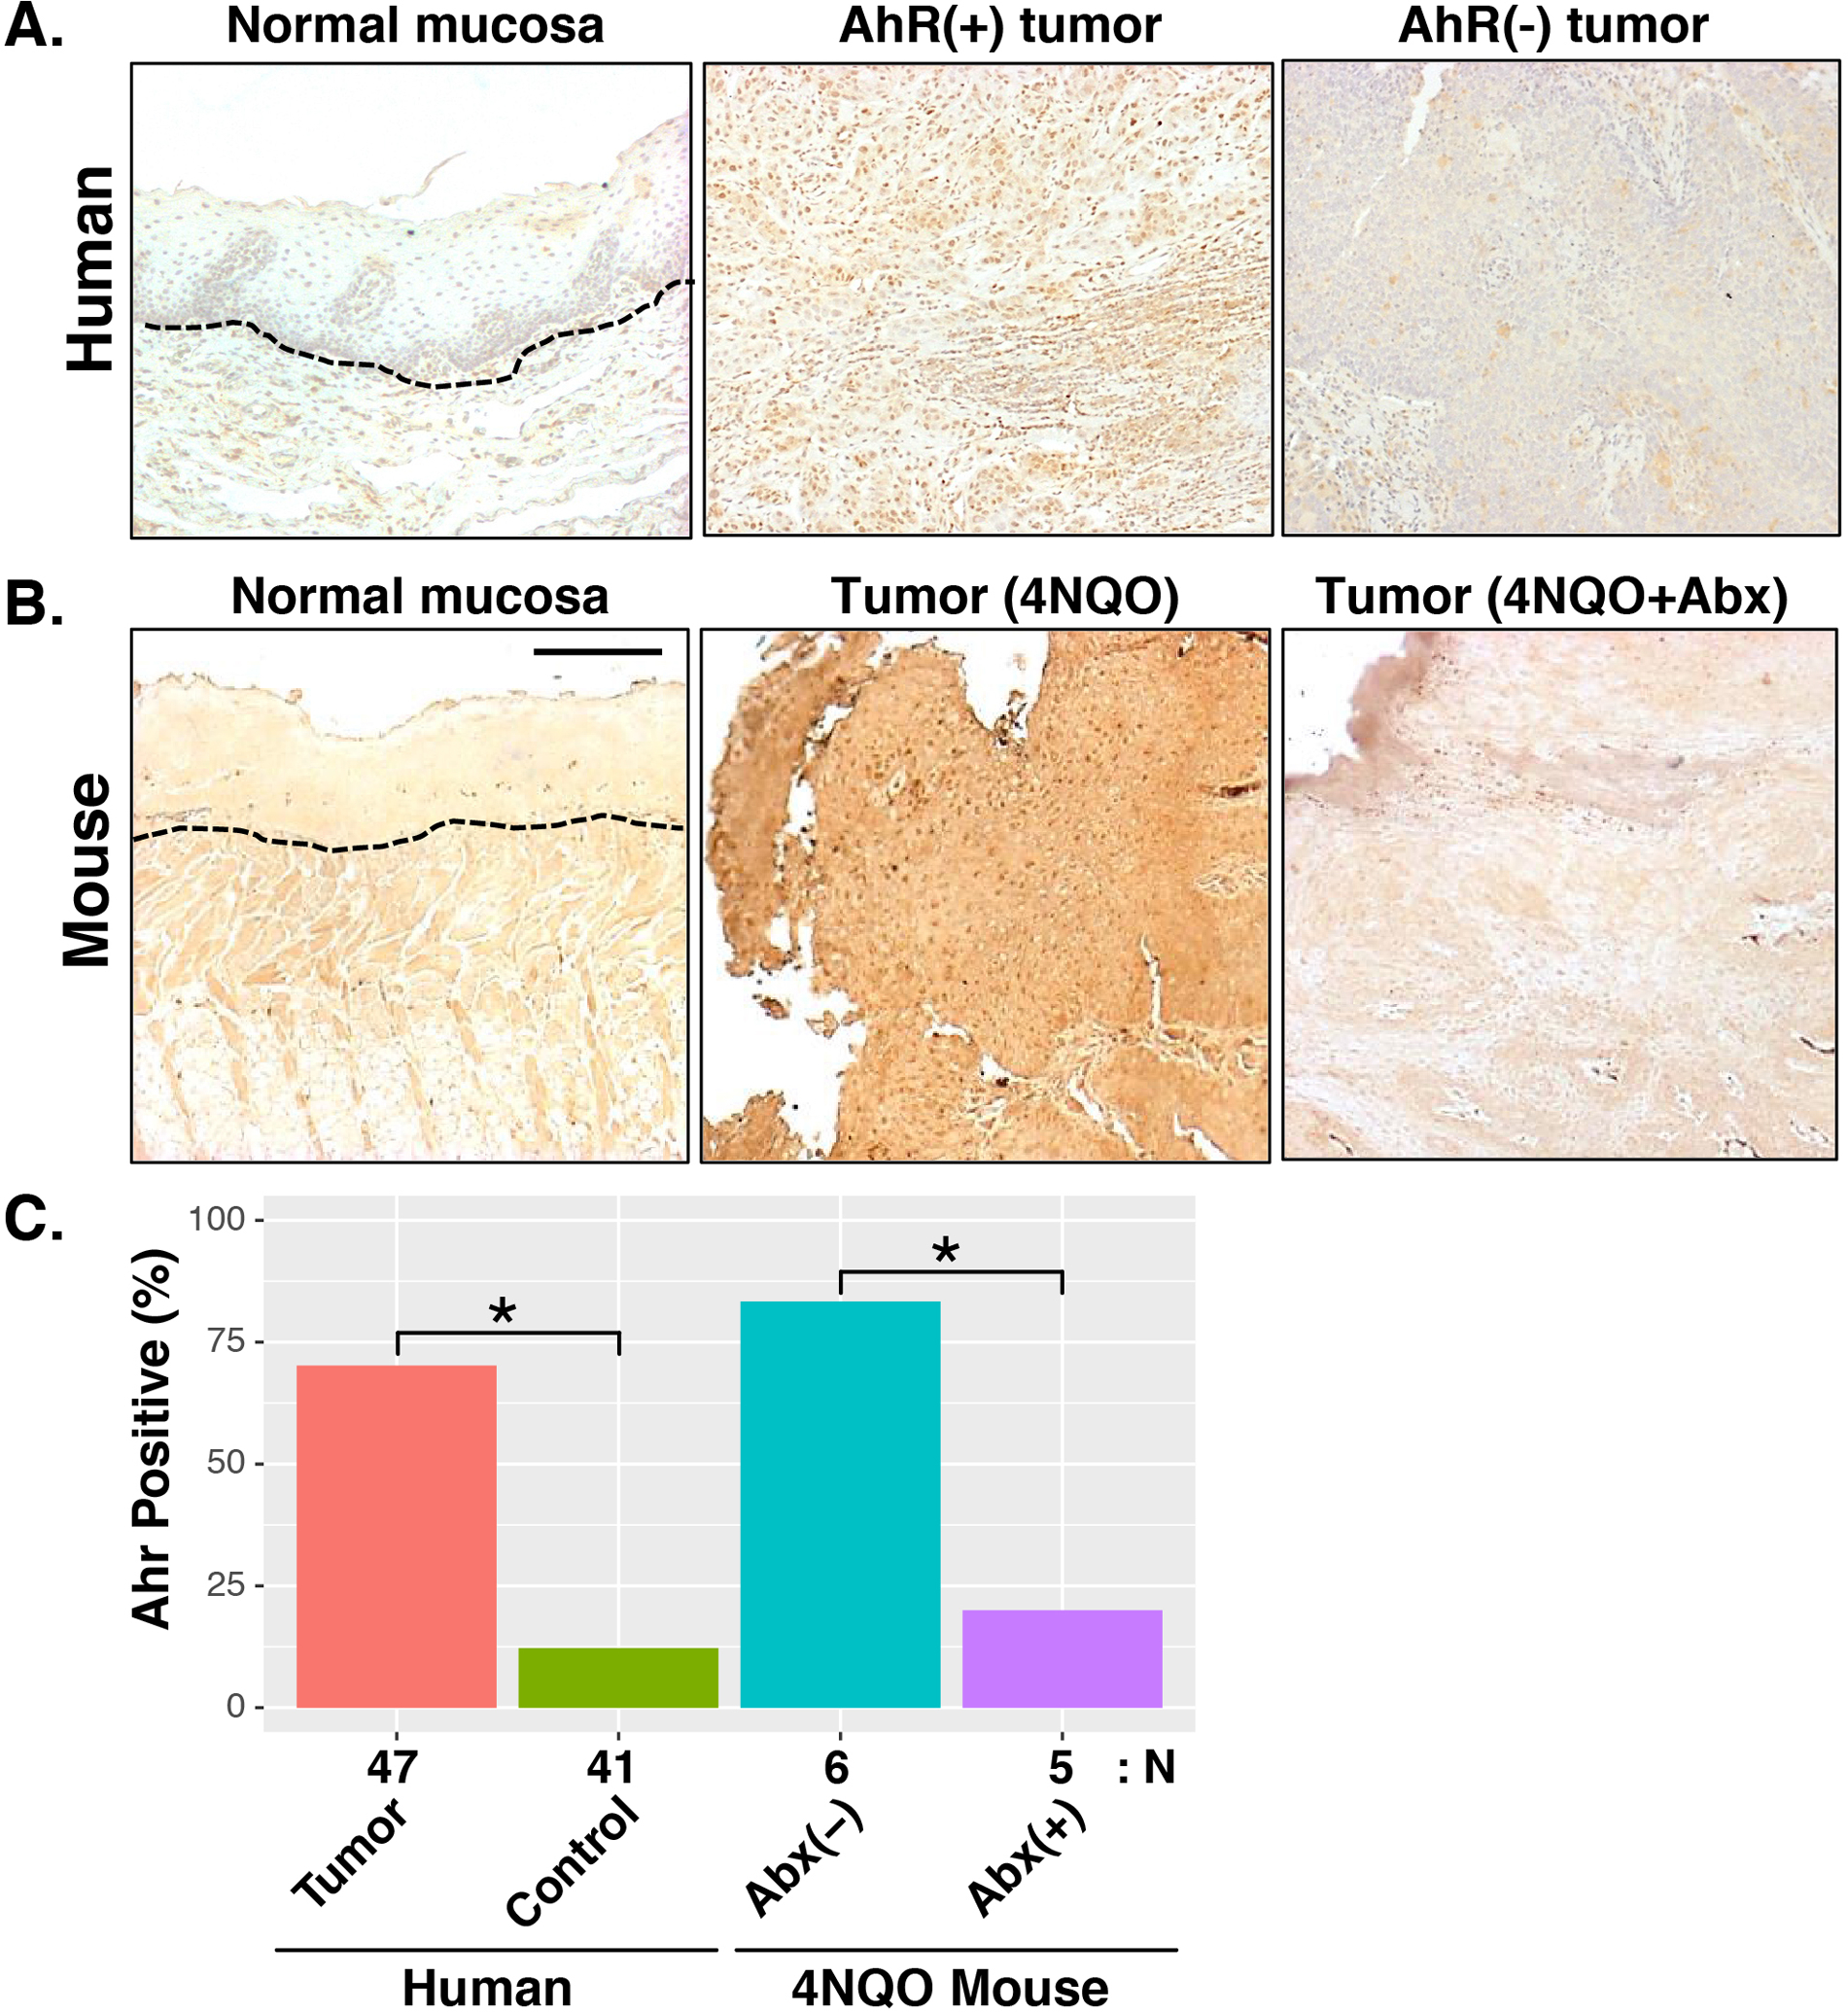
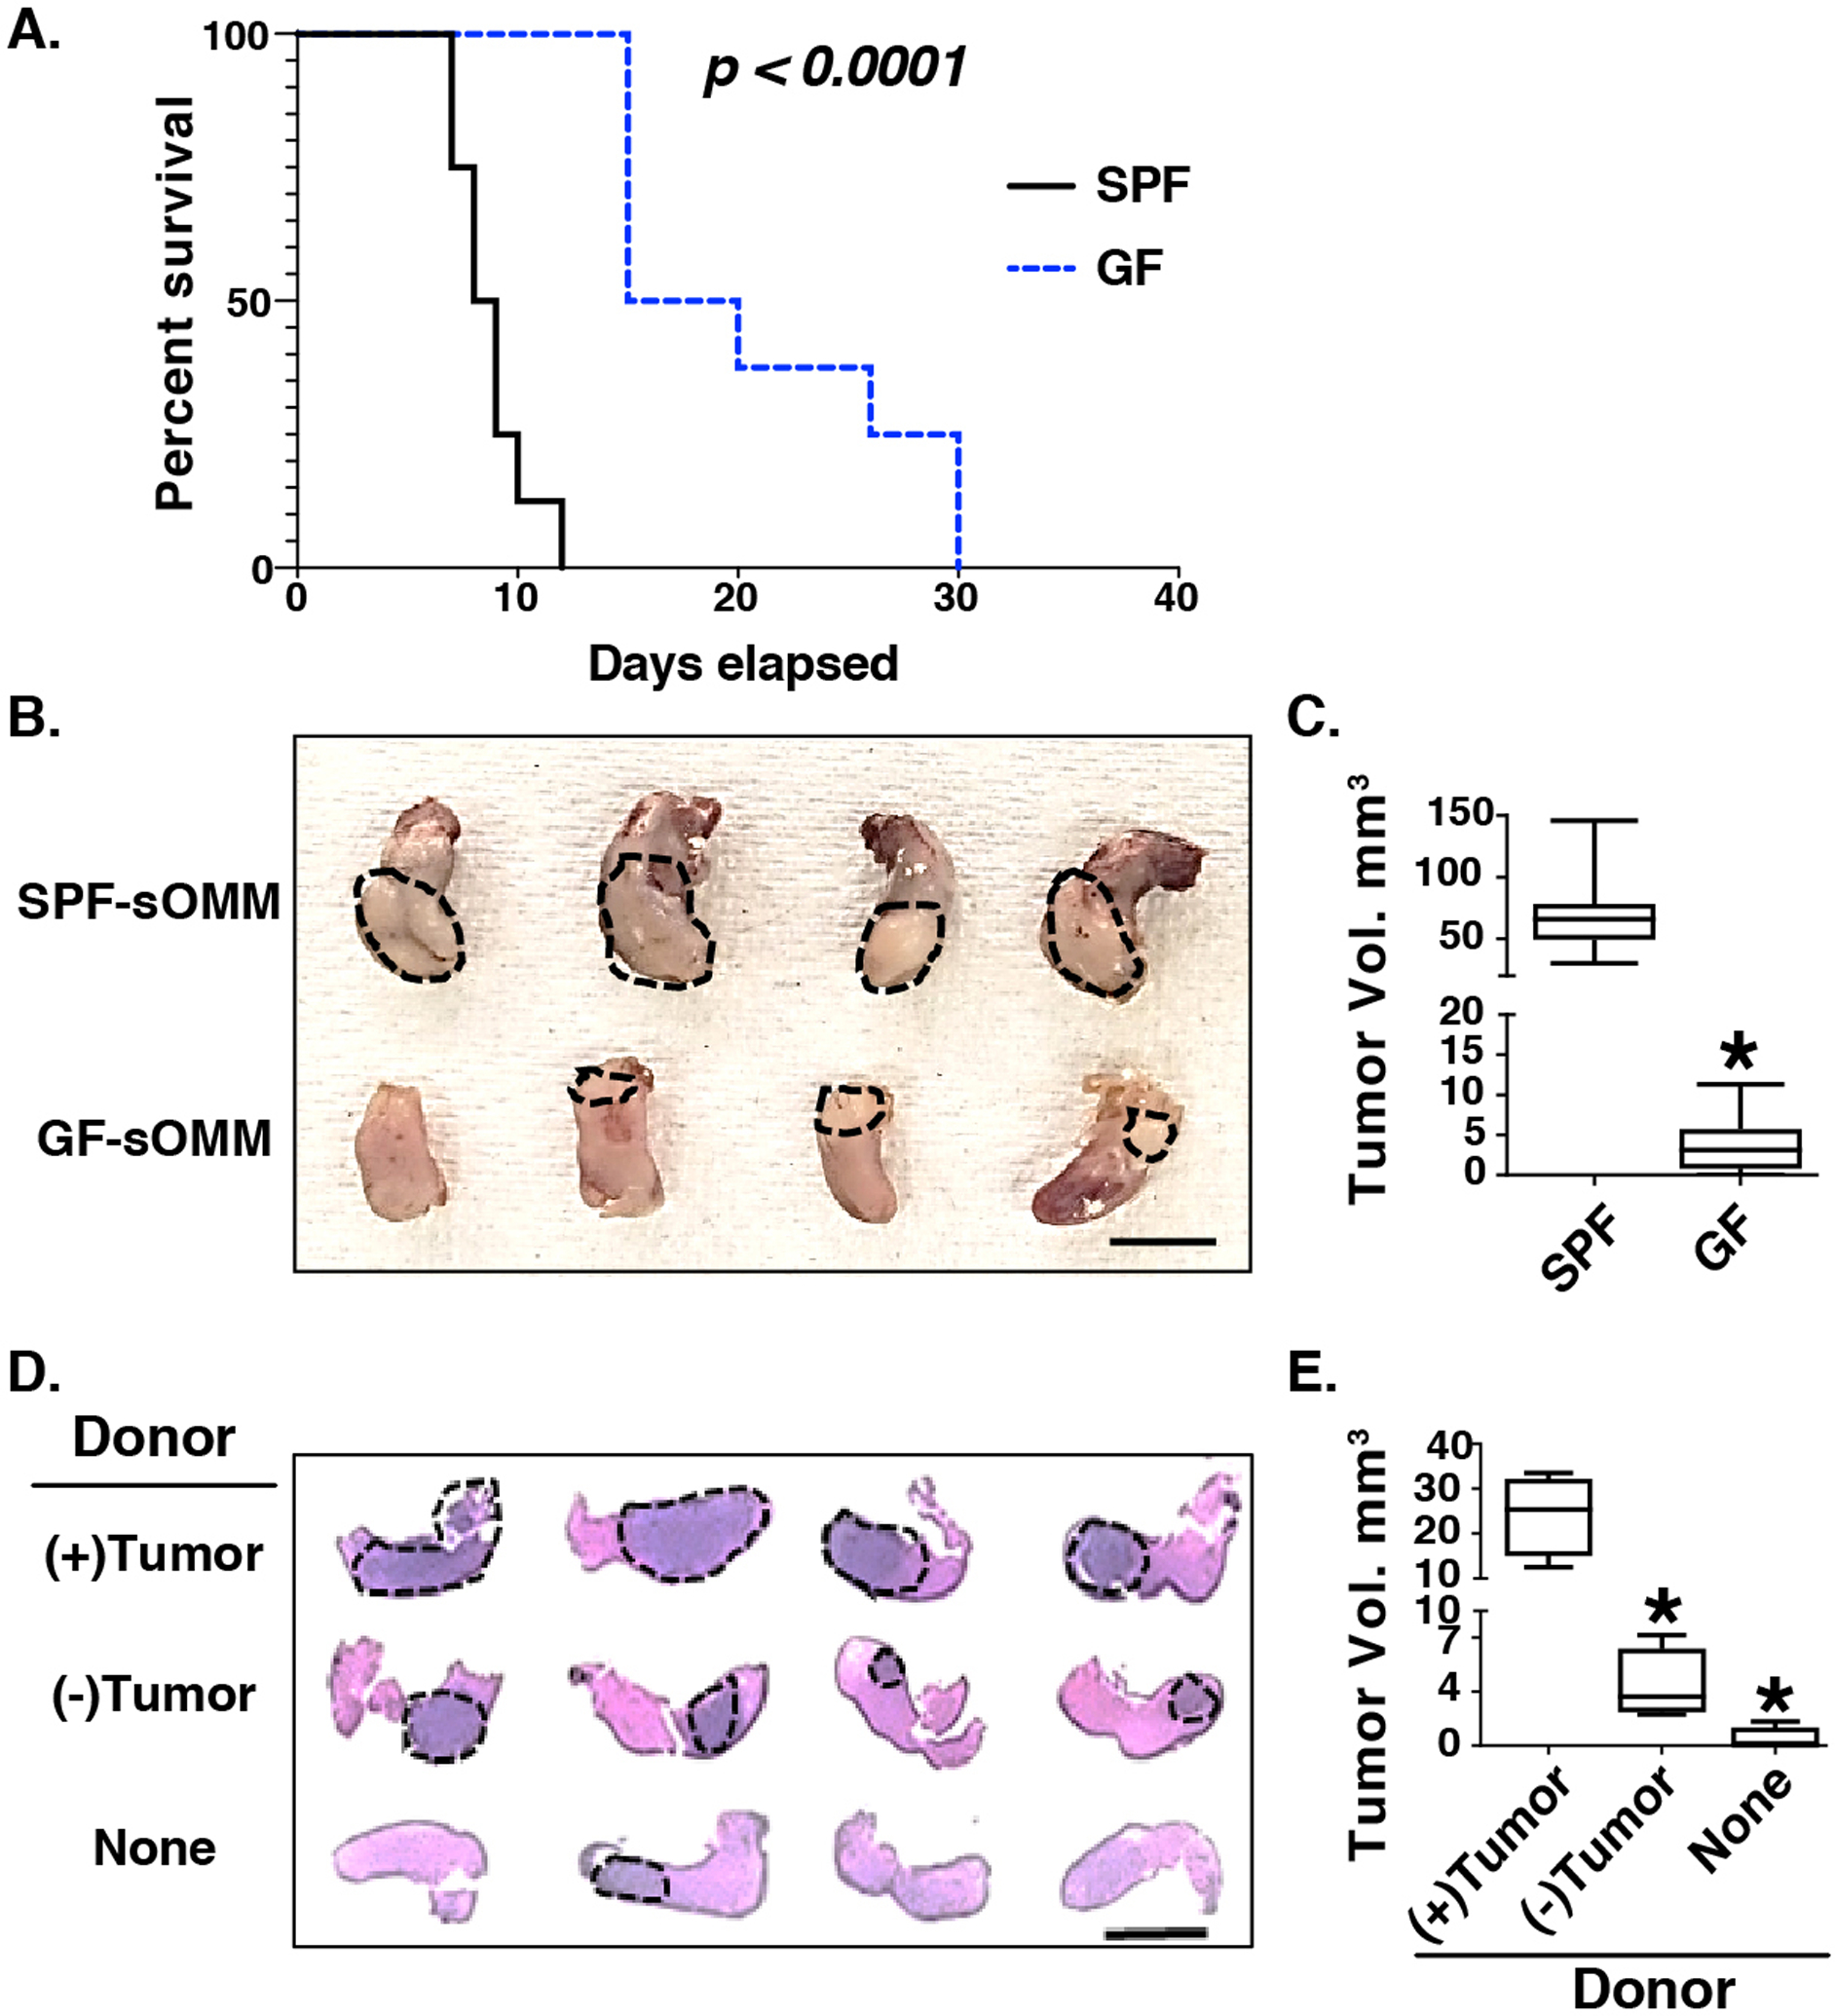
Recent studies have reported dysbiotic oral microbiota and tumor-resident bacteria in human head and neck squamous cell carcinoma (HNSCC). We aimed to identify and validate oral microbial signatures in treatment-naïve HNSCC patients compared with healthy control subjects. We confirm earlier reports that the relative abundances of Lactobacillus spp. and Neisseria spp. are elevated and diminished, respectively, in human HNSCC. In parallel, we examined the disease-modifying effects of microbiota in HNSCC, through both antibiotic depletion of microbiota in an induced HNSCC mouse model (4-Nitroquinoline 1-oxide, 4NQO) and reconstitution of tumor-associated microbiota in a germ-free orthotopic mouse model. We demonstrate that depletion of microbiota delays oral tumorigenesis, while microbiota transfer from mice with oral cancer accelerates tumorigenesis. Enrichment of Lactobacillus spp. was also observed in murine HNSCC, and activation of the aryl-hydrocarbon receptor was documented in both murine and human tumors. Together, our findings support the hypothesis that dysbiosis promotes HNSCC development.
© 2021. The Author(s), under exclusive licence to Springer Nature Limited.
Conflict of interest statement
Competing interests
The authors declare that the research was conducted in the absence of any commercial or financial relationships that could be construed as a potential conflict of interest.
Figures


Similar articles
-
Association of Oral Microbiome With Risk for Incident Head and Neck Squamous Cell Cancer.JAMA Oncol. 2018 Mar 1;4(3):358-365. doi: 10.1001/jamaoncol.2017.4777. JAMA Oncol. 2018. PMID: 29327043 Free PMC article.
-
Dysbiotic tumor microbiota associates with head and neck squamous cell carcinoma outcomes.Oral Oncol. 2022 Jan;124:105657. doi: 10.1016/j.oraloncology.2021.105657. Epub 2021 Dec 13. Oral Oncol. 2022. PMID: 34915261
-
Systematic review on oral microbial dysbiosis and its clinical associations with head and neck squamous cell carcinoma.Head Neck. 2023 Aug;45(8):2120-2135. doi: 10.1002/hed.27422. Epub 2023 May 30. Head Neck. 2023. PMID: 37249085 Review.
-
Microbial Communities Associated with Primary and Metastatic Head and Neck Squamous Cell Carcinoma - A High Fusobacterial and Low Streptococcal Signature.Sci Rep. 2017 Aug 30;7(1):9934. doi: 10.1038/s41598-017-09786-x. Sci Rep. 2017. PMID: 28855542 Free PMC article.
-
The intratumor microbiome varies by geographical location and anatomical site in head and neck squamous cell carcinoma.Curr Probl Cancer. 2024 Jun;50:101100. doi: 10.1016/j.currproblcancer.2024.101100. Epub 2024 May 30. Curr Probl Cancer. 2024. PMID: 38820649 Review.
Cited by
-
The Gut Microbiota Differ in Exclusively Breastfed and Formula-Fed United States Infants and are Associated with Growth Status.J Nutr. 2023 Sep;153(9):2612-2621. doi: 10.1016/j.tjnut.2023.07.009. Epub 2023 Jul 26. J Nutr. 2023. PMID: 37506974 Free PMC article.
-
The pan-cancer landscape of abnormal DNA methylation and intratumor microorganisms.Neoplasia. 2023 Mar;37:100882. doi: 10.1016/j.neo.2023.100882. Epub 2023 Feb 13. Neoplasia. 2023. PMID: 36791577 Free PMC article.
-
Oral-microbiome-derived signatures enable non-invasive diagnosis of laryngeal cancers.J Transl Med. 2023 Jul 5;21(1):438. doi: 10.1186/s12967-023-04285-2. J Transl Med. 2023. PMID: 37408030 Free PMC article.
-
Fusobacterium nucleatum outer membrane vesicles activate autophagy to promote oral cancer metastasis.J Adv Res. 2024 Feb;56:167-179. doi: 10.1016/j.jare.2023.04.002. Epub 2023 Apr 13. J Adv Res. 2024. PMID: 37059221 Free PMC article.
-
Is Short-Read 16S rRNA Sequencing of Oral Microbiome Sampling a Suitable Diagnostic Tool for Head and Neck Cancer?Pathogens. 2024 Sep 24;13(10):826. doi: 10.3390/pathogens13100826. Pathogens. 2024. PMID: 39452698 Free PMC article.
References
-
- Pfister DG, Spencer S, Adelstein D, Adkins D, Anzai Y, Brizel DM et al. Head and Neck Cancers, Version 2.2020, NCCN Clinical Practice Guidelines in Oncology. J Natl Compr Canc Netw 2020; 18: 873–898. - PubMed
-
- Chow LQM. Head and Neck Cancer. N Engl J Med 2020; 382: 60–72. - PubMed
-
- Parkin DM. The global health burden of infection-associated cancers in the year 2002. Int J Cancer 2006; 118: 3030–3044. - PubMed
-
- Blaser MJ. Understanding microbe-induced cancers. Cancer Prev Res (Phila) 2008; 1: 15–20. - PubMed
MeSH terms
Substances
Grants and funding
LinkOut - more resources
Full Text Sources
Medical
Miscellaneous
