. 2022 Feb 7;32(3):614-630.e5.
doi: 10.1016/j.cub.2021.12.012. Epub 2022 Jan 25.

Acetylated α-tubulin K394 regulates microtubule stability to shape the growth of axon terminals

Affiliations

Acetylated α-tubulin K394 regulates microtubule stability to shape the growth of axon terminals

Harriet A J Saunders et al. Curr Biol. .

Abstract

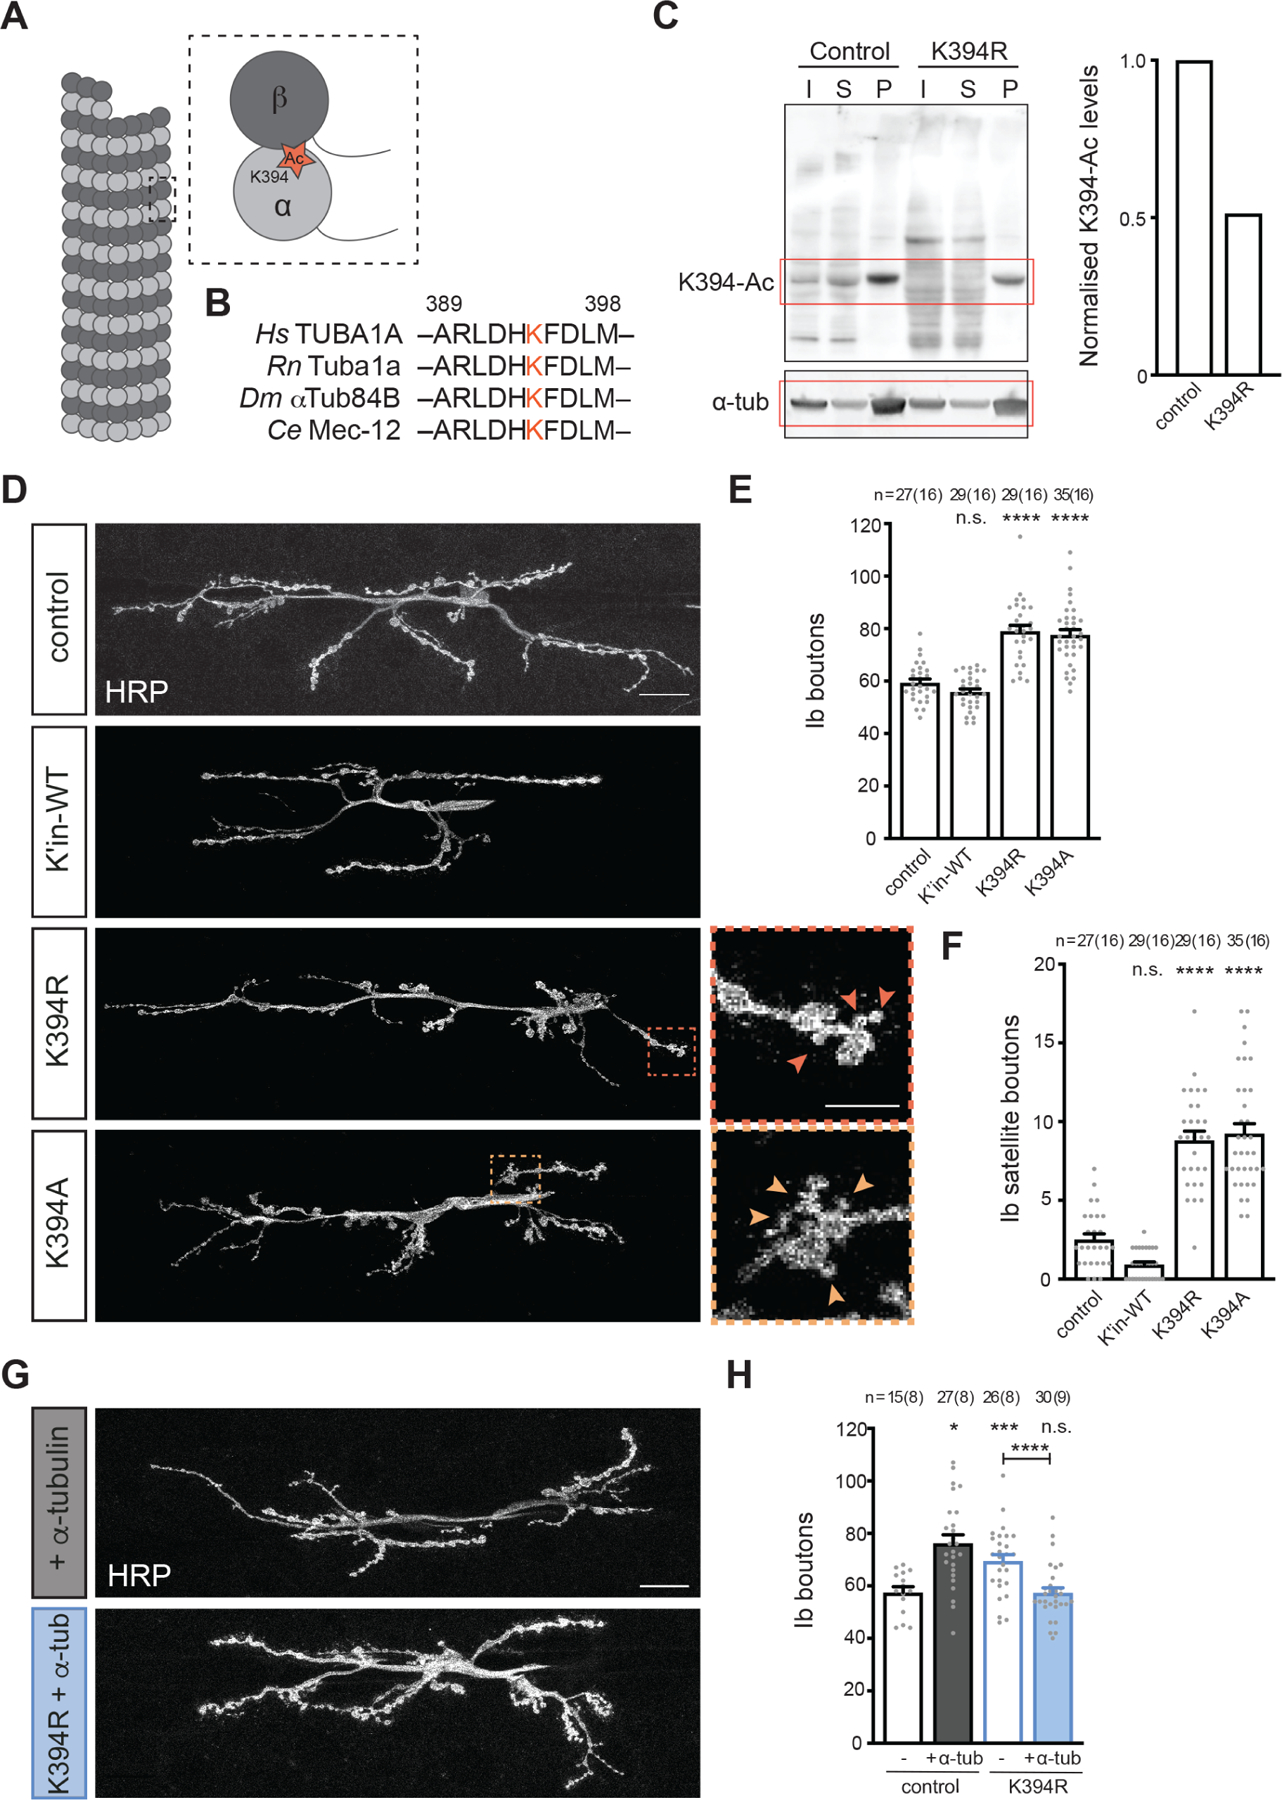
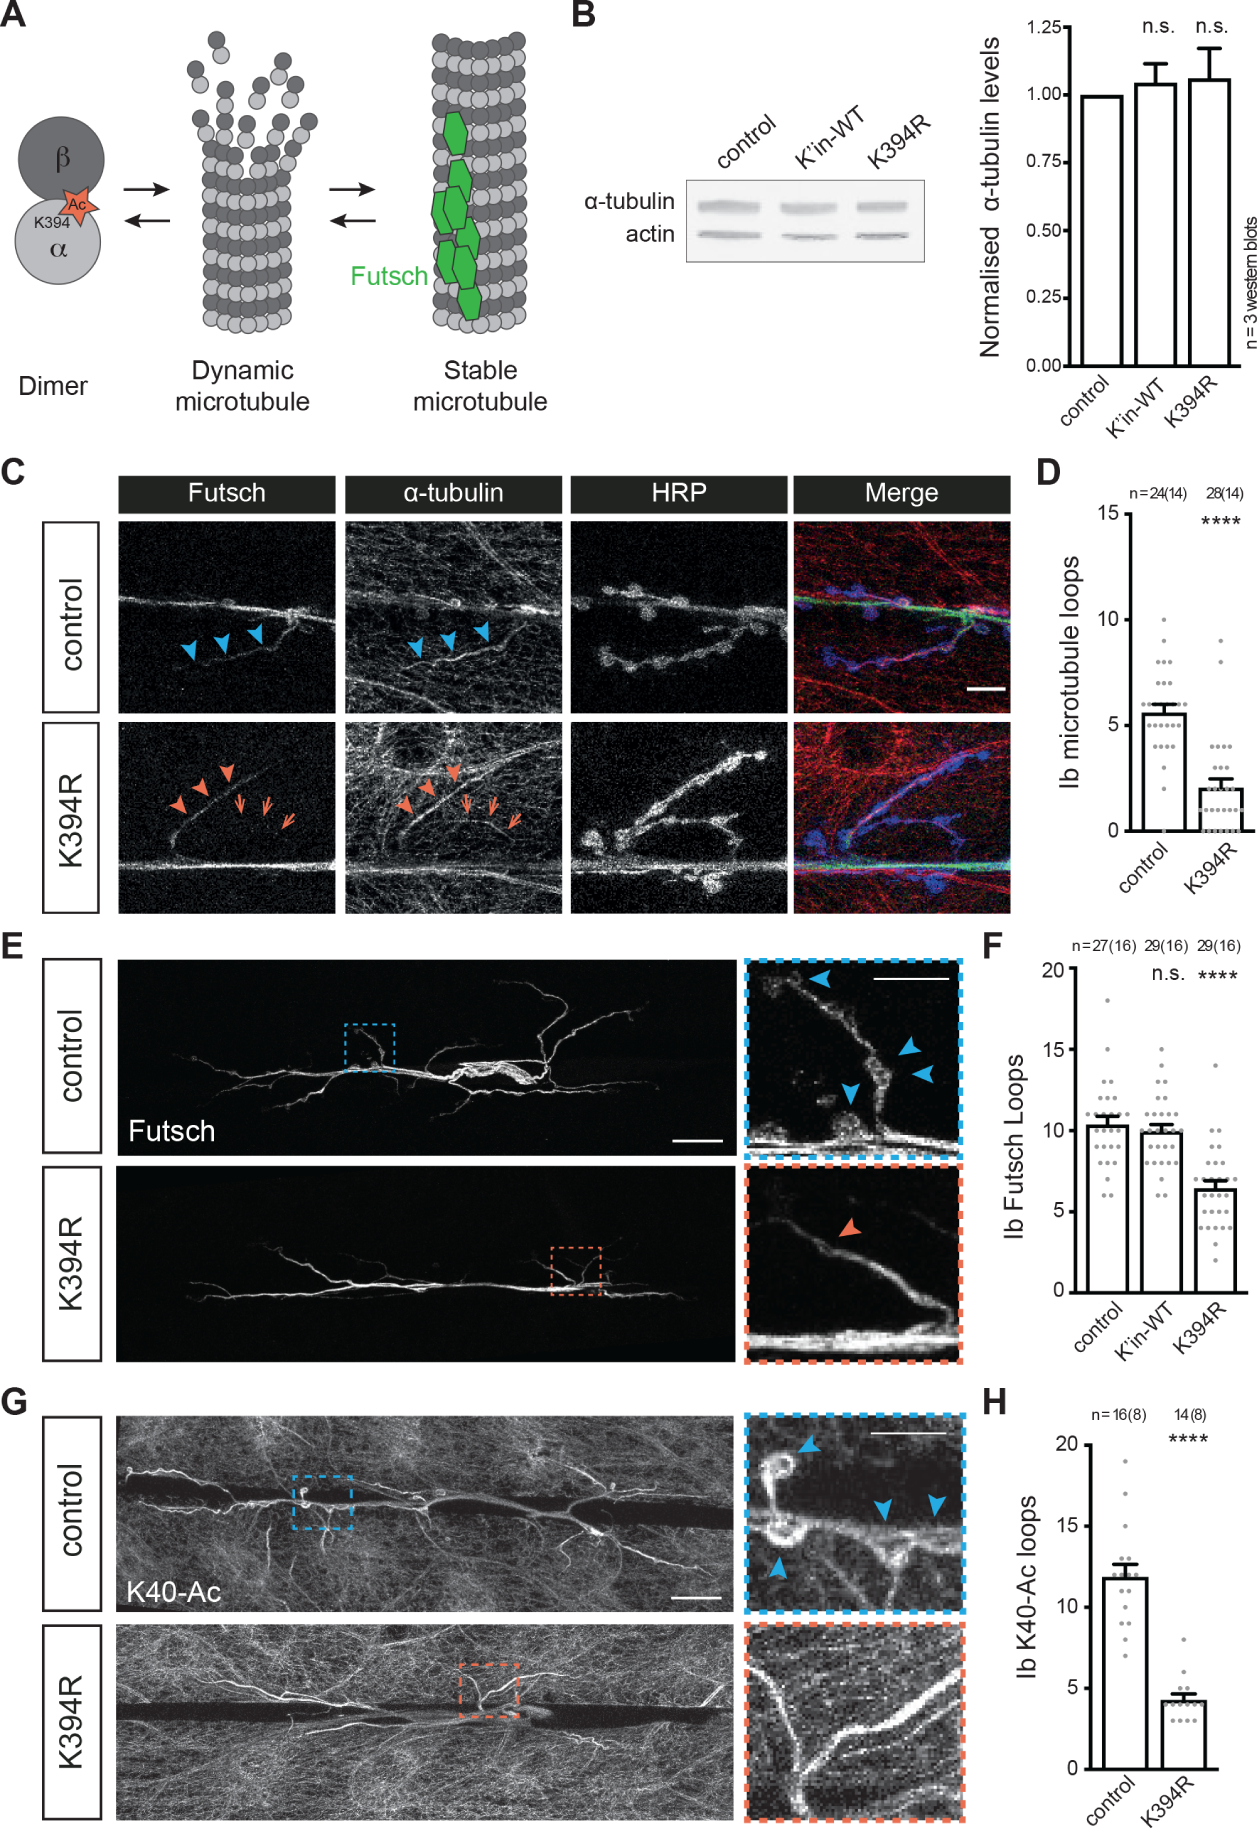
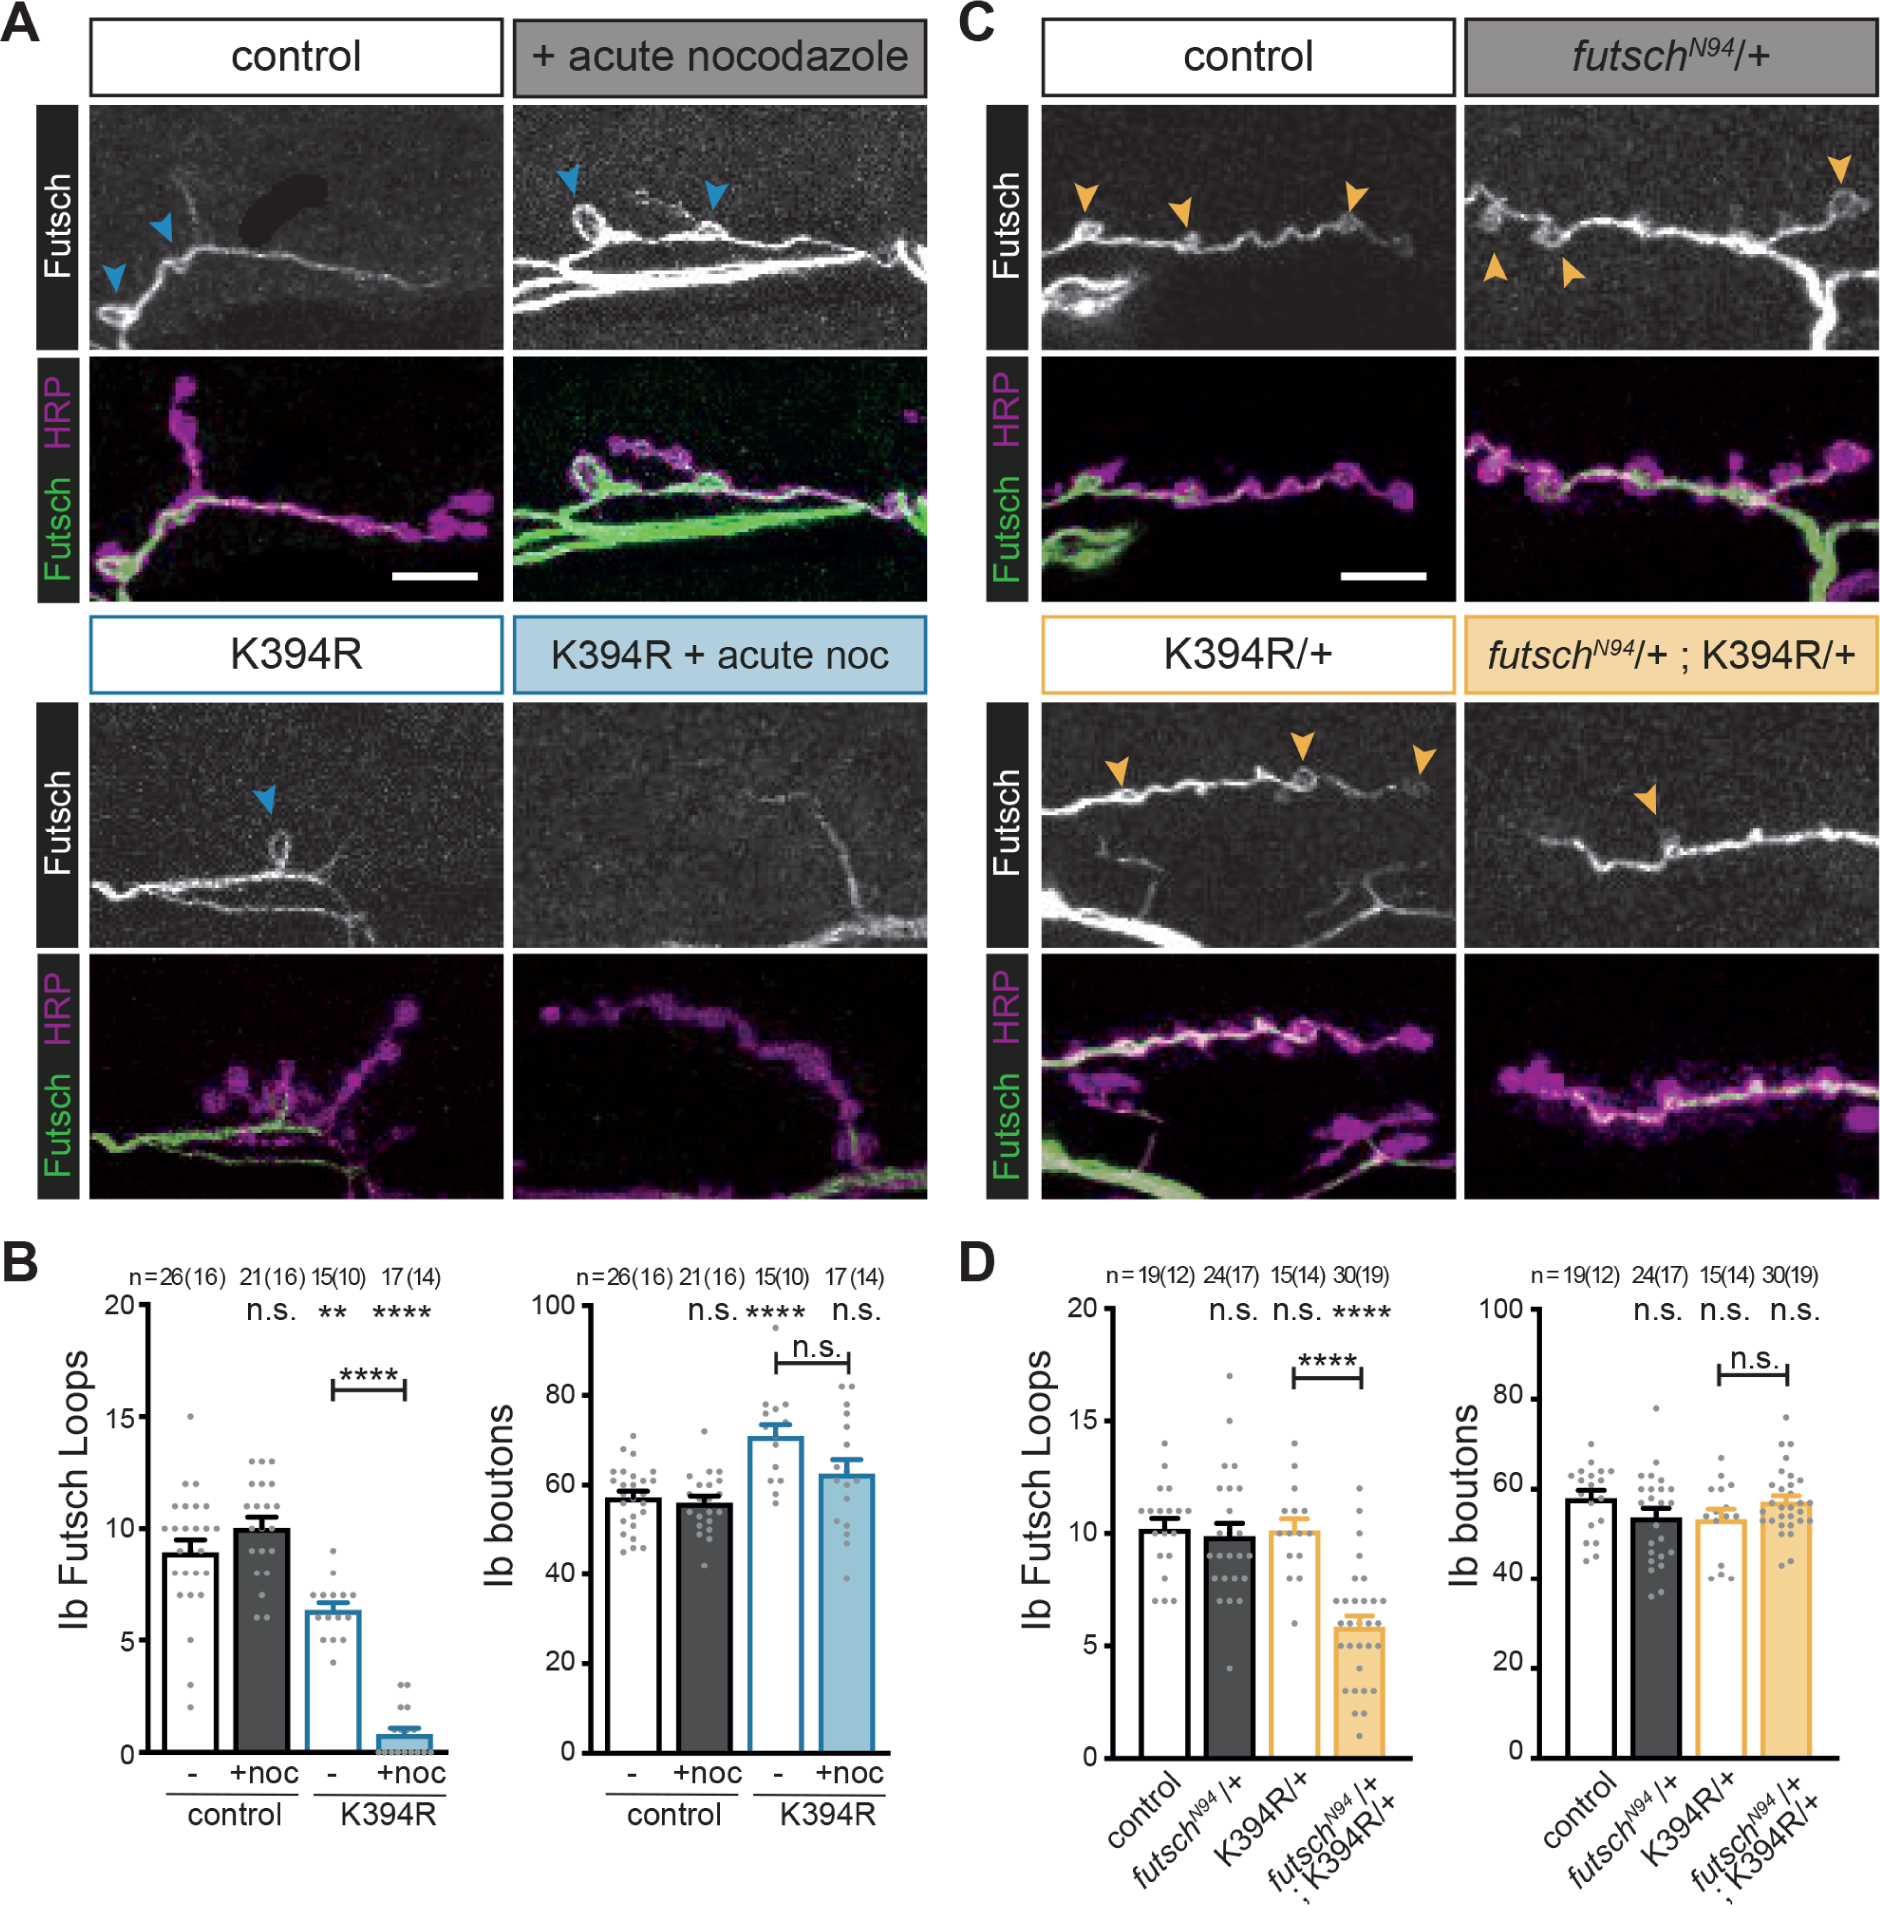
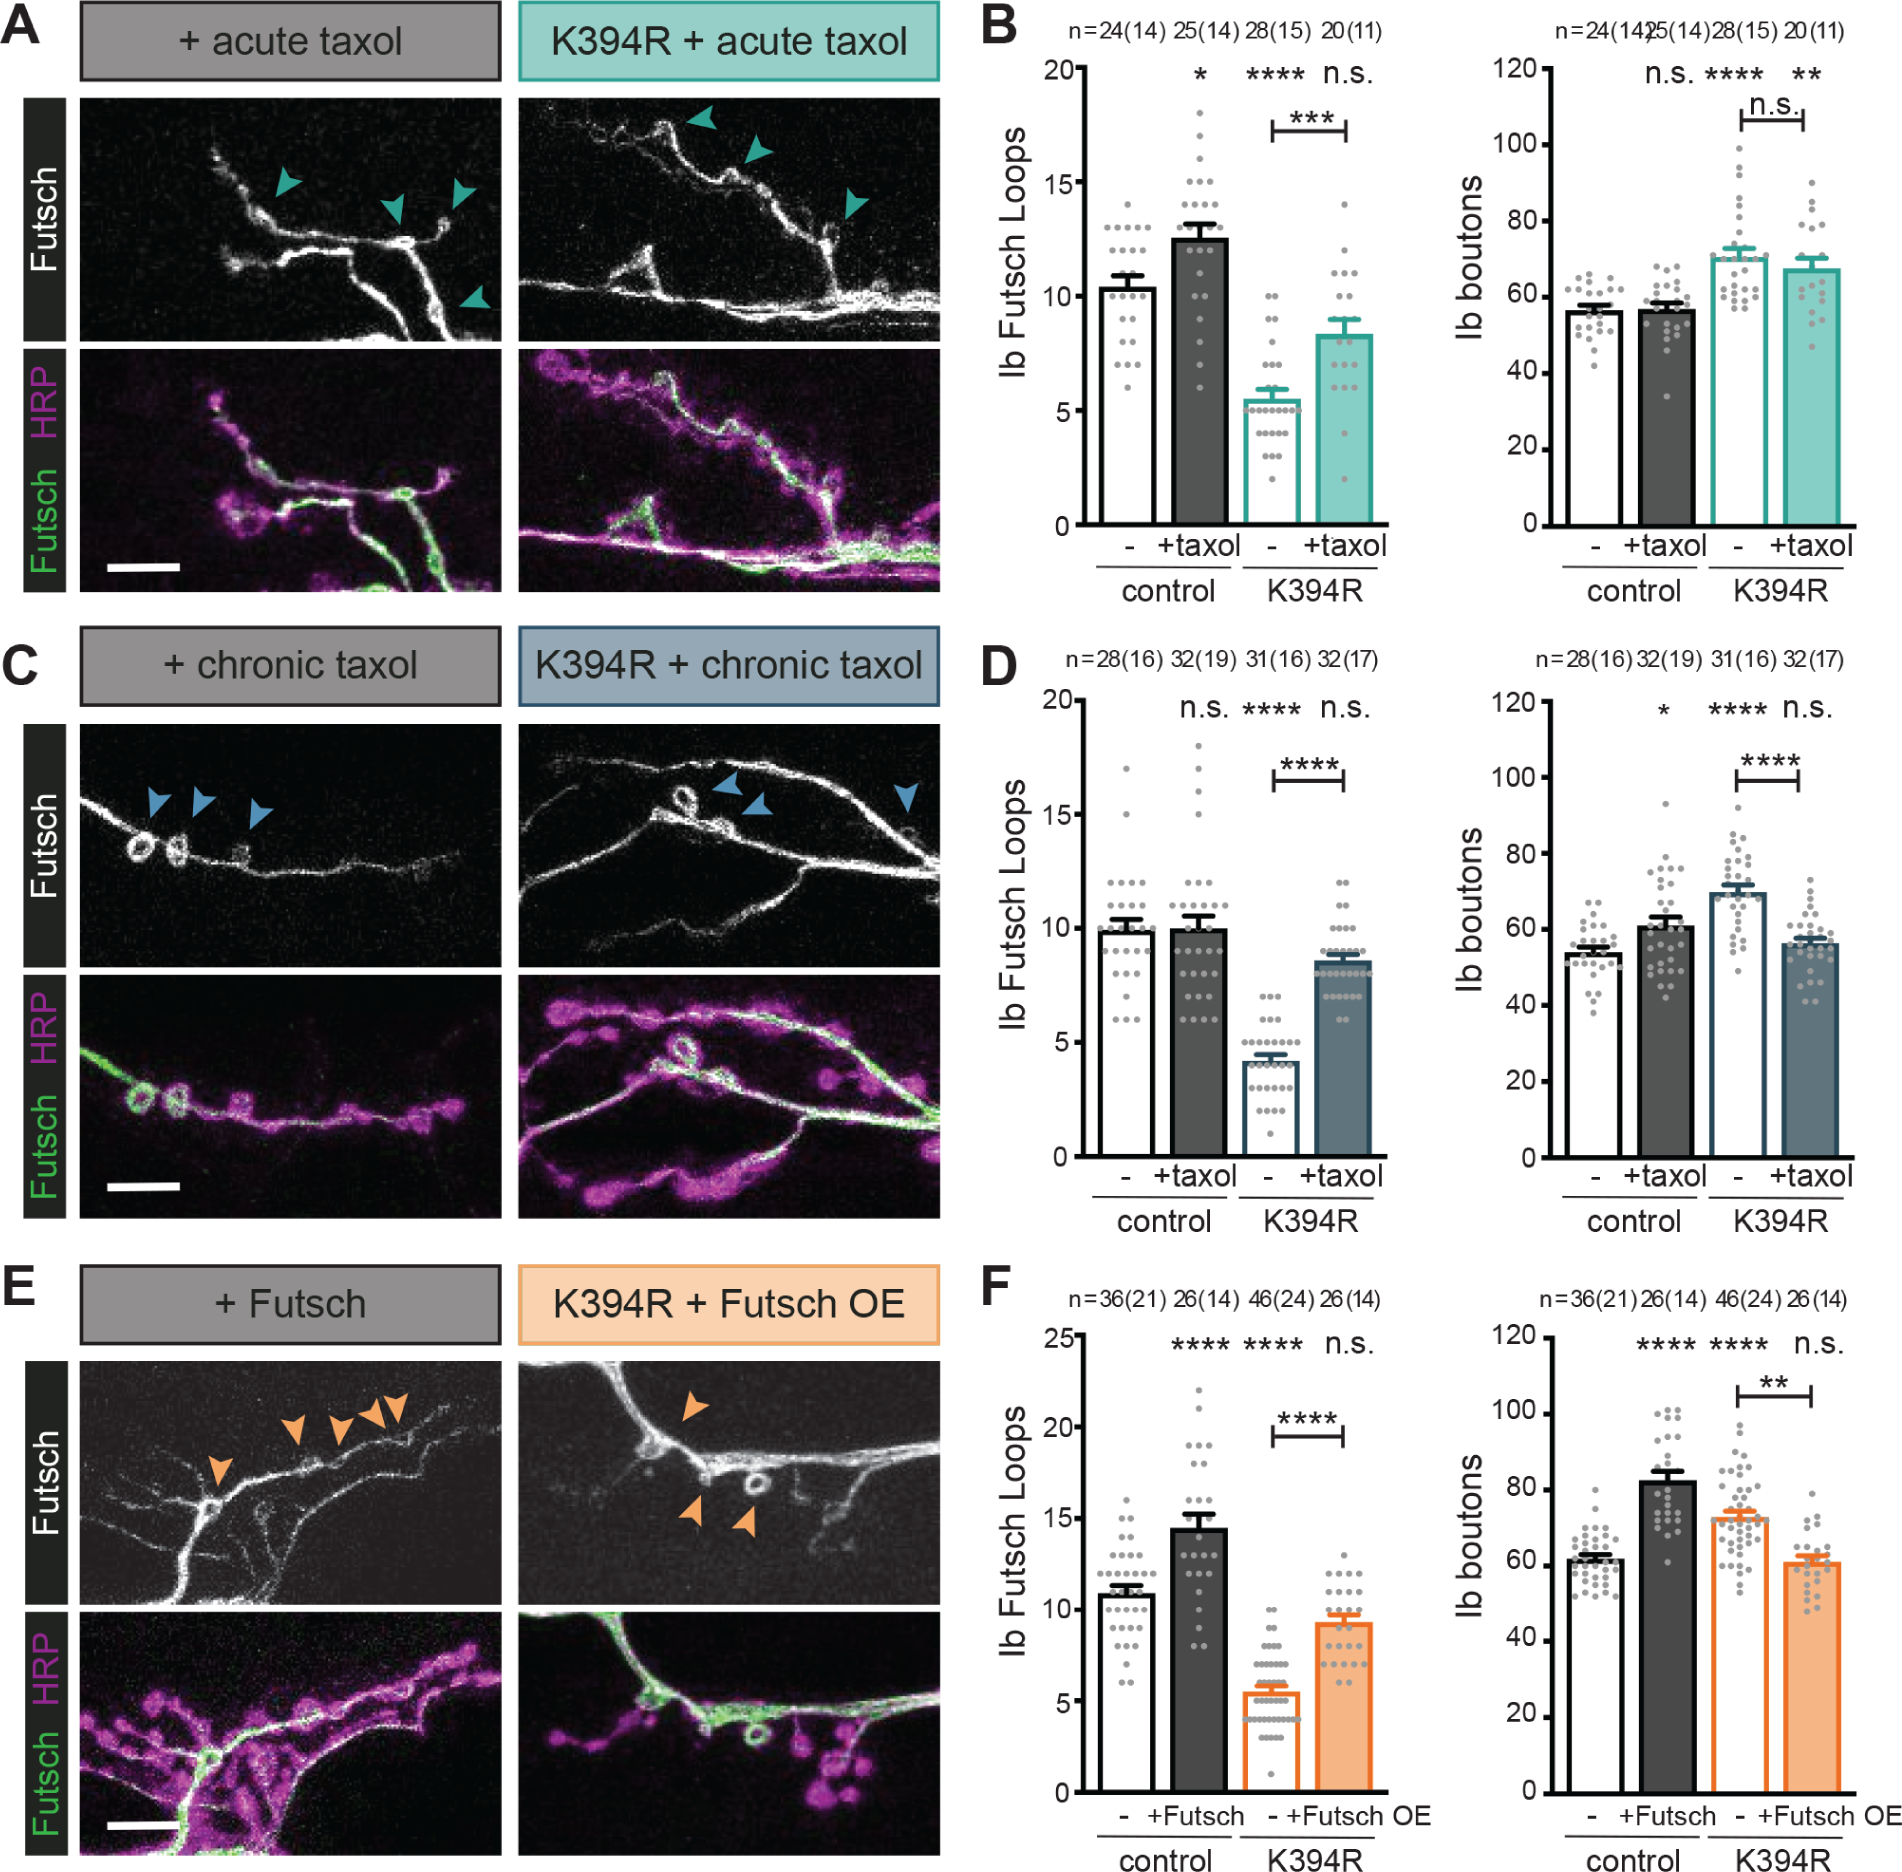
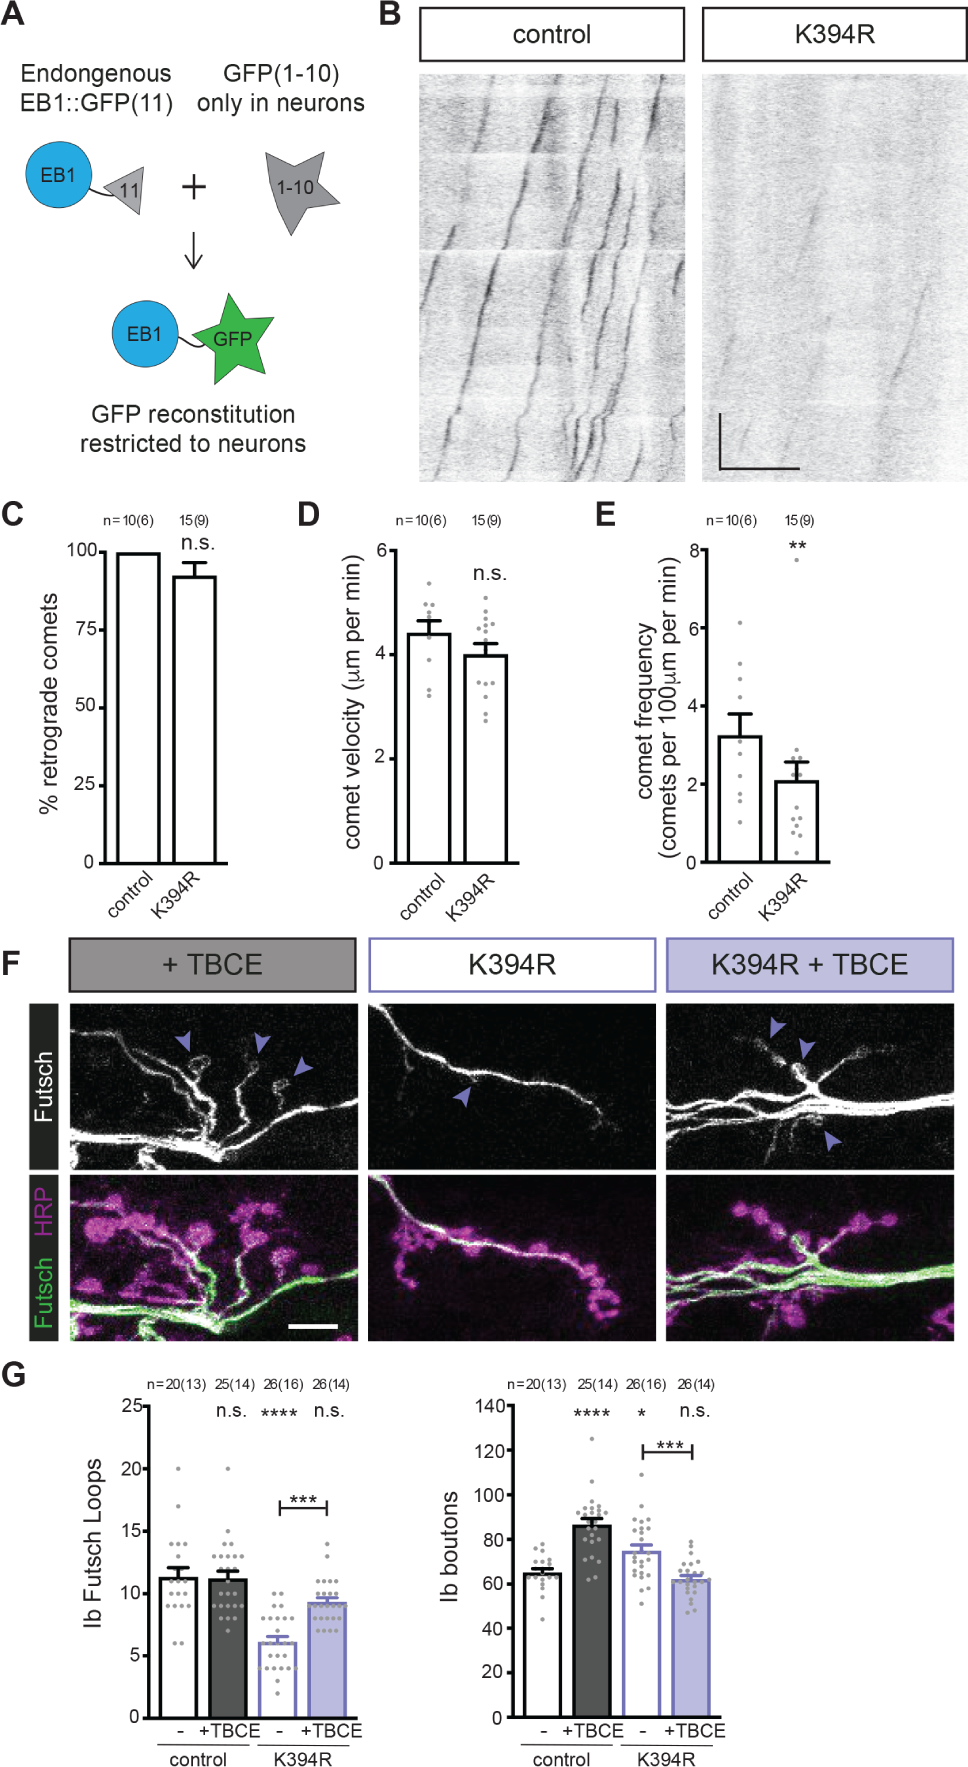
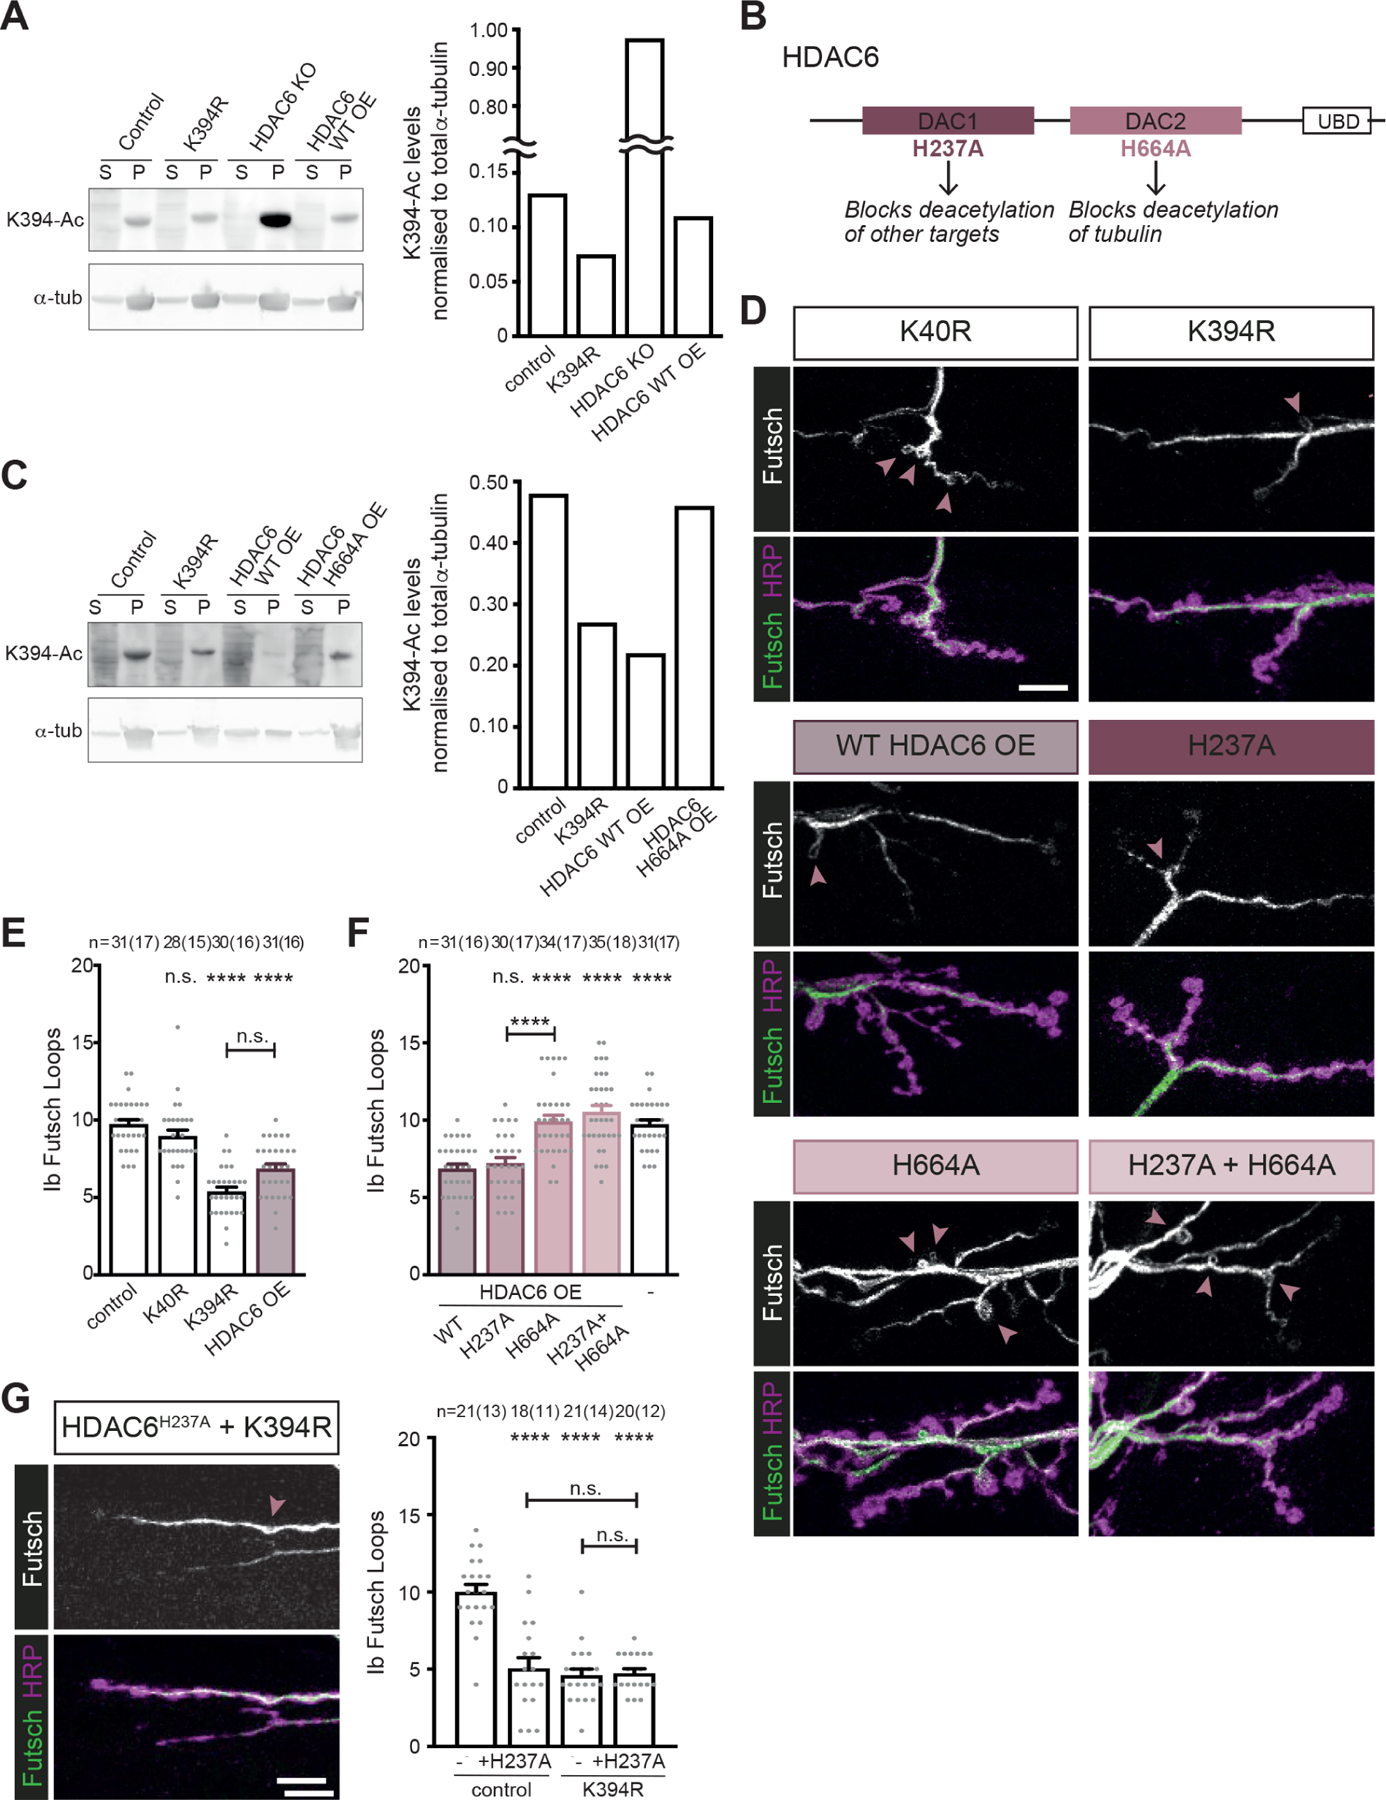
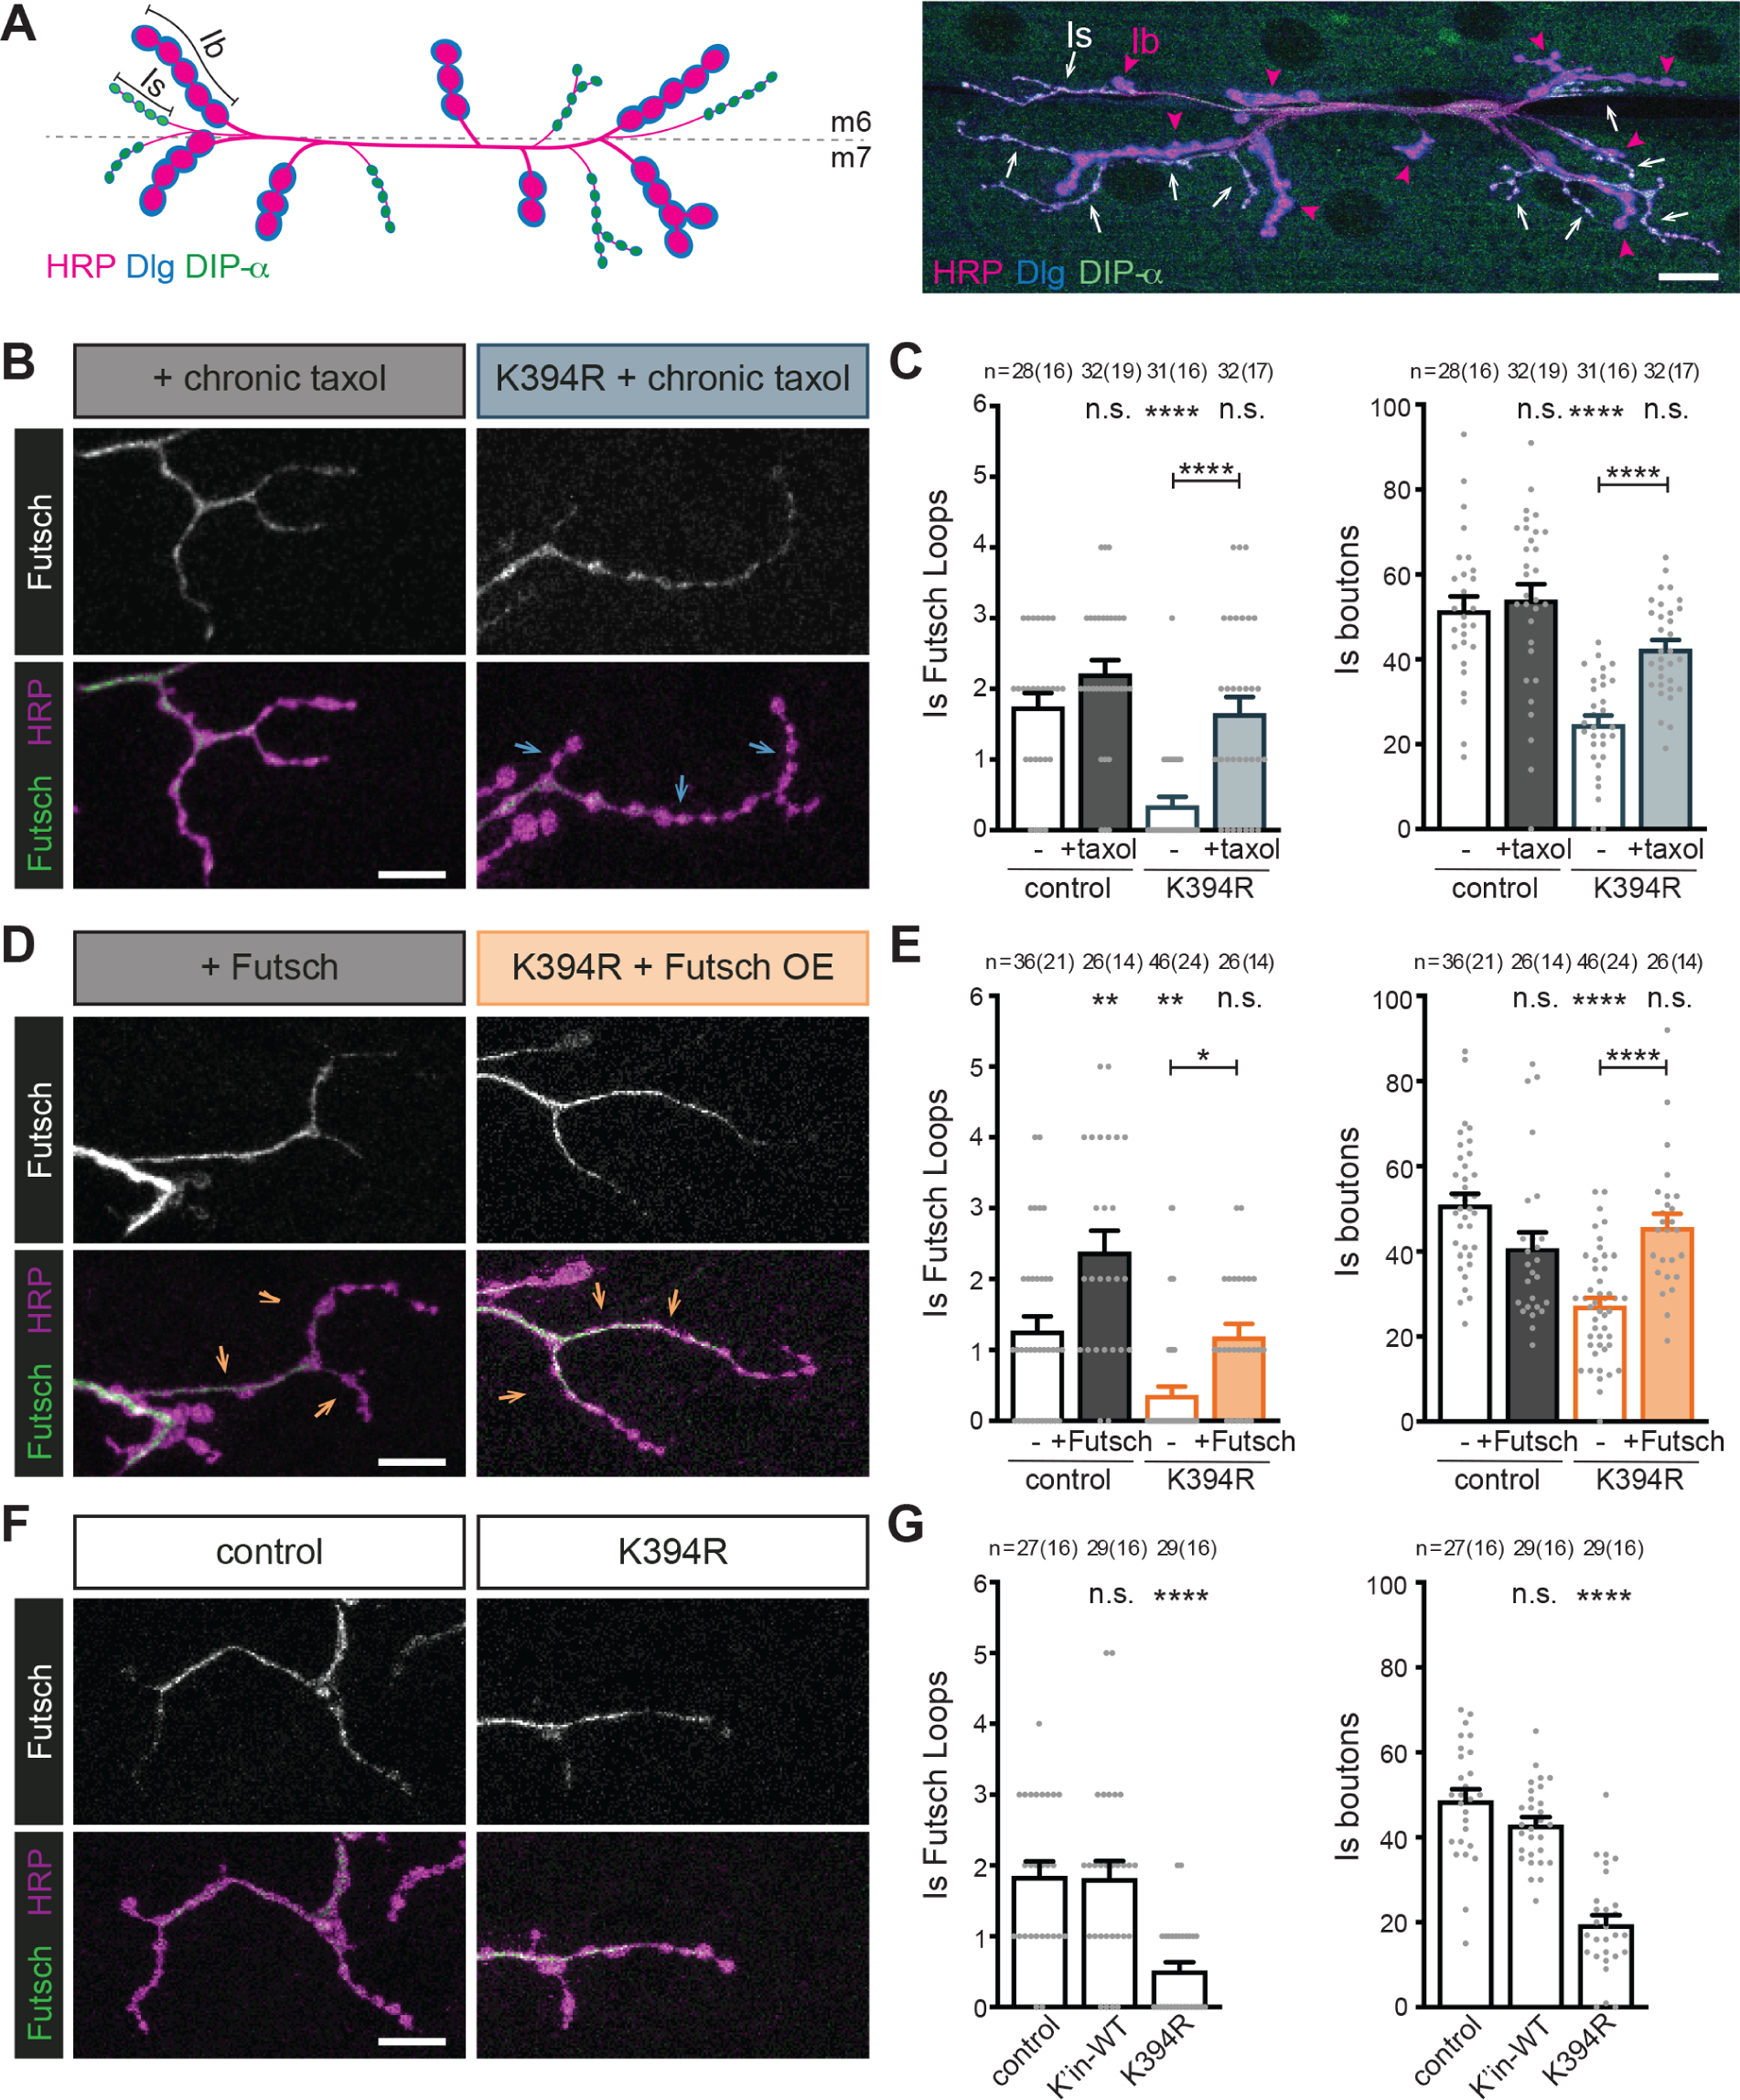
Microtubules are essential to neuron shape and function. Acetylation of tubulin has the potential to directly tune the behavior and function of microtubules in cells. Although proteomic studies have identified several acetylation sites in α-tubulin, the effects of acetylation at these sites remains largely unknown. This includes the highly conserved residue lysine 394 (K394), which is located at the αβ-tubulin dimer interface. Using a fly model, we show that α-tubulin K394 is acetylated in the nervous system and is an essential residue. We found that an acetylation-blocking mutation in endogenous α-tubulin, K394R, perturbs the synaptic morphogenesis of motoneurons and reduces microtubule stability. Intriguingly, the K394R mutation has opposite effects on the growth of two functionally and morphologically distinct motoneurons, revealing neuron-type-specific responses when microtubule stability is altered. Eliminating the deacetylase HDAC6 increases K394 acetylation, and the over-expression of HDAC6 reduces microtubule stability similar to the K394R mutant. Thus, our findings implicate α-tubulin K394 and its acetylation in the regulation of microtubule stability and suggest that HDAC6 regulates K394 acetylation during synaptic morphogenesis.

Keywords: Drosophila; acetylation; cytoskeleton; microtubule; neuron; synaptic morphogenesis.


Conflict of interest statement

Declaration of interests The authors declare no competing interests.

Figures

Figure 1.
Figure 1.. Mutating conserved α-tubulin K394 to block acetylation disrupts synaptic morphogenesis
In this and subsequent figures, images are of synaptic terminals at m6/7 in 3rd instar larvae, and quantification is per m6/7, unless otherwise noted. All genotypes are homozygous for wild-type or mutant αTub84B alleles. (A) Cartoon showing the position of K394 at the αβ-heterodimer interface. (B) K394 (red) is conserved between humans, rats, flies and worms. This peptide sequence was used to create the anti-Ac-K394 antibody. (C) Western blot analysis (left) and quantification (right) of K394 acetylation and total α-tubulin levels in control and K394R mutant fly head lysate. The anti-Ac-K394 signal in the tubulin pellet lane is normalised to total α-tubulin and represented as a fraction of the control values. α-tubulin migrates at ~50 kDa (red box). I=input, S=supernatant, P=pellet. (D) Representative images of synaptic terminals in control and mutant animals. K394A mutants die as pupae, and K394R mutants are homozygous viable. Dashed-outline boxes: zoomed-in views to highlight ectopic satellite boutons (arrowheads). Scale bars: 25 μm and 10 μm (dashed-outline boxes). A neuronal membrane marker (HRP) illuminates the synaptic terminals. (E and F) Quantification of total type Ib boutons (E) and satellite boutons (F) in control larvae and larvae in which wild-type (WT) or mutant alleles of tubulin were knocked into endogenous αTub84B. p-values: p=0.53, control v. wild-type αTub84B knock-in (K’in-WT); p<0.000001, control v. K394R; p<0.000001, control v. K394A (E). p-values: p=0.13, control v. K’in-WT; p<0.000001, control v. K394R; p<0.000001, control v. K394A (F). See also Figure S1 for quantification of bouton size in control and mutant animals. (G and H) Neuronal over-expression of wild-type αTub84B (+α-tubulin) suppresses type Ib bouton overgrowth in K394R mutants. Representative images (G) and quantification (H). One copy each of OK6-Gal4 and UAS-αTub84B were used to over-express α-tubulin. p-values: p=0.023, control v. +α-tubulin; p=0.0001, control v. K394R; p=1.0, control v. K394R +α-tubulin; p=0.000002, K394R v. K394R +α-tubulin (H). Quantification: One-way ANOVA with post-hoc Tukey. All data are mean ± SEM. n.s=non-significant; *p=0.01–0.05; ***p=0.001–0.0001; ****p<0.0001.
Figure 2.
Figure 2.. The acetylation-blocking K394R mutation does not affect tubulin levels or microtubule formation but decreases stable microtubules
All genotypes are homozygous for wild-type or mutant αTub84B alleles. (A) Schematic illustrating free tubulin dimer and two microtubule populations, dynamic and stable. Stable microtubules are bound by Futsch (green hexagons). (B) Western blot analysis (top) and quantification (bottom) of α-tubulin levels (DM1α) in control, WT αTub84B knock-in, and K394R mutant lysate. DM1α signal is normalised to actin and represented as a fraction of the control values. p-values: p=0.98, control v. K’in-WT; p=0.95, control v. K394R. (C and D) Representative images (C) of control and K394R synaptic terminals stained for α-tubulin (DM1α), Futsch, and a neuronal membrane marker (HRP), and the quantification (D) of microtubule loops in type Ib boutons. Arrowheads: Futsch labelled microtubule bundle; arrows: a microtubule branch lacking Futsch in the K394R mutant (C). p-value: p<0.000001, control v. K394R (D). (E and F) Representative images (E) of synaptic terminals stained for Futsch, which marks stable microtubules, and the quantification (F) of Futsch-positive microtubule loops (“Futsch loops”) in type Ib boutons in indicated genotypes. Dashed-outline boxes: zoomed-in views to highlight Futsch loops (arrowheads), which are decreased in K394R mutants. Scale bars: 25 μm and 10 μm (dashed-outline boxes). p-values: p=0.91, control v. K’in-WT; p<0.000001, control v. K394R (F). See also Figure S2. (G and H) Representative images (G) of control and K394R synaptic terminals stained for α-tubulin acetylated at K40 (6–11B-1), and the quantification (H) of acetylated-K40-positive microtubule loops (arrowheads) in type Ib boutons. Dashed-outline boxes: zoomed-in views to highlight microtubule loops (arrowheads). Scale bars: 25 μm and 10 μm (dashed-outline boxes). p-value: p<0.00001, control v. K394R (H). Scale bar: 10 μm. Quantification: One-way ANOVA with post-hoc Tukey (B and F) and Student’s unpaired t-test (D and H). All data are mean ± SEM. n.s=non-significant; ****p<0.0001.
Figure 3.
Figure 3.. The K394R mutation enhances sensitivity to nocodazole and decreased futsch.
Larval fillets stained for stable microtubules (Futsch) and a neuronal membrane marker (HRP). Genotypes are homozygous for wild-type or mutant αTub84B alleles except where indicated. Arrowheads: Futsch loops in type Ib boutons. Futsch loops and type Ib boutons were quantified for genotype and treatment as indicated. Scale bar: 10 μm. (A and B) Representative images (A) and quantification (B) of control and K394R mutant larvae treated with 30 μM nocodazole for 1 hour prior to fixation. p-values, Ib Futsch loops: p=0.30, control v. +nocodazole; p=0.0013, control v. K394R; p<0.000001, control v. K394R +nocodazole; p<0.000001, K394R v. K394R +nocodazole (B, left). p-values, Ib boutons: p=0.97, control v. +nocodazole; p<0.000001, control v. K394R; p=0.24, control v. K394R +nocodazole; p=0.052, K394R v. K394R +nocodazole (B, right). (C and D) Representative images (C) and quantification (D) of control, futschN94/+, K394R/+, and futschN94/+ K394R/+ double mutant. futschN94 is a hypomorphic futsch allele. p-values, Ib Futsch loops: p=0.97, control v. futschN94/+; p=1.0, control v. K394R/+; p<0.000001, control v. futschN94/+; K394R/+; p=0.000003, K394R/+ v. futschN94/+ K394R/+ double mutant (D, left). p-values, Ib boutons: p=0.35, control v. futschN94/+; p=0.39, control v. K394R/+; p=0.99, control v. futschN94/+ K394R/+ double mutant; p=0.51, K394R/+ v. futschN94/+ K394R/+ double mutant (D, right). Quantification: One-way ANOVA with post-hoc Tukey. All data are mean ± SEM. n.s= non-significant; **p=0.01–0.001; ****p<0.0001.
Figure 4.
Figure 4.. K394R mutant phenotypes are reverted by promoting microtubule stability
All genotypes are homozygous for wild-type or mutant αTub84B alleles. Larval fillets stained for stable microtubules (Futsch) and a neuronal membrane marker (HRP). Arrowheads: Futsch loops in type Ib boutons. Futsch loops and type Ib boutons were quantified for each experiment in the indicated genotype and treatment. Scale bar: 10 μm. (A and B) Representative images (A) and quantification (B) of dissected control and K394R mutant larvae treated with 50 μM taxol for 30 minutes prior to fixation. p-values, Ib Futsch loops: p=0.023, control v. +taxol; p<0.000001, control v. K394R; p=0.056, control v. K394R +taxol; p=0.0018, K394R v. K394R +taxol (B, left). p-values, Ib boutons: p=0.99, control v. +taxol; p=0.000007, control v. K394R; p=0.0016, control v. K394R +taxol; p=0.72, K394R v. K394R +taxol (B, right). (C and D) Representative images (C) and quantification (D) of control and K394R mutant larvae raised on food containing 10 μM taxol for 24 hours prior to dissection. p-values, Ib Futsch loops: p=1.0, control v. +taxol; p<0.000001, control v. K394R; p=0.12, control v. K394R +taxol; p<0.000001, K394R v. K394R +taxol (D, left). p-values, Ib boutons: p=0.027, control v. +taxol; p<0.000001, control v. K394R; p=0.77, control v. K394R +taxol; p=0.000001, K394R v. K394R +taxol (D, right). (E and F) The neuronal over-expression of Futsch affects type Ib bouton growth in control and K394R mutants. One copy each of OK6-Gal4 and UAS-Futsch were used to over-express Futsch. Representative images (E) and quantification (F). p-values, Ib Futsch loops: p=0.000005, control v. +Futsch; p<0.000001, control v. K394R; p=0.12, control v. K394R +Futsch; p<0.000001, K394R v. K394R +Futsch (F, left). p-values, Ib boutons: p<0.000001, control v. +Futsch; p=0.000037, control v. K394R; p=0.99, control v. K394R +Futsch; p=0.0018, K394R v. K394R +Futsch (F, right). Quantification: One-way ANOVA with post-hoc Tukey. All data are mean ± SEM. n.s= non-significant; *p=0.01–0.05; **p=0.01–0.001, ***p=0.001–0.0001; ****p<0.0001.
Figure 5.
Figure 5.. Elevating tubulin chaperone levels reverts K394R mutant phenotypes
All genotypes are homozygous for wild-type or mutant αTub84B alleles. (A) Cartoon showing the approach to visualise EB1::sfGFP specifically in neurons. Endogenous EB1 was tagged with the split-GFP peptide sfGFP(11), and pickpocket-Gal4 drove the expression of sfGFP(1–10) in sensory neurons to limit the reconstitution of sfGFP to neurons. (B) Representative kymographs of endogenous EB1 dynamics in control and K394R sensory neuron dendrites. Cell body is to the left. One copy each of EB1::sfGFP(11), pickpocket-Gal4, and UAS-sfGFP(1–10) were used. Scale bars: 10 μm (x-axis) and 30 seconds (y-axis). (C-E) Quantification of EB1::GFP comet trajectory (C), velocity (D), and frequency (E) in control and K394R mutants. p-values: p=0.16, control v. K394R (C); p=0.19, control v. K394R (D); p=0.0083, control v. K394R (E). (F and G) Representative (F) images and quantification (G) of Futsch loops and type Ib boutons in controls and animals over-expressing TBCE, K394R mutants, and K394R mutants over-expressing TBCE. One copy each of OK6-Gal4 and UAS-TBCE were used to over-express TBCE. Larval fillets are stained for stable microtubules (Futsch) and a neuronal membrane marker (HRP). Arrowheads: Futsch loops. Scale bar: 10 μm. p-values, Ib Futsch loops: p=1.0, control v. +TBCE; p<0.000001, control v. K394R; p=0.057, control v. K394R +TBCE; p=0.00013, K394R v. K394R +TBCE (G, left). p-values, Ib boutons: p<0.000001, control v. +TBCE; p=0.024, control v. K394R; p=0.89, control v. K394R +TBCE; p=0.00045, K394R v. K394R +TBCE (G, right). Quantification: Student’s unpaired t-test (C-E) and one-way ANOVA with post-hoc Tukey (G). All data are mean ± SEM. n.s=non-significant; *p=0.01–0.05, **p=0.01–0.001, ***p=0.001–0.0001, ****p<0.0001.
Figure 6.
Figure 6.. α-tubulin K394 acetylation is regulated by HDAC6
All genotypes are homozygous for wild-type or mutant αTub84B alleles and an HDAC6 knockout (KO) allele. elav-Gal4 (A and C) or OK6-Gal4 (D-G) were used to drive one copy of UAS-HDAC6 (wild-type or mutant as indicated). Larval fillets are stained for stable microtubules (Futsch) and a neuronal membrane marker (HRP) (D and G). (A) Western blot analysis (left) and quantification (right) of K394 acetylation of microtubules pelleted from control, K394R, and HDAC6 KO, and HDAC6 over-expression (OE) fly heads. The anti-Ac-K394 signal in the tubulin pellet lane is normalised to total α-tubulin. S=supernatant, P=pellet. See also Figure S3 for analysis of K394 acetylation in control, K394R and dαTAT over-expression fly heads. (B) Cartoon illustrating HDAC6 and its key domains, including two deacetylase domains (DAC1 and DAC2) and a ubiquitin-binding domain (UBD). The functional outcomes of point mutations in DAC1 and DAC2 are indicated. (C) Western blot analysis (left) and quantification (right) of K394 acetylation of microtubules pelleted from control and K394R fly heads and the heads of flies over-expressing wild-type HDAC6 (WT OE) or mutant HDAC6 (H664A OE). The anti-Ac-K394 signal in the tubulin pellet lane is normalised to total α-tubulin. S=supernatant, P=pellet. (D-F) The activity of DAC2 is necessary to reduce microtubule stability similar to the K394R mutants. Representative images (D) and quantification (E and F) of Futsch loops and type Ib boutons in control, K40R and K394R mutants, and animals over-expressing wild-type HDAC6 (HDAC6 OE) or mutant HDAC6 (H237A and/or H664A). All genotypes were included in the experiment, whose quantification is split between panels E and F. The quantification of the control and animals over-expressing wild-type HDAC6 are included in both E and F. p-values: p=0.74, control v. K40R; p<0.000001, control v. K394R; p<0.000001, control v. HDAC6 WT OE; p=0.062, K394R v. HDAC6 WT OE (E). p-values: p=0.99, HDAC6 WT OE v. HDAC6 H237A OE; p<0.000001, HDAC6 WT OE v. HDAC6 H664A OE; p<0.000001, HDAC6 WT OE v. HDAC6 H237A H664A OE; p<0.000001, HDAC6 WT OE v. control; p=0.000003, HDAC6 H237A OE v. HDAC6 H664A OE (F). (G) Representative image (left) and quantification (right) of HDAC6 H237A overexpression in the K394R mutant. p-values: p<0.000001, control v. +HDAC6 H237A OE; p<0.000001, control v. K394R; p<0.000001, control v. K394R +HDAC6 H237A OE; p=0.997, K394R v. K394R +HDAC6 H237A OE; p=0.971, +HDAC6 H237A OE v. K394R +HDAC6 H237A OE. Arrowheads: Futsch loops. Scale bar: 10 μm. Quantification: One-way ANOVA with post-hoc Tukey. All data are mean ± SEM. n.s=non-significant; *p=0.01–0.05; ***p<0.0001.
Figure 7.
Figure 7.. Manipulation of microtubule stability has neuron-type-specific effects
All genotypes are homozygous for wild-type or mutant αTub84B alleles. (A) Cartoon (left) and representative image (right) of type Ib and Is boutons that synapse on muscles 6 and 7 (m6 and m7) visualised with a neuronal membrane marker (HRP), Discs large 1 (Dlg), and DIP-α-GFP. The type Ib and Is boutons can be distinguished by differences in size (Ib are “big,” and Is are “small”) and molecular make-up: the type Ib boutons have high levels of Dlg and type Is neurons express DIP-α-GFP. Scale bar: 20 μm. (B-G) Larval fillets stained for stable microtubules (Futsch) and a neuronal membrane marker (HRP). Arrows indicate branches of type Is boutons. Futsch loops and type Is boutons were quantified. Scale bar: 10 μm. (B and C) Representative images (B) and quantification (C) of control and K394R mutant larvae raised on food containing 10 μM taxol for 24 hours prior to dissection. p-values, Is Futsch loops: p=0.3, control v. +taxol; p=0.000005, control v. K394R; p=0.96, control v. K394R +taxol; p=0.000012, K394R v. K394R +taxol (C, left). p-values, Is boutons: p=0.93, control v. +taxol; p<0.000001, control v. K394R; p=0.11, control v. K394R +taxol; p=0.000077, K394R v. K394R +taxol (C, right). (D and E) Effects of Futsch over-expression on microtubule stability and the growth of type Is boutons. Representative images (D) and quantification (E) of control and neurons over-expressing Futsch (OK6-Gal4 and UAS-Futsch, hemizygous). p-values, Is Futsch loops: p=0.0018, control v. +Futsch; p=0.0036, control v. K394R; p=1.0, control v. K394R +Futsch; p=0.028, K394R v. K394R +Futsch (E, left). p-values, Is boutons: p=0.056, control v. +Futsch; p<0.000001, control v. K394R; p=0.64, control v. K394R +Futsch; p=0.000008, K394R v. K394R +Futsch (E, right). (F and G) Representative images (F) and quantification (G) of control and K394R mutant. p-values, Is Futsch loops: p=1.0, control v. + K’in-WT; p=0.000017, control v. K394R (G, left). p-values, Is boutons: p=0.16, control v. K’in-WT; p<0.000001, control v. K394R (G, right). Quantification: One-way ANOVA with post-hoc Tukey. All data are mean ± SEM. n.s=non-significant; ***p=0.01–0.001; ****p<0.0001.

Comment in

Similar articles

Cited by

References

    1. Penazzi L, Bakota L, and Brandt R (2016). Microtubule Dynamics in Neuronal Development, Plasticity, and Neurodegeneration. International Review of Cell and Molecular Biology 321, 89–169. - PubMed
    1. Bodaleo FJ, and Gonzalez-Billault C (2016). The Presynaptic Microtubule Cytoskeleton in Physiological and Pathological Conditions: Lessons from Drosophila Fragile X Syndrome and Hereditary Spastic Paraplegias. Front Mol Neurosci 9, 60. - PMC - PubMed
    1. Prokop A (2020). Cytoskeletal organization of axons in vertebrates and invertebrates. J Cell Biol 219. - PMC - PubMed
    1. Knossow M, Campanacci V, Khodja LA, and Gigant B (2020). The Mechanism of Tubulin Assembly into Microtubules: Insights from Structural Studies. Iscience 23, 101511. - PMC - PubMed
    1. Halpain S, and Dehmelt L (2006). The MAP1 family of microtubule-associated proteins. Genome Biol 7, 224–224. - PMC - PubMed

Publication types

MeSH terms