Pyroptosis-Mediated Molecular Subtypes are Characterized by Distinct Tumor Microenvironment Infiltration Characteristics in Breast Cancer
- PMID: 35079221
- PMCID: PMC8779844
- DOI: 10.2147/JIR.S349186
Pyroptosis-Mediated Molecular Subtypes are Characterized by Distinct Tumor Microenvironment Infiltration Characteristics in Breast Cancer
Abstract
Background: Numerous reports have highlighted that pyroptosis is closely linked to tumorigenesis and drug resistance of tumors. However, the potential role of pyroptosis in regulating immune cell infiltration in tumor microenvironment (TME) remains unclear.
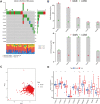
Methods: Here, we performed consensus clustering analysis based on the expression of 10 typical pyroptosis-related regulators (PRRs) to construct pyroptosis-mediated tumor pattern clusters and pyroptosis-related gene signature in breast cancer (BC). GSVA combined with ssGSEA methods were applied to evaluate the differences in biological pathway and immune cell infiltration level, respectively. The PCA method was employed to construct the pyro-score to quantify the pyroptosis pattern level of individual BC patient.
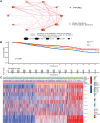
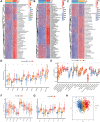
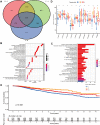
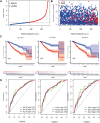
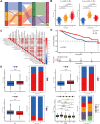
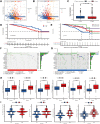
Results: We determined three distinct pyro-clusters among 1852 BC samples, which exhibited different survival outcomes and enriched biological processes. The TME features demonstrated that these three clusters corresponded to three established immune profiles: immune-desert, immune-excluded and immune-inflamed phenotype, respectively. Based on pyroptosis-related signature genes, we constructed the pyro-score and stratified BC patients into high and low pyro-score group. Patients with high pyro-score exhibited favorable outcome and increased infiltration of immune cells. Further investigation revealed that high pyro-score was also related to high expression of immunosuppressive molecules, decreased tumor mutation burden (TMB) and high rate of mutation in significantly mutated genes (SMGs) (eg, PIK3CA and CDH1).
Conclusion: This research emphasizes the indispensable role of pyroptosis in TME complexity and diversity. Assessing the pyroptosis pattern level of individual BC patient will assist us in better understanding TME features and directing more effective immunotherapeutic approaches.
Keywords: breast cancer; immune landscape; immunotherapy; pyroptosis; tumor microenvironment.
© 2022 Xu et al.
Conflict of interest statement
The authors declare that they have no competing interests.
Figures
Similar articles
-
Tumor Microenvironment-Mediated Immune Profiles Characterized by Distinct Survival Outcome and Immunotherapeutic Efficacy in Breast Cancer.Front Genet. 2022 Mar 25;13:840348. doi: 10.3389/fgene.2022.840348. eCollection 2022. Front Genet. 2022. PMID: 35401704 Free PMC article.
-
Identification of the pyroptosis-related prognostic gene signature and characterization of tumor microenvironment infiltration in triple-negative breast cancer.Front Genet. 2022 Aug 25;13:929870. doi: 10.3389/fgene.2022.929870. eCollection 2022. Front Genet. 2022. PMID: 36092879 Free PMC article.
-
Pyroptosis Patterns Characterized by Distinct Tumor Microenvironment Infiltration Landscapes in Gastric Cancer.Genes (Basel). 2021 Sep 28;12(10):1535. doi: 10.3390/genes12101535. Genes (Basel). 2021. PMID: 34680930 Free PMC article.
-
Epigenetic regulation of pyroptosis in cancer: Molecular pathogenesis and targeting strategies.Cancer Lett. 2023 Oct 28;575:216413. doi: 10.1016/j.canlet.2023.216413. Epub 2023 Sep 26. Cancer Lett. 2023. PMID: 37769798 Review.
-
Smart Nanoparticles for Breast Cancer Treatment Based on the Tumor Microenvironment.Front Oncol. 2022 May 26;12:907684. doi: 10.3389/fonc.2022.907684. eCollection 2022. Front Oncol. 2022. PMID: 35720010 Free PMC article. Review.
Cited by
-
An Angiogenesis-Related lncRNA Signature Is Associated with Prognosis and Tumor Immune Microenvironment in Breast Cancer.J Pers Med. 2023 Mar 13;13(3):513. doi: 10.3390/jpm13030513. J Pers Med. 2023. PMID: 36983695 Free PMC article.
-
Effect of tumor-associated macrophages on the pyroptosis of breast cancer tumor cells.Cell Commun Signal. 2023 Aug 4;21(1):197. doi: 10.1186/s12964-023-01208-y. Cell Commun Signal. 2023. PMID: 37542283 Free PMC article. Review.
-
Identification of disulfidptosis-related subtypes, characterization of tumor microenvironment infiltration, and development of a prognosis model in breast cancer.Front Immunol. 2023 Nov 15;14:1198826. doi: 10.3389/fimmu.2023.1198826. eCollection 2023. Front Immunol. 2023. PMID: 38035071 Free PMC article.
-
Crosstalk of three novel types of programmed cell death defines distinct microenvironment characterization and pharmacogenomic landscape in breast cancer.Front Immunol. 2022 Aug 11;13:942765. doi: 10.3389/fimmu.2022.942765. eCollection 2022. Front Immunol. 2022. PMID: 36032140 Free PMC article.
-
Subtype Classification, Immune Infiltration, and Prognosis Analysis of Lung Adenocarcinoma Based on Pyroptosis-Related Genes.Biomed Res Int. 2022 Oct 12;2022:1371315. doi: 10.1155/2022/1371315. eCollection 2022. Biomed Res Int. 2022. PMID: 36277882 Free PMC article.
References
Grants and funding
LinkOut - more resources
Full Text Sources
Miscellaneous

