. 2022 Jan;12(1):e660.
doi: 10.1002/ctm2.660.

Metformin promotes histone deacetylation of optineurin and suppresses tumour growth through autophagy inhibition in ocular melanoma

Affiliations

Metformin promotes histone deacetylation of optineurin and suppresses tumour growth through autophagy inhibition in ocular melanoma

Ai Zhuang et al. Clin Transl Med. 2022 Jan.

Abstract

Objective: To explore the therapeutic potential and the underlying mechanism of metformin, an adenosine monophosphate-activated kinase (AMPK) activator, in ocular melanoma.

Methods: CCK8, transwell, and colony formation assays were performed to detect the proliferation and migration ability of ocular melanoma cells. A mouse orthotopic xenograft model was built to detect ocular tumor growth in vivo. Western blot, immunofluorescence, and electron microscopy were adopted to evaluate the autophagy levels of ocular melanoma cells, and high-throughput proteomics and CUT & Tag assays were performed to analyze the candidate for autophagy alteration.

Results: Here, we revealed for the first time that a relatively low dose of metformin induced significant tumorspecific inhibition of the proliferation and migration of ocular melanoma cells both in vitro and in vivo. Intriguingly, we found that metformin significantly attenuated autophagic influx in ocular melanoma cells. Through high-throughput proteomics analysis, we revealed that optineurin (OPTN), which is a key candidate for autophagosome formation and maturation, was significantly downregulated after metformin treatment. Moreover, excessive OPTN expression was associated with an unfavorable prognosis of patients. Most importantly, we found that a histone deacetylase, SIRT1, was significantly upregulated after AMPK activation, resulting in histone deacetylation in the OPTN promoter.

Conclusions: Overall, we revealed for the first time that metformin significantly inhibited the progression of ocular melanoma, and verified that metformin acted as an autophagy inhibitor through histone deacetylation of OPTN. This study provides novel insights into metformin - guided suppression of ocular melanoma and the potential mechanism underlying the dual role of metformin in autophagy regulation.

Keywords: OPTN; autophagy; histone modification; metformin; ocular melanoma.


Conflict of interest statement

The authors declare that there is no conflict of interest.

Figures
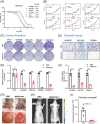
FIGURE 1
FIGURE 1
Metformin inhibits ocular melanoma growth in vitro and in vivo. (A) Metformin was tested for its effects on the viability of ocular melanoma cells (MUM2B, MEL290, CRMM1, CM2005.1) and normal control cells (PIG1, ARPE‐19). The IC50 values are listed after the cell names. (B) CCK‐8 assay showed the cell proliferation ability after treatment with 1.0 mM metformin. The absorbance at 450 nm was recorded and is presented as the mean ± SD. *p < .05, **p < .01, ***p < .001, ****p < .0001. (C and D) A plate colony formation assay was used to assess the cell proliferation ability after treatment with metformin (1.0 mM, 24 h). Statistical results of three individual experiments are shown as the mean ± SD. ***p < .001, ****p < .0001. (E and F) Transwell assays were performed to assess the cell migration ability after treatment with metformin (1.0 mM, 24 h). All experiments were performed in triplicate, and the statistical results are shown as the mean ± SD. ****p < .0001. (G) Overall and eyeball appearances showed the suppressive effects of metformin on tumour volume in an orthotopic xenograft model. The cells were treated with PBS or metformin (1.0 mM, 48 h) before intraocular injection. (H and I) The animal imaging system demonstrated the suppressive effects of metformin on tumour bioluminescent signals in orthotopic xenografts. Data were presented as the mean ± SEM. ***p < .001
FIGURE 2
FIGURE 2
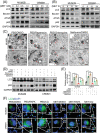
Metformin suppresses autophagy in ocular melanoma. (A) Western blot analysis showed the protein levels of autophagic flux‐related markers (LC3II/I, Beclin1, ATG5, p62) in ocular melanoma cells (MUM2B, CRMM1) treated with a gradient concentration of metformin for 24 h. GAPDH was used as the internal control. (B) Western blot analysis of the protein levels of autophagic flux‐related markers (LC3II/I, Beclin1, ATG5, p62) in ocular melanoma cells (MUM2B, CRMM1) after treatment with 1.0‐mM metformin for different durations. GAPDH was used as a loading control. (C) TEM was used to observe autophagosomes in MUM2B and CRMM1 cells treated with rapamycin (5 μM, 12 h), chloroquine (10 μM, 12 h) and metformin (1.0 mM, 24 h). Representative images are displayed and red arrows indicate autophagosome. Scale bar, 500 nm. (D) Western blot analysis of the protein levels of autophagic markers (LC3II/I, p62) in ocular melanoma cells (MUM2B, CRMM1) treated with metformin (1.0 mM) in the presence/absence of 5 μM rapamycin and 10 μM chloroquine. (E and F) IF was carried out to detect the accumulation of LC3 puncta in MUM2B and CRMM1 cells treated with metformin (MET, 1.0 mM, 24 h) in the presence/absence of rapamycin (RAPA, 5 μM, 12 h) and chloroquine (CQ, 10 μM, 12 h). PBS was used as a control for MET, and DMSO as a control for RAPA or CQ. LC3 expression is presented as the mean ± SEM (E), and representative images are displayed (F). Scale bar: 20 μm. *p < .05, **p < .01
FIGURE 3
FIGURE 3
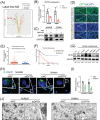
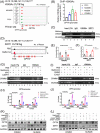
The expression and prognostic value of OPTN in ocular melanoma. (A). Volcano plots of label‐free MS showed the differentially expressed proteins in UM cells between the metformin‐treated group (1.0 mM for 24 h) and the control group. (B) Real‐time PCR showed OPTN expression in ocular melanoma cells (MUM2B, CRMM1) after treatment with 1.0 mM metformin for 24 h. (C) Western blot analysis showed OPTN expression in ocular melanoma cells (MUM2B, CRMM1) after treatment with 1.0 mM metformin for 24 h. GAPDH was used as a loading control. (D) Representative IF images showing OPTN expression in clinical samples of ocular melanoma and normal tissues. Scale bar: 50 μm. (E) Statistical results of OPTN expression in ocular melanoma and normal tissues. Data were presented as the mean ± SEM. *p < .05, ***p < .001. (F) Kaplan–Meier analysis revealed the correlation between OPTN expression and recurrence‐free rate in the internal cohort; n = 55, log‐rank test, p < .01. (G) Western blotting was carried out to detect the OPTN protein expression levels in ocular melanoma cells (92.1, MUM2B, MEL290, CRMM1, CRMM2, CM2005.1) and normal melanocytes (PIG1). GAPDH was used as an internal control. (H and I) Representative IF images showing the accumulation of LC3 puncta in MUM2B and CRMM1 cells after OPTN silencing (H). LC3 expression is presented as the mean ± SEM (I). *p < .05, **p < .01. Scale bar: 20 μm. (J) Representative TEM images showed autophagosomes in MUM2B and CRMM1 cells after OPTN knockdown, and red arrows indicate autophagosome. Scale bar: 500 nm
FIGURE 4
FIGURE 4
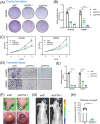
OPTN knockdown inhibits ocular melanoma growth in vitro and in vivo. (A and B) Plate colony formation assay was used to assess the growth rate of MUM2B and CRMM1 cells after OPTN knockdown. Statistical analyses of the colonies are presented as the mean ± SD. **p < .01, ***p < .001, ****p < .0001. (C) CCK‐8 assay was performed to measure the proliferation ability of MUM2B and CRMM1 cells after OPTN silencing. *p < .05, **p < .01. (D and E) Transwell assay was performed to evaluate the migration ability of MUM2B and CRMM1 cells treated with siOPTNs. The migrated cells were counted and are presented as the mean ± SD. ****p < .0001. (F) The overall and eyeball appearance of the mice showed the suppressive effects of OPTN knockdown on tumour volume in an orthotopic xenograft model. (G and H) The animal imaging system demonstrated the suppressive effects of OPTN silencing on tumour bioluminescent signals in orthotopic xenografts. Data are presented as the mean ± SEM. ***p < .001
FIGURE 5
FIGURE 5
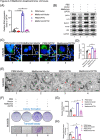
Overexpressing OPTN rescues the metformin‐mediated inhibition of autophagy, proliferation and migration of tumour cells. (A) Real‐time PCR showed OPTN expression levels in tumour cells treated with metformin (1.0 mM) alone, transfected with OPTN alone or treated/transfected with both. (B) Western blot analysis showed the protein levels of OPTN and autophagic flux‐related markers in tumour cells treated with metformin (1.0 mM) alone, transfected with OPTN alone or treated/transfected with both. GAPDH was used as a loading control. (C and D) Representative IF images demonstrating the accumulation of LC3 puncta in MUM2B cells treated with metformin (1.0 mM) alone, transfected with OPTN alone or treated/transfected with both. The relative LC3 expression is presented as the mean ± SEM. Scale bar: 20 μm. **p < .01. (E) Representative TEM images showing autophagosomes in MUM2B cells treated with metformin (1.0 mM) alone, transfected with OPTN alone or treated/transfected with both. Red arrows indicate autophagosome. Scale bar: 500 nm. (F–H) Plate colony formation assay and transwell migration assay were performed to demonstrate the proliferation ability and migration ability of MUM2B cells after treatment with metformin (1.0 mM) alone, transfection with OPTN alone or treatment/transfection with both. Statistical analyses of the colonies (G) and migrated cells (H) are shown. *p < .05, **p < .01
FIGURE 6
FIGURE 6
Metformin promotes SIRT1 binding and thus attenuates H3K9 acetylation in the OPTN promoter region. (A) CUT&Tag assay of H3K9Ac status in the OPTN promoter in MUM2B cells and normal PIG1 cells. (B) ChIP‐qPCR assay of H3K9Ac status in the OPTN promoter region in ocular melanoma cells (MUM2B, MEL290, CRMM1) and normal control cells (PIG1). (C) ChIP‐PCR assay of the H3K9Ac and SIRT1 status in the OPTN promoter region after treatment with 1.0‐mM metformin for 24 h in ocular melanoma cells (CRMM1, MUM2B). The representative outcome of agarose gel electrophoresis is shown. (D) CUT&Tag assay of SIRT1 status in the OPTN promoter region of MUM2B cells treated with metformin (1.0 mM, 24 h). (E and F) Statistical analyses of H3K9Ac enrichment (D) and SIRT1 enrichment (E) at the OPTN promotor are shown. *p < .05. (G–J) ChIP assay of H3K9Ac status in the OPTN promoter region after treatment with metformin, siSIRT1, and both in CRMM1 (G and H) and MUM2B cells (I and J). Statistical analyses of H3K9Ac enrichment in CRMM1 (H) and MUM2B cells (J) are presented. **p < .01. (K) Western blot analyses showed the protein levels of OPTN and SIRT1 in CRMM1 and MUM2B cells treated with metformin (1.0 mM) alone, siSIRT1s alone or both. GAPDH was used as a loading control. (L) Western blot analyses showed the protein levels of OPTN and SIRT1 in CRMM1 and MUM2B cells treated with metformin (1.0 mM) alone, EX527 (5 or 10 μM) alone or both. GAPDH was a loading control
FIGURE 7
FIGURE 7
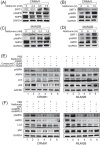
Metformin induces autophagy inhibition in an AMPK‐dependent way. (A) Western blot assay was carried out for p‐AMPK (Thr172), total AMPK and SIRT1 in CM cells (CRMM1) after treatment with gradient concentrations of metformin for 24 h. GAPDH was a loading control. (B) Western blot assay was performed to detect p‐AMPK (Thr172), total AMPK and SIRT1 in CM cells (CRMM1) after treatment with 1.0 mM metformin for different durations. GAPDH was a loading control. (C) Western blot assay was carried out for p‐AMPK (Thr172), total AMPK and SIRT1 in UM cells (MUM2B) after treatment with gradient concentrations of metformin. GAPDH was a loading control. (D) Western blot assay was performed to detect p‐AMPK (Thr172), total AMPK and SIRT1 in UM cells (MUM2B) after treatment with 1.0‐mM metformin for different durations. GAPDH was used as a loading control. (E) Western blot analyses showed the protein levels of p‐AMPK (Thr172), total AMPK, LC3 II/I and p62 in CRMM1 and MUM2B cells treated with metformin (1.0 mM) alone, Compound C (5 or 10 μM) alone or both. GAPDH was a loading control. (F) Western blot analyses showed the protein levels of p‐AMPK (Thr172), total AMPK, LC3 II/I and p62 in CRMM1 and MUM2B cells treated with metformin (1.0 mM) alone, siAMPKs alone or both. GAPDH was used as a loading control
FIGURE 8
FIGURE 8
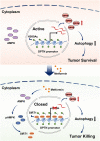
Proposed mechanism of action of metformin in ocular melanoma. Metformin upregulates the phosphorylation of AMPK and SIRT1; SIRT1 binding to OPTN promoter deacetylates H3K9, thus deceasing the transcription of OPTN; the decrease in OPTN inhibits the autophagic flux of ocular melanoma cells, leading to tumour killing

Similar articles

Cited by

References

    1. Espada L, Dakhovnik A, Chaudhari P, et al. Loss of metabolic plasticity underlies metformin toxicity in aged Caenorhabditis elegans. Nat Metab. 2020;2(11):1316‐1331. - PubMed
    1. Htet TD, Godneva A, Liu Z, et al. Rationale and design of a randomised controlled trial testing the effect of personalised diet in individuals with pre‐diabetes or type 2 diabetes mellitus treated with metformin. BMJ Open. 2020;10(10):e037859. - PMC - PubMed
    1. Hu Q, Peng J, Jiang L, et al. Metformin as a senostatic drug enhances the anticancer efficacy of CDK4/6 inhibitor in head and neck squamous cell carcinoma. Cell Death Dis. 2020;11(10):925. - PMC - PubMed
    1. Arbe MF, Agnetti L, Breininger E, Glikin GC, Finocchiaro LME, Villaverde MS. Glucose 6‐phosphate dehydrogenase inhibition sensitizes melanoma cells to metformin treatment. Transl Oncol. 2020;13(11):100842. - PMC - PubMed
    1. Chang C, Su H, Zhang D, et al. AMPK‐dependent phosphorylation of GAPDH triggers Sirt1 activation and is necessary for autophagy upon glucose starvation. Mol Cell. 2015;60(6):930‐940. - PubMed

Publication types