

Integrated Analysis of Ferroptosis-Related Biomarker Signatures to Improve the Diagnosis and Prognosis Prediction of Ovarian Cancer
- PMID: 35071242
- PMCID: PMC8766510
- DOI: 10.3389/fcell.2021.807862
Integrated Analysis of Ferroptosis-Related Biomarker Signatures to Improve the Diagnosis and Prognosis Prediction of Ovarian Cancer
Abstract
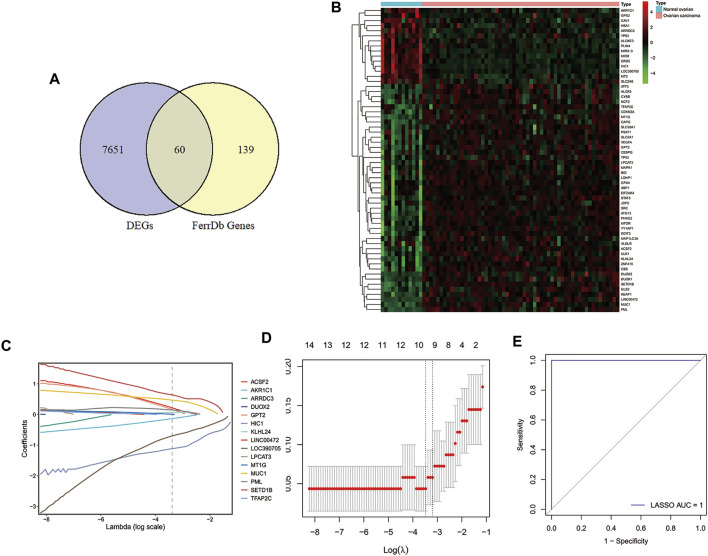
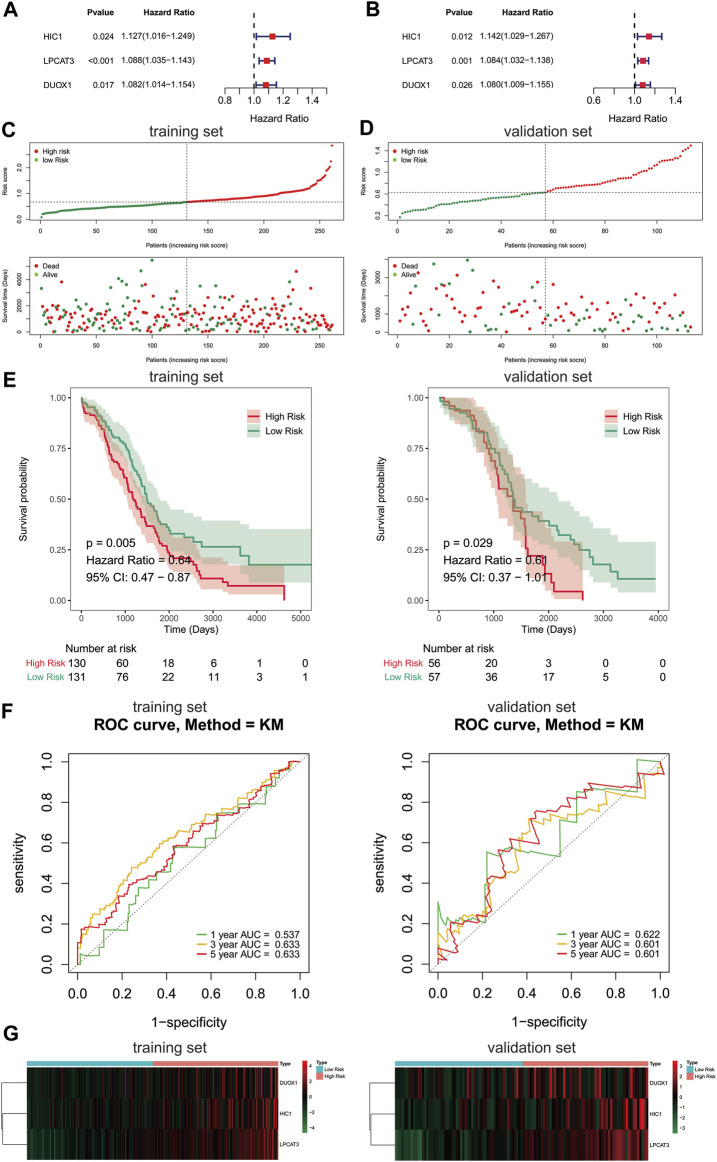
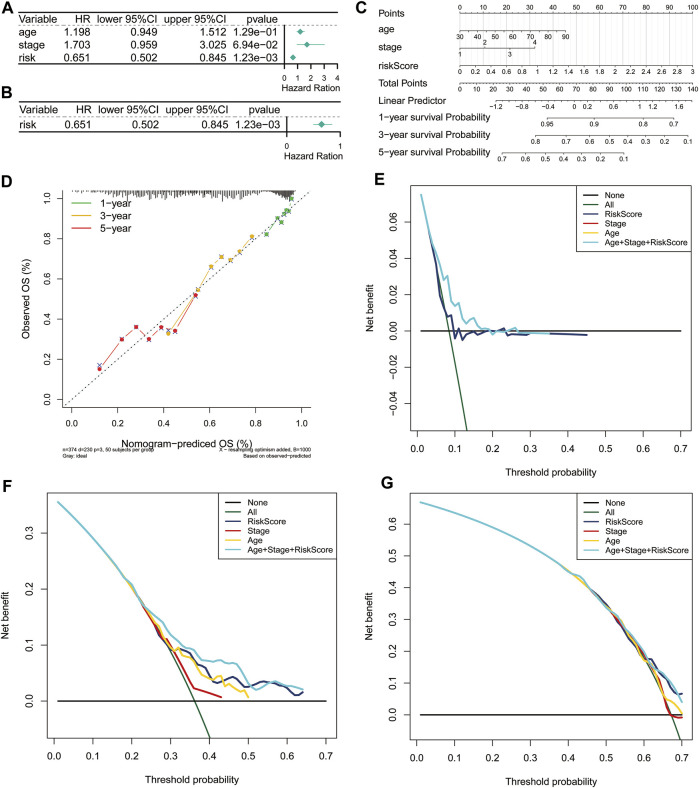
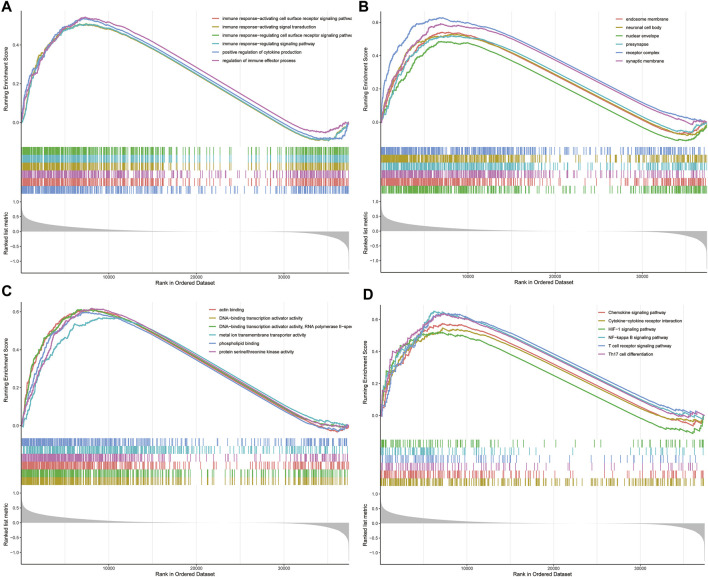
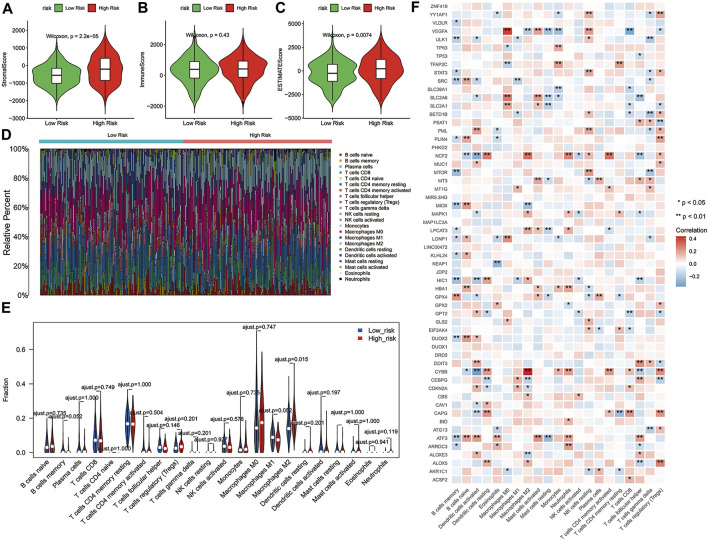
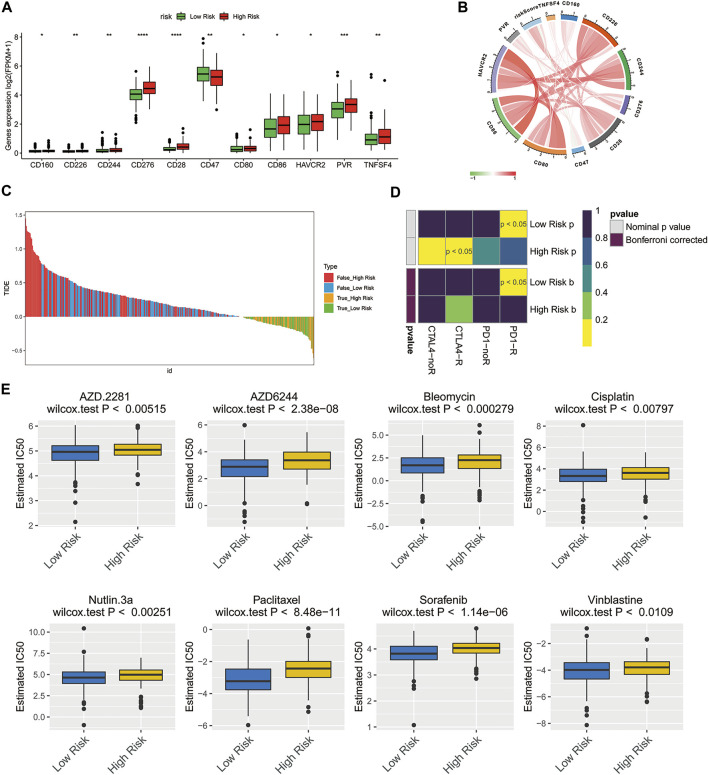
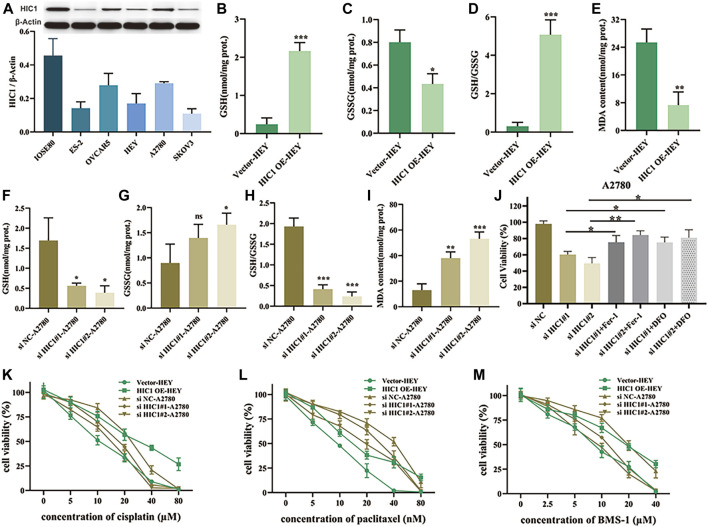
Ovarian cancer remains the most lethal gynecological malignancy. Ferroptosis, a specialized form of iron-dependent, nonapoptotic cell death, plays a crucial role in various cancers. However, the contribution of ferroptosis to ovarian cancer is poorly understood. Here, we characterized the diagnostic, prognostic, and therapeutic value of ferroptosis-related genes in ovarian cancer by analyzing transcriptomic data from The Cancer Genome Atlas and Gene Expression Omnibus databases. A reliable 10-gene ferroptosis signature (HIC1, ACSF2, MUC1, etc.) for the diagnosis of ovarian cancer was identified. Notably, we constructed and validated a novel prognostic signature including three FRGs: HIC1, LPCAT3, and DUOX1. We also further developed a risk score model based on these three genes which divided ovarian cancer patients into two risk groups. Functional analysis revealed that immune response and immune-related pathways were enriched in the high-risk group. Meanwhile, the tumor microenvironment was distinct between the two groups, with more M2 Macrophage infiltration and higher expression of key immune checkpoint molecules in the high-risk group than in the other group. Low-risk patients exhibited more favorable immunotherapy and chemotherapy responses. We conclude that crosstalk between ferroptosis and immunity may contribute to the worse prognosis of patients in the high-risk group. In particular, HIC1 showed both diagnostic and prognostic value in ovarian cancer. In vitro experiments demonstrated that inhibition of HIC1 improved drug sensitivity of chemotherapy and immunotherapy agents by inducing ferroptosis. Our findings provide new insights into the potential role of FRGs in the early detection, prognostic prediction, and individualized treatment decision-making for ovarian cancer patients.
Keywords: chemotherapy; diagnosis; ferroptosis-related genes; immunotherapy; ovarian cancer; prognosis.
Copyright © 2022 Wang, Cheng, Chang, Bao and Yi.
Conflict of interest statement
The authors declare that the research was conducted in the absence of any commercial or financial relationships that could be construed as a potential conflict of interest.
Figures
Similar articles
-
Ferroptosis: mechanism, immunotherapy and role in ovarian cancer.Front Immunol. 2024 Aug 13;15:1410018. doi: 10.3389/fimmu.2024.1410018. eCollection 2024. Front Immunol. 2024. PMID: 39192972 Free PMC article. Review.
-
Construction and validation of a novel ferroptosis-related signature for evaluating prognosis and immune microenvironment in ovarian cancer.Front Genet. 2023 Jan 5;13:1094474. doi: 10.3389/fgene.2022.1094474. eCollection 2022. Front Genet. 2023. PMID: 36685851 Free PMC article.
-
Ferroptosis-related genes identify tumor immune microenvironment characterization for the prediction of prognosis in cervical cancer.Ann Transl Med. 2022 Jan;10(2):123. doi: 10.21037/atm-21-6265. Ann Transl Med. 2022. PMID: 35282071 Free PMC article.
-
Identification of immunity- and ferroptosis-related genes for predicting the prognosis of serous ovarian cancer.Gene. 2022 Sep 5;838:146701. doi: 10.1016/j.gene.2022.146701. Epub 2022 Jun 28. Gene. 2022. PMID: 35777713
-
The recent advancements of ferroptosis in the diagnosis, treatment and prognosis of ovarian cancer.Front Genet. 2023 Nov 9;14:1275154. doi: 10.3389/fgene.2023.1275154. eCollection 2023. Front Genet. 2023. PMID: 38028615 Free PMC article. Review.
Cited by
-
Ferroptosis: mechanism, immunotherapy and role in ovarian cancer.Front Immunol. 2024 Aug 13;15:1410018. doi: 10.3389/fimmu.2024.1410018. eCollection 2024. Front Immunol. 2024. PMID: 39192972 Free PMC article. Review.
-
Construction and validation of a novel ferroptosis-related signature for evaluating prognosis and immune microenvironment in ovarian cancer.Front Genet. 2023 Jan 5;13:1094474. doi: 10.3389/fgene.2022.1094474. eCollection 2022. Front Genet. 2023. PMID: 36685851 Free PMC article.
-
Immunotherapeutic Value of Transcription Factor 19 (TCF19) Associated with Renal Clear Cell Carcinoma: A Comprehensive Analysis of 33 Human Cancer Cases.J Oncol. 2022 Sep 6;2022:1488165. doi: 10.1155/2022/1488165. eCollection 2022. J Oncol. 2022. PMID: 36111242 Free PMC article.
-
Research progress in the role and mechanism of LPCAT3 in metabolic related diseases and cancer.J Cancer. 2022 May 1;13(8):2430-2439. doi: 10.7150/jca.71619. eCollection 2022. J Cancer. 2022. PMID: 35711841 Free PMC article. Review.
-
Machine learning developed a PI3K/Akt pathway-related signature for predicting prognosis and drug sensitivity in ovarian cancer.Aging (Albany NY). 2023 Oct 17;15(20):11162-11183. doi: 10.18632/aging.205119. Epub 2023 Oct 17. Aging (Albany NY). 2023. PMID: 37851341 Free PMC article.
References
-
- Block M. S., Dietz A. B., Gustafson M. P., Kalli K. R., Erskine C. L., Youssef B., et al. (2020). Th17-inducing Autologous Dendritic Cell Vaccination Promotes Antigen-specific Cellular and Humoral Immunity in Ovarian Cancer Patients. Nat. Commun. 11 (1), 5173. 10.1038/s41467-020-18962-z - DOI - PMC - PubMed
LinkOut - more resources
Full Text Sources
Research Materials
Miscellaneous