. 2022 Mar;38(2):e3237.
doi: 10.1002/btpr.3237. Epub 2022 Feb 1.

Particle-based analysis elucidates the real retention capacities of virus filters and enables optimal virus clearance study design with evaluation systems of diverse virological characteristics

Affiliations

Particle-based analysis elucidates the real retention capacities of virus filters and enables optimal virus clearance study design with evaluation systems of diverse virological characteristics

Taiki Kayukawa et al. Biotechnol Prog. 2022 Mar.

Abstract

In virus clearance study (VCS) design, the amount of virus loaded onto the virus filters (VF) must be carefully controlled. A large amount of virus is required to demonstrate sufficient virus removal capability; however, too high a viral load causes virus breakthrough and reduces log reduction values. We have seen marked variation in the virus removal performance for VFs even with identical VCS design. Understanding how identical virus infectivity, materials and operating conditions can yield such different results is key to optimizing VCS design. The present study developed a particle number-based method for VCS and investigated the effects on VF performance of discrepancies between apparent virus amount and total particle number of minute virus of mice. Co-spiking of empty and genome-containing particles resulted in a decrease in the virus removal performance proportional to the co-spike ratio. This suggests that empty particles are captured in the same way as genome-containing particles, competing for retention capacity. In addition, between virus titration methods with about 2.0 Log10 difference in particle-to-infectivity ratios, there was a 20-fold decrease in virus retention capacity limiting the throughput that maintains the required LRV (e.g., 4.0), calculated using infectivity titers. These findings suggest that ignoring virus particle number in VCS design can cause virus overloading and accelerate filter breakthrough. This article asserts the importance of focusing on virus particle number and discusses optimization of VCS design that is unaffected by virological characteristics of evaluation systems and adequately reflect the VF retention capacity.

Keywords: minute virus of mice; particle to infectivity ratio; virus filter; virus filtration; virus retention capacity.


Figures

FIGURE 1
FIGURE 1
Marked differences are observed in virus removability between viral clearance studies with similar designs.(a) Plot of log reduction value (LRV) against throughput (L/m2) for Runs A and B. A solution of 10 mg/ml human immunoglobulin G/100 mM NaCl (pH 4.5) was spiked with minute virus of mice (MVM) to an infectivity titer of 6.0 Log10[TCID50/ml]. On filtration with Planova 20N, filtrate fractions were collected every 0.2 Log10[copies/m2] (or Log10[TCID50/m2]). Total fraction virus infectivity was measured and pool log reduction values at 100 and 200 L/m2 were calculated.(B) Plot of flux against throughput (L/m2) based on the filtration data in (a)
FIGURE 2
FIGURE 2
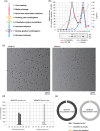
Separation of full capsids (FC) and empty capsids (EC) from crude minute virus of mice (MVM). (a) Summary of MVM purification steps. (b) Identification of MVM‐FC and ‐EC in the gradient after centrifugation. Hemagglutination (HA) titer and genomic DNA concentration were measured by HA assay and quantitative polymerase chain reaction, respectively, for all 12 fractions recovered from the top to bottom of the tube. Capsid proteins were also detected by western blotting and VP2 band intensities were measured. Normalized values are plotted on the left axis and fraction density on the right. (c) Cryogenic transmission electron microscopy (cryo‐TEM) analysis of MVM‐FC and ‐EC (scale bar, 100 nm). (d) Particle size distribution analysis of cryo‐TEM images (mean ± SD). Acquired images were analyzed by Vironova AB using their original imaging and analysis software. (e) Particle classification based on internal density. Acquired images were analyzed by Vironova AB using their original imaging and analysis software
FIGURE 3
FIGURE 3
Minute virus of mice (MVM) retention capacity of Planova 20N. (a) Graph illustrating virus breakthrough and virus retention capacity. The virus retention capacity of the virus filter is defined as the total virus load at the first filtrate fraction from which virus was continuously detected (star). (b) A solution of 10 mg/ml human immunoglobulin G/100 mM NaCl (pH 4.5) was spiked with MVM and filtered with Planova 20N. Filtrate fractions were collected every 0.2 Log10[copies/m2] and filtrate and feed solution MVM concentrations were measured using quantitative polymerase chain reaction. Filtrate MVM concentration (Log10[copies/ml]) was plotted against total load (Log10[copies/m2]). Two example runs are presented here. (c) Plot of MVM retention capacity of Planova 20N
FIGURE 4
FIGURE 4
Empty capsids (EC) compete with full capsids (FC) for virus retention capacity, causing early virus breakthrough. A solution of 10 mg/ml human immunoglobulin G/100 mM NaCl (pH 4.5) spiked with minute virus of mice (MVM)‐FC was co‐spiked with MVM‐EC at ratios of 10:1 or 100:1 and filtered with Planova 20N. Filtrate fractions were collected every 0.2 Log10[copies/m2] and filtrate and feed solution MVM concentrations were measured using quantitative polymerase chain reaction. The Planova 20N retention capacity with MVM‐FC alone was used a non‐co‐spiking control (EC:FC = 0:1). (a) Plot of filtrate MVM concentration (Log10[copies/ml]) against total load (Log10[copies/m2]). (b) The MVM retention capacity of Planova 20N on co‐spiking with MVM‐EC. (c) Plot of changes in log reduction value against throughput (L/m2). (d) Solutions separately spiked with MVM‐FC and MVM‐EC were filtered with Planova 20N and the positions of the virus particles captured in the hollow fiber were detected (scale bar, 25 μm). The inner and outer surfaces of the hollow fibers are indicated by arrow heads. Virus fluorescence signal was quantified and signal distribution was plotted against membrane thickness direction
FIGURE 5
FIGURE 5
Decreased virus retention capacity due to empty particles is a common concern for all types of virus filtration. (a) A solution of 1 mg/ml human immunoglobulin G (h‐IgG)/100 mM NaCl (pH 4.5) was spiked with minute virus of mice (MVM) and filtered with Planova 15N. Filtrate fractions were collected every 0.2 Log10[copies/m2] and filtrate and feed solution MVM concentrations were measured using quantitative polymerase chain reaction (qPCR). Filtrate MVM concentration (Log10[copies/ml]) was plotted against total load (Log10[copies/m2]). (b) A 1 mg/ml h‐IgG/100 mM NaCl (pH 4.5) solution spiked with MVM was co‐spiked with MVM‐virus‐like particles (VLP) at a ratio of 30:1 and filtered with Planova 15N. Filtrate fractions were collected every 0.2 Log10[copies/m2] and filtrate and feed solution MVM concentrations were measured using qPCR. Filtrate MVM concentration (Log10[copies/ml]) was plotted against total load (Log10[copies/m2]). (c) Plot of the MVM retention capacities of Planova 15N for MVM‐full capsids spiked alone and co‐spiked with MVM‐empty capsids. (d) Plot of the changes in log reduction value against throughput (L/m2) for Planova 15N filtration after co‐spiking with MVM‐VLP (see [b])
FIGURE 6
FIGURE 6
(a) Left: Plot of infectivity titer and copy number of MVM propagated at multiplicities of infection (MOI) of 0.01 and 1.00. Infectivities were measured using NB324K cells. Dotted line indicates y = x. Right: Scatter plot of MVM FC/I ratio. (b) Left: Plot of infectivity titer measured using NB324K and A9 cells against copy number. The infectivities of five lots of MVM‐full capsid stock produced using the same method were measured using NB324K and A9 cells. Dotted line indicates y = x. Right: Scatter plot of MVM P/I ratio. *p < 0.05; ***p < 0.001 by two‐tailed Student's t test (a, b)
FIGURE 7
FIGURE 7
Virus overload and early virus breakthrough in evaluation systems with large particle to infectivity (P/I) ratios A solution of 10 mg/ml human immunoglobulin G/100 mM NaCl (pH 4.5) was spiked with minute virus of mice (MVM) to an infectivity titer of 6.0 Log10[TCID50/ml]. Total fraction virus infectivity was measured and the decrease in log reduction value (LRV) was calculated from the pool and maximum LRV at 100 L/m2. (a) The solutions were filtered with Planova 20N and filtrate fractions were collected every 0.2 Log10[copies/m2] (or Log10[TCID50/m2]). Minute virus of mice retention capacity (Log10[copies/m2]) in Runs C and D and filtrate MVM concentration (Log10[copies/ml]) are plotted against total load (Log10[copies/m2]). (b) Minute virus of mice retention capacity (Log10[TCID50/m2]) in Runs C and D and filtrate MVM concentration (Log10[TCID50/ml]) are plotted against total load (Log10[TCID50/m2]). (c) Changes in LRV (calculated using infectivity titer) in Runs C and D are plotted against total load (Log10[TCID50/m2]). (d) Changes in LRV (calculated using infectivity titer) in Runs C and D are plotted against throughput (L/m2)
FIGURE 8
FIGURE 8
Breakthrough curve shift modeling to compare the particle number‐based analysis and apparent virus count‐based analysis Virus filter breakthrough curves of two virtual virus clearance studies VCS α and VCS β are plotted based on total particle number (left) and apparent virus count (right). Breakthrough curves are fitted by linear, x‐axis; Total virus load, y‐axis; Fraction titer, Aα; the retention capacity of VCS α, Aβ; the retention capacity of VCS β, a; slope of breakthrough curve, b; value of y‐intercept, c; Logarithmic ratio of empty particles for quantitative PCR titration or P/I ratio for infectivity‐based titration

Similar articles

References

    1. Barone PW, Wiebe ME, Springs SL, et al. Implications for emerging therapies. Nat Biotechnol. 2020;38:563‐572. doi:10.1038/s41587-020-0507-2 - DOI - PubMed
    1. ICH Harmonized Tripartite Guideline Q5A (R1) . Viral safety evaluation of biotechnology products derived from cell lines of human or animal origin. US Fed Reg. 1999;63(185):51074. - PubMed
    1. Guideline on virus safety evaluation of biotechnological investigational medicinal products. EMA 2008: EMEA/CHMP/BWP/398498/2005;1–9. - PubMed
    1. Sterilizing filtration of liquids task force. sterilizing filtration of liquids. technical report no. 26 (revised 2008). PDA J Pharm Sci Technol. 2008;62(26):2‐60. - PubMed
    1. Lute S, Bailey M, Combs J, Sukumar M, Brorson K. Phage passage after extended processing in small‐virus‐retentive filters. Biotechnol Appl Biochem. 2007;47(3):141‐151. doi:10.1042/BA20060254 - DOI - PubMed