

Neuroinflammatory Profiling in SIV-Infected Chinese-Origin Rhesus Macaques on Antiretroviral Therapy
- PMID: 35062343
- PMCID: PMC8781366
- DOI: 10.3390/v14010139
Neuroinflammatory Profiling in SIV-Infected Chinese-Origin Rhesus Macaques on Antiretroviral Therapy
Abstract
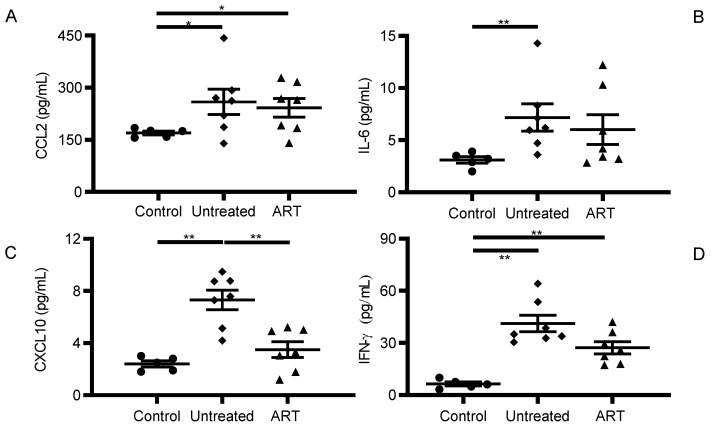
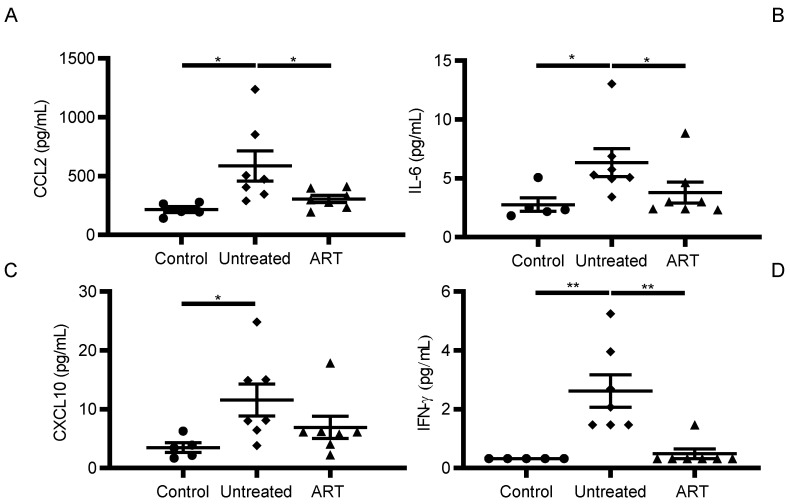
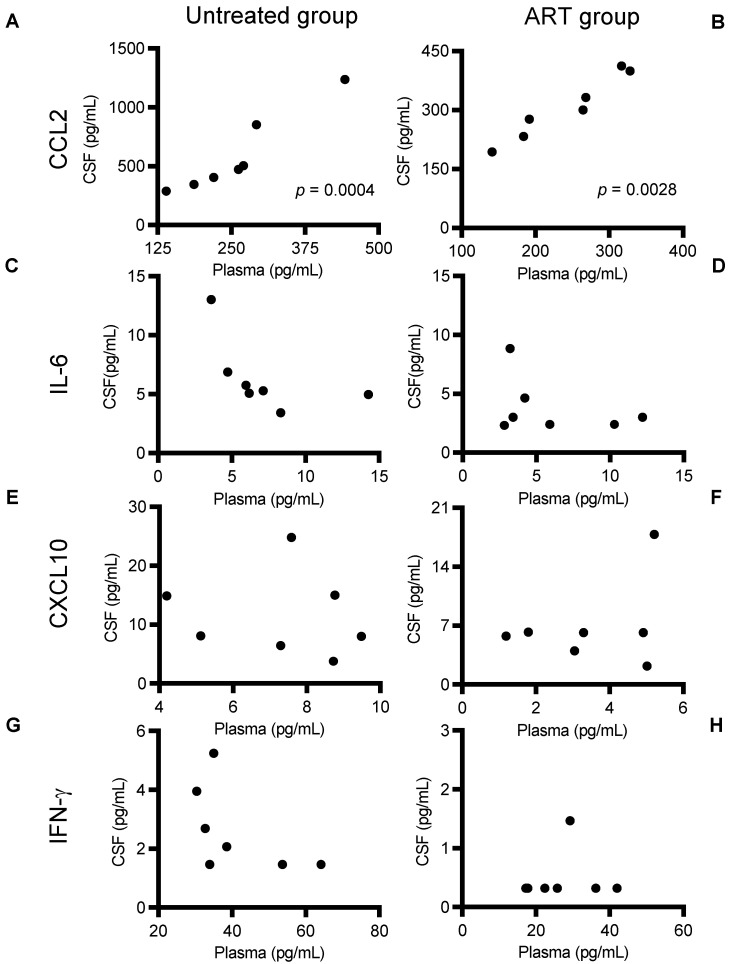
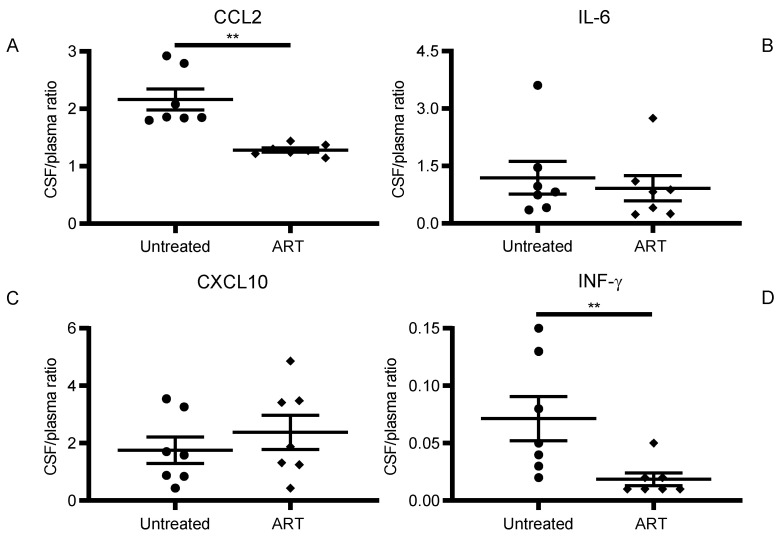
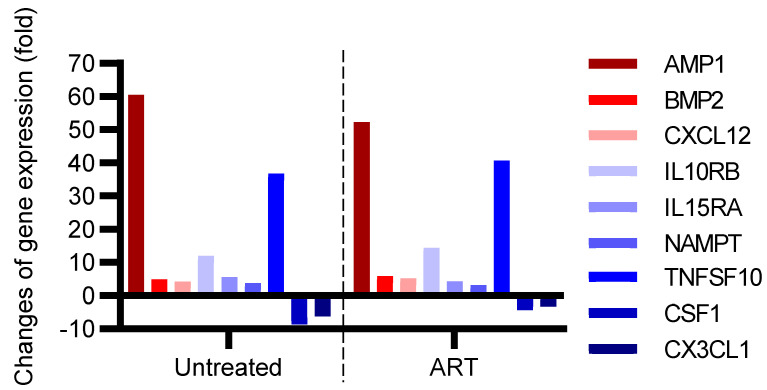
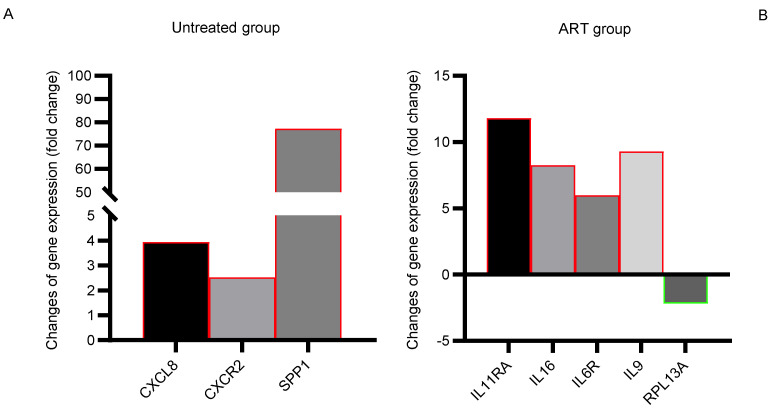
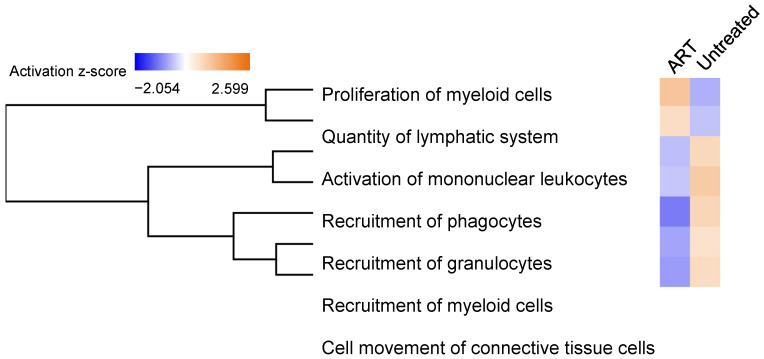
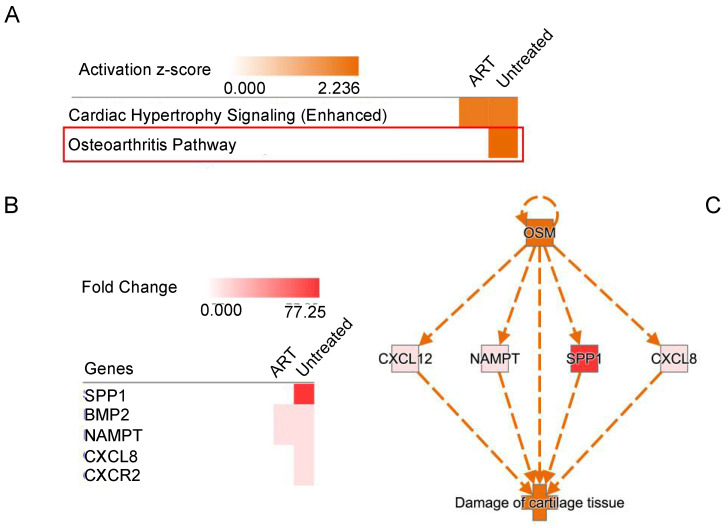
The central nervous system (CNS) HIV reservoir is an obstacle to achieving an HIV cure. The basal ganglia harbor a higher frequency of SIV than other brain regions in the SIV-infected rhesus macaques of Chinese-origin (chRMs) even on suppressive combination antiretroviral therapy (ART). Since residual HIV/SIV reservoir is associated with inflammation, we characterized the neuroinflammation by gene expression and systemic levels of inflammatory molecules in healthy controls and SIV-infected chRMs with or without ART. CCL2, IL-6, and IFN-γ were significantly reduced in the cerebrospinal fluid (CSF) of animals receiving ART. Moreover, there was a correlation between levels of CCL2 in plasma and CSF, suggesting the potential use of plasma CCL2 as a neuroinflammation biomarker. With higher SIV frequency, the basal ganglia of untreated SIV-infected chRMs showed an upregulation of secreted phosphoprotein 1 (SPP1), which could be an indicator of ongoing neuroinflammation. While ART greatly reduced neuroinflammation in general, proinflammatory genes, such as IL-9, were still significantly upregulated. These results expand our understanding of neuroinflammation and signaling in SIV-infected chRMs on ART, an excellent model to study HIV/SIV persistence in the CNS.
Keywords: antiretroviral therapy; central nervous system; human immunodeficiency virus; immune activation; neuroinflammation; non-human primates; reservoir; rhesus macaques; simian immunodeficiency virus.
Conflict of interest statement
The authors declare no conflict of interest.
Figures
Similar articles
-
Simian Immunodeficiency Virus Persistence in Cellular and Anatomic Reservoirs in Antiretroviral Therapy-Suppressed Infant Rhesus Macaques.J Virol. 2018 Aug 29;92(18):e00562-18. doi: 10.1128/JVI.00562-18. Print 2018 Sep 15. J Virol. 2018. PMID: 29997216 Free PMC article.
-
Brain Macrophages in Simian Immunodeficiency Virus-Infected, Antiretroviral-Suppressed Macaques: a Functional Latent Reservoir.mBio. 2017 Aug 15;8(4):e01186-17. doi: 10.1128/mBio.01186-17. mBio. 2017. PMID: 28811349 Free PMC article.
-
Short-Term Pegylated Interferon α2a Treatment Does Not Significantly Reduce the Viral Reservoir of Simian Immunodeficiency Virus-Infected, Antiretroviral Therapy-Treated Rhesus Macaques.J Virol. 2018 Jun 29;92(14):e00279-18. doi: 10.1128/JVI.00279-18. Print 2018 Jul 15. J Virol. 2018. PMID: 29720521 Free PMC article.
-
Brain macrophages harbor latent, infectious simian immunodeficiency virus.AIDS. 2019 Dec 1;33 Suppl 2(Suppl 2):S181-S188. doi: 10.1097/QAD.0000000000002269. AIDS. 2019. PMID: 31789817 Free PMC article. Review.
-
An SIV/macaque model targeted to study HIV-associated neurocognitive disorders.J Neurovirol. 2018 Apr;24(2):204-212. doi: 10.1007/s13365-017-0582-4. Epub 2017 Oct 3. J Neurovirol. 2018. PMID: 28975505 Free PMC article. Review.
Cited by
-
Lymphoid tissues contribute to plasma viral clonotypes early after antiretroviral therapy interruption in SIV-infected rhesus macaques.Sci Transl Med. 2023 Dec 13;15(726):eadi9867. doi: 10.1126/scitranslmed.adi9867. Epub 2023 Dec 13. Sci Transl Med. 2023. PMID: 38091409 Free PMC article.
-
The HIV-1 vpr R77Q Mutant Induces Apoptosis, G2 Cell Cycle Arrest, and Lower Production of Pro-Inflammatory Cytokines in Human CD4+ T Cells.Viruses. 2024 Oct 21;16(10):1642. doi: 10.3390/v16101642. Viruses. 2024. PMID: 39459974 Free PMC article.
-
Non-Human Primate Models of HIV Brain Infection and Cognitive Disorders.Viruses. 2022 Sep 9;14(9):1997. doi: 10.3390/v14091997. Viruses. 2022. PMID: 36146803 Free PMC article. Review.
-
Morphine suppresses peripheral responses and transforms brain myeloid gene expression to favor neuropathogenesis in SIV infection.Front Immunol. 2022 Nov 16;13:1012884. doi: 10.3389/fimmu.2022.1012884. eCollection 2022. Front Immunol. 2022. PMID: 36466814 Free PMC article.
-
Advancing the preclinical study of comorbid neuroHIV and substance use disorders: Current perspectives and future directions.Brain Behav Immun. 2023 Oct;113:453-475. doi: 10.1016/j.bbi.2023.07.021. Epub 2023 Aug 9. Brain Behav Immun. 2023. PMID: 37567486 Free PMC article. Review.
References
Publication types
MeSH terms
Substances
Grants and funding
LinkOut - more resources
Full Text Sources
Medical
Research Materials
Miscellaneous
