

Different Shades of Listeria monocytogenes: Strain, Serotype, and Lineage-Based Variability in Virulence and Stress Tolerance Profiles
- PMID: 35058906
- PMCID: PMC8764371
- DOI: 10.3389/fmicb.2021.792162
Different Shades of Listeria monocytogenes: Strain, Serotype, and Lineage-Based Variability in Virulence and Stress Tolerance Profiles
Abstract
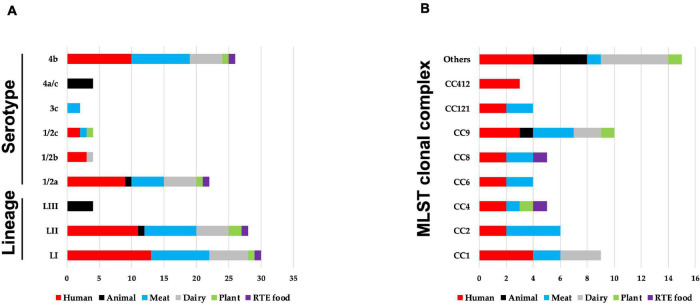
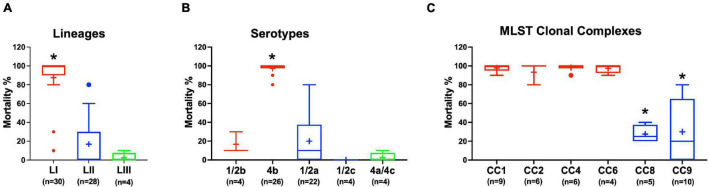
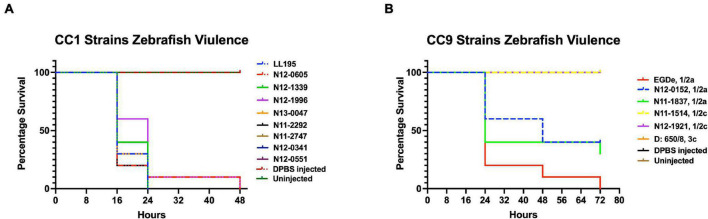
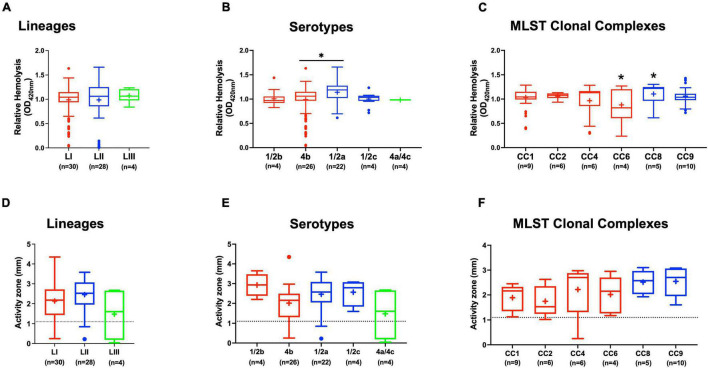
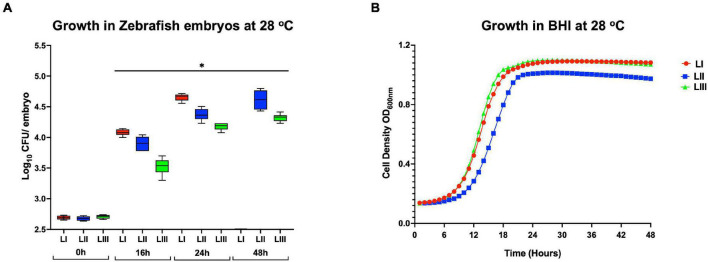
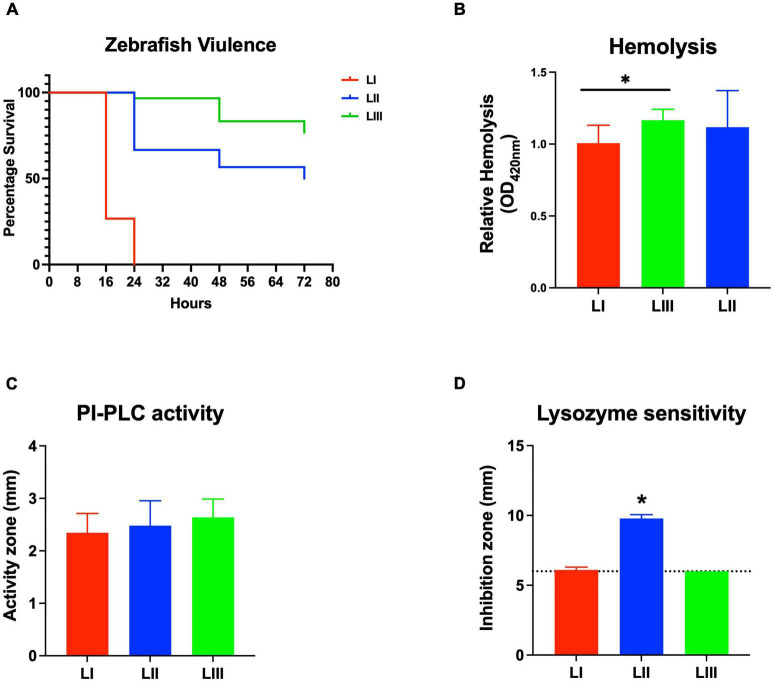
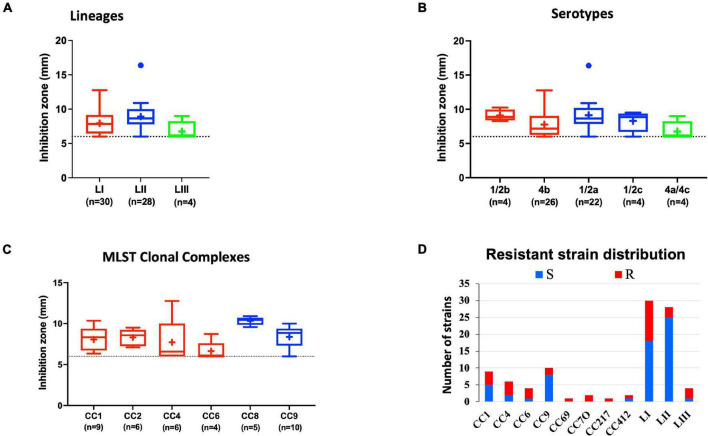
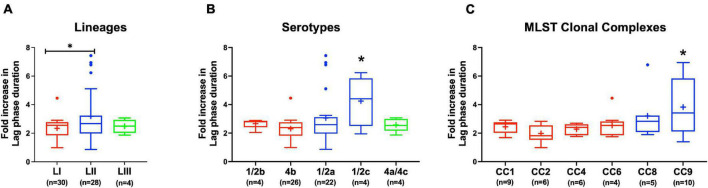
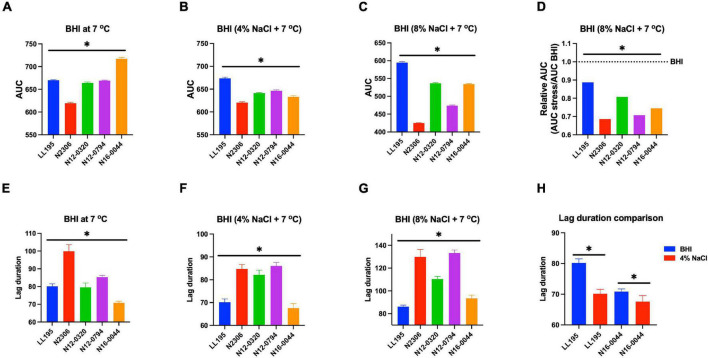
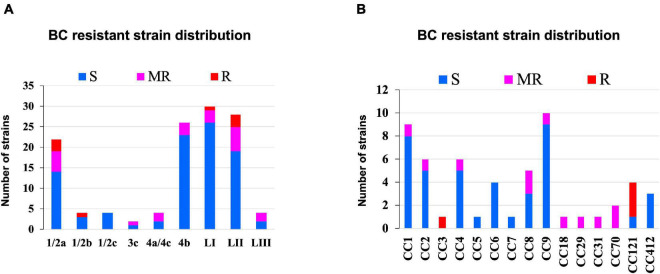
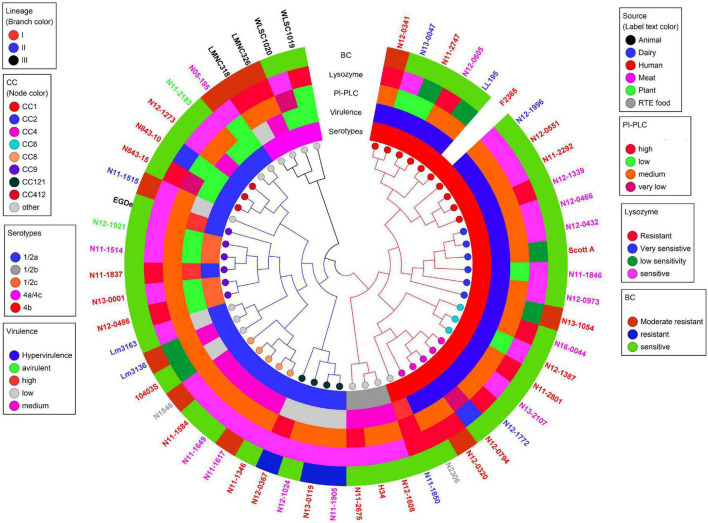
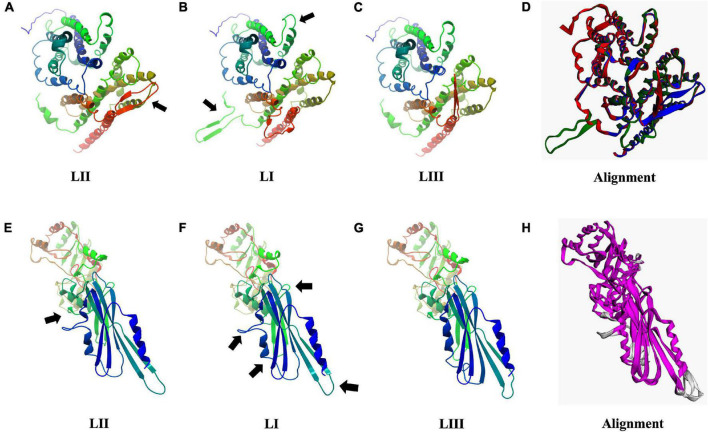
Listeria monocytogenes is a public health and food safety challenge due to its virulence and natural stress resistance phenotypes. The variable distribution of L. monocytogenes molecular subtypes with respect to food products and processing environments and among human and animal clinical listeriosis cases is observed. Sixty-two clinical and food-associated L. monocytogenes isolates were examined through phenome and genome analysis. Virulence assessed using a zebrafish infection model revealed serotype and genotype-specific differences in pathogenicity. Strains of genetic lineage I serotype 4b and multilocus sequence type clonal complexes CC1, CC2, CC4, and CC6 grew and survived better and were more virulent than serotype 1/2a and 1/2c lineage II, CC8, and CC9 strains. Hemolysis, phospholipase activity, and lysozyme tolerance profiles were associated with the differences observed in virulence. Osmotic stress resistance evaluation revealed serotype 4b lineage I CC2 and CC4 strains as more osmotolerant, whereas serotype 1/2c lineage II CC9 strains were more osmo-sensitive than others. Variable tolerance to the widely used quaternary ammonium compound benzalkonium chloride (BC) was observed. Some outbreak and sporadic clinical case associated strains demonstrated BC tolerance, which might have contributed to their survival and transition in the food-processing environment facilitating food product contamination and ultimately outbreaks or sporadic listeriosis cases. Genome comparison uncovered various moderate differences in virulence and stress associated genes between the strains indicating that these differences in addition to gene expression regulation variations might largely be responsible for the observed virulence and stress sensitivity phenotypic differences. Overall, our study uncovered strain and genotype-dependent variation in virulence and stress resilience among clinical and food-associated L. monocytogenes isolates with potential public health risk implications. The extensive genome and phenotypic data generated provide a basis for developing improved Listeria control strategies and policies.
Keywords: Listeria monocytogenes; genome; lysozyme; stress; virulence; zebrafish.
Copyright © 2022 Muchaamba, Eshwar, Stevens, Stephan and Tasara.
Conflict of interest statement
The authors declare that the research was conducted in the absence of any commercial or financial relationships that could be construed as a potential conflict of interest.
Figures
Similar articles
-
Genomic Determinants of Pathogenicity and Antimicrobial Resistance for 60 Global Listeria monocytogenes Isolates Responsible for Invasive Infections.Front Cell Infect Microbiol. 2021 Oct 27;11:718840. doi: 10.3389/fcimb.2021.718840. eCollection 2021. Front Cell Infect Microbiol. 2021. PMID: 34778102 Free PMC article.
-
Variable Carbon Source Utilization, Stress Resistance, and Virulence Profiles Among Listeria monocytogenes Strains Responsible for Listeriosis Outbreaks in Switzerland.Front Microbiol. 2019 May 3;10:957. doi: 10.3389/fmicb.2019.00957. eCollection 2019. Front Microbiol. 2019. PMID: 31130938 Free PMC article.
-
Listeria monocytogenes Source Distribution Analysis Indicates Regional Heterogeneity and Ecological Niche Preference among Serotype 4b Clones.mBio. 2018 Apr 17;9(2):e00396-18. doi: 10.1128/mBio.00396-18. mBio. 2018. PMID: 29666282 Free PMC article.
-
Listeria monocytogenes lineages: Genomics, evolution, ecology, and phenotypic characteristics.Int J Med Microbiol. 2011 Feb;301(2):79-96. doi: 10.1016/j.ijmm.2010.05.002. Epub 2010 Aug 13. Int J Med Microbiol. 2011. PMID: 20708964 Review.
-
Landscape of Stress Response and Virulence Genes Among Listeria monocytogenes Strains.Front Microbiol. 2022 Jan 20;12:738470. doi: 10.3389/fmicb.2021.738470. eCollection 2021. Front Microbiol. 2022. PMID: 35126322 Free PMC article. Review.
Cited by
-
The In Vitro Antibacterial Activity of Phytogenic and Acid-Based Eubiotics against Major Foodborne Zoonotic Poultry Pathogens.Animals (Basel). 2024 May 29;14(11):1611. doi: 10.3390/ani14111611. Animals (Basel). 2024. PMID: 38891658 Free PMC article.
-
Prevalence and Population Diversity of Listeria monocytogenes Isolated from Dairy Cattle Farms in the Cantabria Region of Spain.Animals (Basel). 2022 Sep 19;12(18):2477. doi: 10.3390/ani12182477. Animals (Basel). 2022. PMID: 36139336 Free PMC article.
-
Comparative Analysis of Growth, Survival, and Virulence Characteristics of Listeria monocytogenes Isolated from Imported Meat.Microorganisms. 2024 Feb 7;12(2):345. doi: 10.3390/microorganisms12020345. Microorganisms. 2024. PMID: 38399749 Free PMC article.
-
A South African Perspective on the Microbiological and Chemical Quality of Meat: Plausible Public Health Implications.Microorganisms. 2023 Oct 3;11(10):2484. doi: 10.3390/microorganisms11102484. Microorganisms. 2023. PMID: 37894142 Free PMC article. Review.
-
Is the persistence of Listeria monocytogenes in food processing facilities and its resistance to pathogen intervention linked to its phylogeny?Appl Environ Microbiol. 2024 Jun 18;90(6):e0086124. doi: 10.1128/aem.00861-24. Epub 2024 May 29. Appl Environ Microbiol. 2024. PMID: 38809044 Free PMC article.
References
LinkOut - more resources
Full Text Sources
Molecular Biology Databases