

Belimumab Decreases Autophagy and Citrullination in Peripheral Blood Mononuclear Cells from Patients with Systemic Lupus Erythematosus
- PMID: 35053379
- PMCID: PMC8773843
- DOI: 10.3390/cells11020262
Belimumab Decreases Autophagy and Citrullination in Peripheral Blood Mononuclear Cells from Patients with Systemic Lupus Erythematosus
Abstract
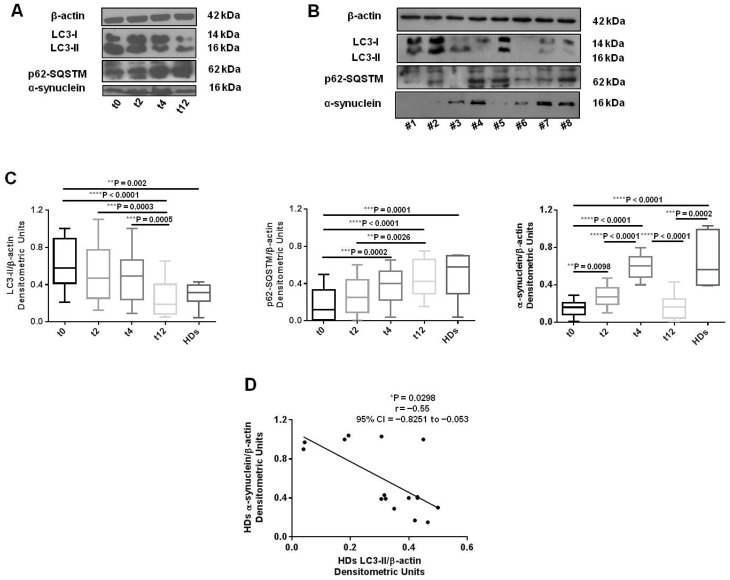
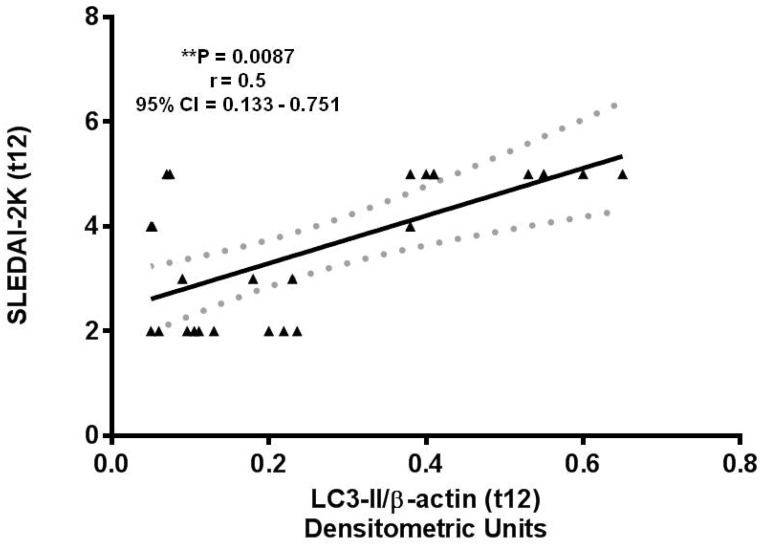
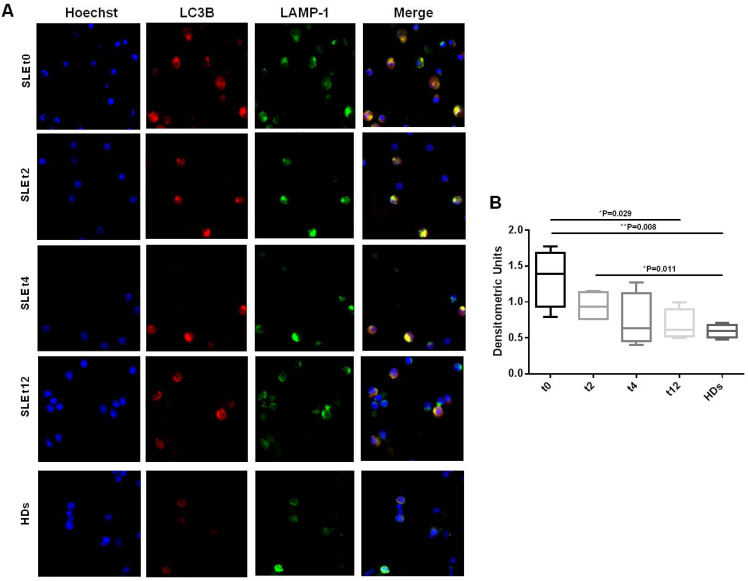
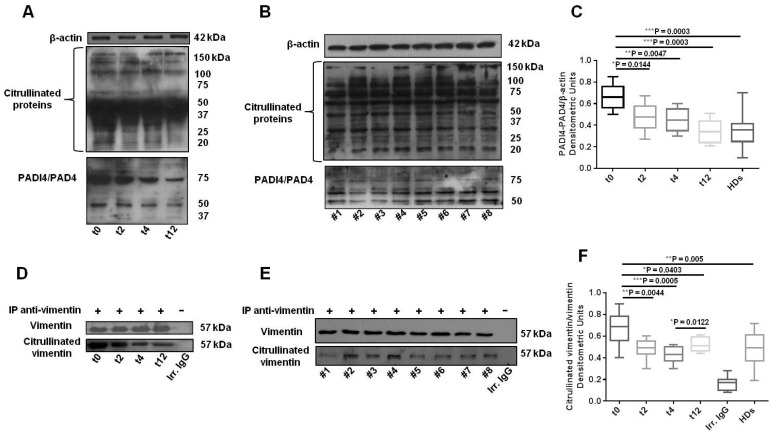
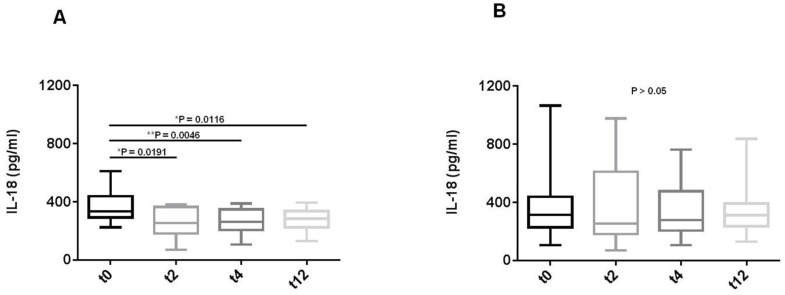
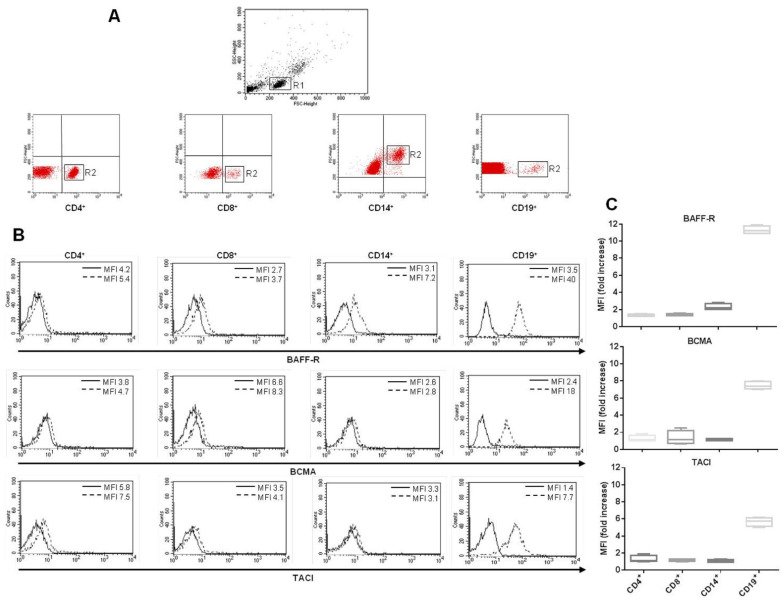
Belimumab (BLM) is a B lymphocyte stimulator (BLyS) inhibitor approved for the treatment of systemic lupus erythematosus (SLE). Autophagy is a cell survival mechanism involved in the pathogenesis of SLE. Citrullination is a post-translational modification catalyzed by peptidylarginine deiminase (PAD) enzymes. Autophagy and citrullination may generate neoepitopes, evoking an autoimmune response. No previous studies have investigated the connection of these processes, and how BLM could affect them, in SLE. Ex vivo autophagy and protein citrullination were analyzed by western blot in lysates from 26 SLE patients' PBMCs at baseline and after 2, 4, and 12 weeks of BLM administration, and from 16 healthy donors' PBMCs. Autophagic PBMCs were identified by the immunofluorescent detection of the autophagy-associated proteins LC3B (LC3 puncta) and LAMP-1. Autophagosome accumulation was evaluated in CD14- (PBLs) and CD14+ (monocytes) SLE cells. The presence of the BLyS receptors BAFF-R, BCMA, and TACI on SLE CD4+, CD8+ T cells and monocytes, as well as serum IL-18 levels, was also assessed. Following BLM administration, we observed a decrease in autophagy and citrullination, with a lowering of LC3-II, citrullinated vimentin, and PAD4 expression levels in PBMCs from SLE patients. LC3-II levels showed a correlation with the SLE Disease Activity Index 2000 (SLEDAI-2K) after 12 weeks of therapy. The LC3B/LAMP-1 analysis confirmed the reduction in autophagy. A lesser autophagosome accumulation occurred in PBLs and monocytes which, in turn, seemed to be the main cellular populations contributing to autophagy. A reduction in patients' serum IL-18 concentrations occurred. CD4+ and CD8+ cells weakly expressed BAFF receptors; monocytes expressed only BAFF-R. BLM could impact on autophagy and citrullination, offering an opportunity for a deeper understanding of these mechanisms in SLE, and a possible tool for the clinical management of SLE.
Keywords: B lymphocyte stimulator (BLyS); BLyS receptors; IL-18; autophagy; belimumab; citrullination; peptidylarginine deiminases (PADs); systemic lupus erythematosus.
Conflict of interest statement
The authors declare no conflict of interest.
Figures
Similar articles
-
B lymphocyte stimulator modulates number and function of endothelial progenitor cells in systemic lupus erythematosus.Arthritis Res Ther. 2019 Nov 21;21(1):245. doi: 10.1186/s13075-019-2015-7. Arthritis Res Ther. 2019. PMID: 31752963 Free PMC article.
-
BAFF-R and TACI expression on CD3+ T cells: Interplay among BAFF, APRIL and T helper cytokines profile in systemic lupus erythematosus.Cytokine. 2019 Feb;114:115-127. doi: 10.1016/j.cyto.2018.11.008. Epub 2018 Nov 19. Cytokine. 2019. PMID: 30467093
-
Belimumab therapy in systemic lupus erythematosus.BioDrugs. 2013 Jun;27(3):225-35. doi: 10.1007/s40259-013-0031-8. BioDrugs. 2013. PMID: 23568179 Review.
-
Development of systemic lupus erythematosus in NZM 2328 mice in the absence of any single BAFF receptor.Arthritis Rheum. 2013 Apr;65(4):1043-54. doi: 10.1002/art.37846. Arthritis Rheum. 2013. PMID: 23334904 Free PMC article.
-
The BAFF/APRIL system: emerging functions beyond B cell biology and autoimmunity.Cytokine Growth Factor Rev. 2013 Jun;24(3):203-15. doi: 10.1016/j.cytogfr.2013.04.003. Epub 2013 May 15. Cytokine Growth Factor Rev. 2013. PMID: 23684423 Free PMC article. Review.
Cited by
-
The Extracellular Vesicle Citrullinome and Signature in a Piglet Model of Neonatal Seizures.Int J Mol Sci. 2023 Jul 16;24(14):11529. doi: 10.3390/ijms241411529. Int J Mol Sci. 2023. PMID: 37511288 Free PMC article.
-
Lymphocytes are less sensitive to autophagy than monocytes during fasting and exercise conditions.Apoptosis. 2022 Oct;27(9-10):730-739. doi: 10.1007/s10495-022-01752-x. Epub 2022 Jul 19. Apoptosis. 2022. PMID: 35852665 Free PMC article.
-
Selective inhibition of peptidyl-arginine deiminase (PAD): can it control multiple inflammatory disorders as a promising therapeutic strategy?Inflammopharmacology. 2023 Apr;31(2):731-744. doi: 10.1007/s10787-023-01149-5. Epub 2023 Feb 17. Inflammopharmacology. 2023. PMID: 36806957 Review.
-
Is Autophagy a Friend or Foe in SARS-CoV-2 Infection?Viruses. 2024 Sep 20;16(9):1491. doi: 10.3390/v16091491. Viruses. 2024. PMID: 39339967 Free PMC article. Review.
-
Autophagy in Rheumatic Diseases: Role in the Pathogenesis and Therapeutic Approaches.Cells. 2022 Apr 15;11(8):1359. doi: 10.3390/cells11081359. Cells. 2022. PMID: 35456038 Free PMC article. Review.
References
-
- Mannelli M., Gelmini S., Arnaldi G., Becherini L., Bemporad D., Crescioli C., Pazzagli M., Mantero F., Serio M., Orlando C. Telomerase Activity Is Significantly Enhanced in Malignant Adrenocortical Tumors in Comparison to Benign Adrenocortical Adenomas. J. Clin. Endocrinol. Metab. 2000;85:468–470. doi: 10.1210/jcem.85.1.6300. - DOI - PubMed
Publication types
MeSH terms
Substances
Grants and funding
LinkOut - more resources
Full Text Sources
Medical
Research Materials
Miscellaneous
