

Detection and characterization of genome-wide mutations in M1 vegetative cells of gamma-irradiated Arabidopsis
- PMID: 35051177
- PMCID: PMC8775353
- DOI: 10.1371/journal.pgen.1009979
Detection and characterization of genome-wide mutations in M1 vegetative cells of gamma-irradiated Arabidopsis
Abstract
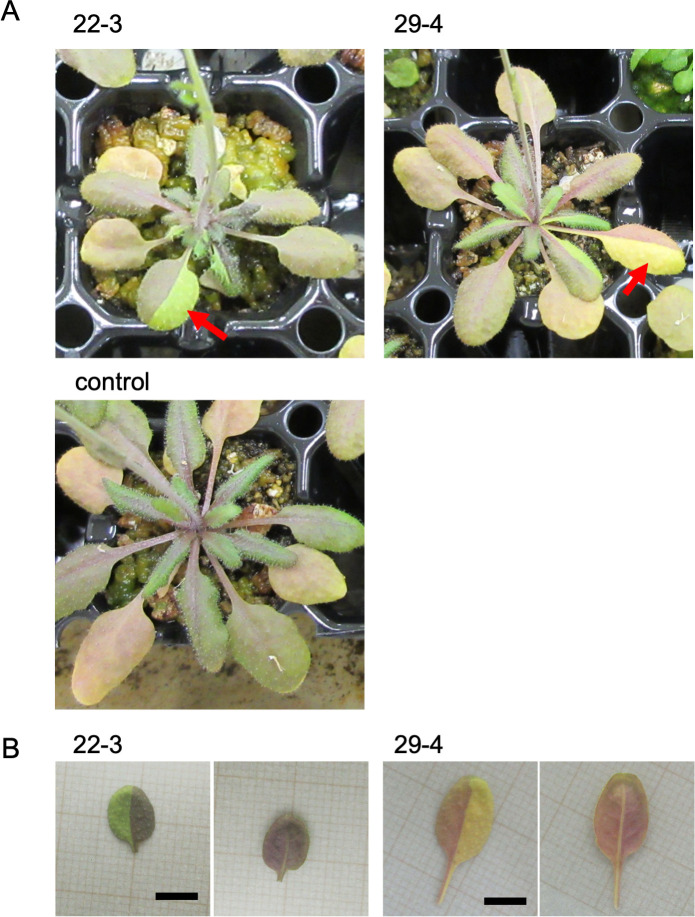
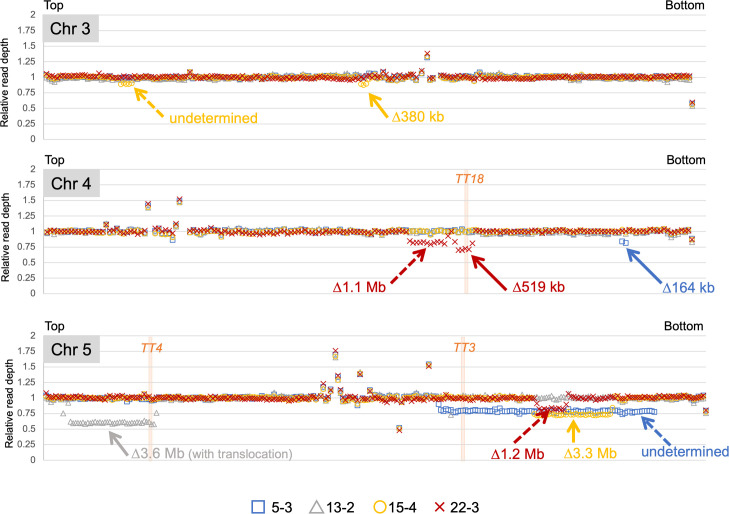
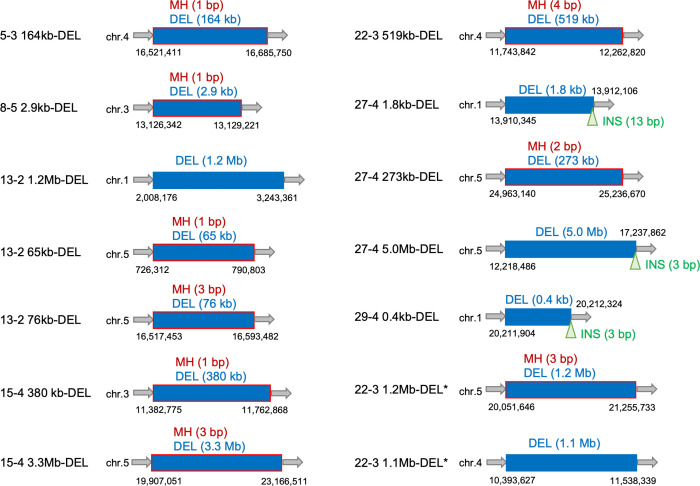
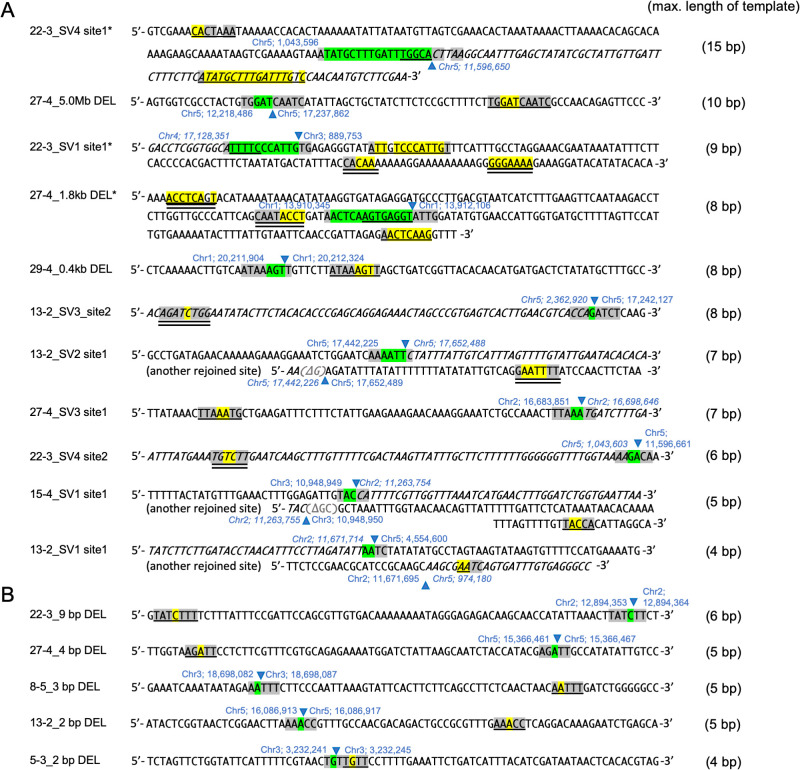
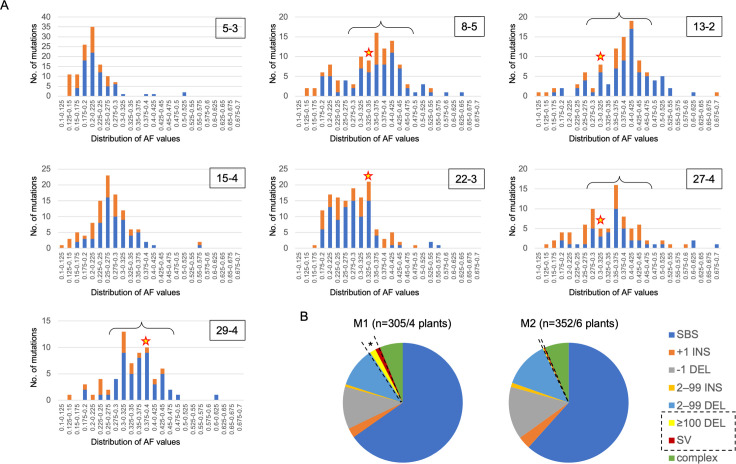
Radiation-induced mutations have been detected by whole-genome sequencing analyses of self-pollinated generations of mutagenized plants. However, large DNA alterations and mutations in non-germline cells were likely missed. In this study, in order to detect various types of mutations in mutagenized M1 plants, anthocyanin pigmentation was used as a visible marker of mutations. Arabidopsis seeds heterozygous for the anthocyanin biosynthetic genes were irradiated with gamma-rays. Anthocyanin-less vegetative sectors resulting from a loss of heterozygosity were isolated from the gamma-irradiated M1 plants. The whole-genome sequencing analysis of the sectors detected various mutations, including structural variations (SVs) and large deletions (≥100 bp), both of which have been less characterized in the previous researches using gamma-irradiated plant genomes of M2 or later generations. Various types of rejoined sites were found in SVs, including no-insertion/deletion (indel) sites, only-deletion sites, only-insertion sites, and indel sites, but the rejoined sites with 0-5 bp indels represented most of the SVs. Examinations of the junctions of rearrangements (SVs and large deletions), medium deletions (10-99 bp), and small deletions (2-9 bp) revealed unique features (i.e., frequency of insertions and microhomology) at the rejoined sites. These results suggest that they were formed preferentially via different processes. Additionally, mutations that occurred in putative single M1 cells were identified according to the distribution of their allele frequency. The estimated mutation frequencies and spectra of the M1 cells were similar to those of previously analyzed M2 cells, with the exception of the greater proportion of rearrangements in the M1 cells. These findings suggest there are no major differences in the small mutations (<100 bp) between vegetative and germline cells. Thus, this study generated valuable information that may help clarify the nature of gamma-irradiation-induced mutations and their occurrence in cells that develop into vegetative or reproductive tissues.
Conflict of interest statement
The authors have declared that no competing interests exist.
Figures


Similar articles
-
Development of a simple multiple mutation detection system using seed-coat flavonoid pigments in irradiated Arabidopsis M1 plants.Sci Rep. 2022 Dec 28;12(1):22467. doi: 10.1038/s41598-022-26989-z. Sci Rep. 2022. PMID: 36577797 Free PMC article.
-
Frequency and Spectrum of Mutations Induced by Gamma Rays Revealed by Phenotype Screening and Whole-Genome Re-Sequencing in Arabidopsis thaliana.Int J Mol Sci. 2022 Jan 7;23(2):654. doi: 10.3390/ijms23020654. Int J Mol Sci. 2022. PMID: 35054839 Free PMC article.
-
Characterization of gamma irradiation-induced mutations in Arabidopsis mutants deficient in non-homologous end joining.J Radiat Res. 2020 Sep 8;61(5):639-647. doi: 10.1093/jrr/rraa059. J Radiat Res. 2020. PMID: 32766789 Free PMC article.
-
Physiological status of plant tissue affects the frequency and types of mutations induced by carbon-ion irradiation in Arabidopsis.Sci Rep. 2018 Jan 23;8(1):1394. doi: 10.1038/s41598-018-19278-1. Sci Rep. 2018. PMID: 29362368 Free PMC article.
-
Calling large indels in 1047 Arabidopsis with IndelEnsembler.Nucleic Acids Res. 2021 Nov 8;49(19):10879-10894. doi: 10.1093/nar/gkab904. Nucleic Acids Res. 2021. PMID: 34643730 Free PMC article.
Cited by
-
Development of a simple multiple mutation detection system using seed-coat flavonoid pigments in irradiated Arabidopsis M1 plants.Sci Rep. 2022 Dec 28;12(1):22467. doi: 10.1038/s41598-022-26989-z. Sci Rep. 2022. PMID: 36577797 Free PMC article.
-
Genomic view of heavy-ion-induced deletions associated with distribution of essential genes in Arabidopsis thaliana.Front Plant Sci. 2024 Apr 17;15:1352564. doi: 10.3389/fpls.2024.1352564. eCollection 2024. Front Plant Sci. 2024. PMID: 38693931 Free PMC article.
-
Physiological and Transcriptomic Analyses Reveal the Effects of Carbon-Ion Beam on Taraxacum kok-saghyz Rodin Adventitious Buds.Int J Mol Sci. 2023 May 26;24(11):9287. doi: 10.3390/ijms24119287. Int J Mol Sci. 2023. PMID: 37298239 Free PMC article.
-
Comparative analysis of seed and seedling irradiation with gamma rays and carbon ions for mutation induction in Arabidopsis.Front Plant Sci. 2023 Apr 6;14:1149083. doi: 10.3389/fpls.2023.1149083. eCollection 2023. Front Plant Sci. 2023. PMID: 37089645 Free PMC article.
-
Optimal conditions of algal breeding using neutral beam and applying it to breed Euglena gracilis strains with improved lipid accumulation.Sci Rep. 2024 Jul 3;14(1):14716. doi: 10.1038/s41598-024-65175-1. Sci Rep. 2024. PMID: 38961078 Free PMC article.
References
Publication types
MeSH terms
Substances
Grants and funding
LinkOut - more resources
Full Text Sources
