

Radiation-Induced Alterations in Proliferation, Migration, and Adhesion in Lens Epithelial Cells and Implications for Cataract Development
- PMID: 35049738
- PMCID: PMC8772889
- DOI: 10.3390/bioengineering9010029
Radiation-Induced Alterations in Proliferation, Migration, and Adhesion in Lens Epithelial Cells and Implications for Cataract Development
Abstract
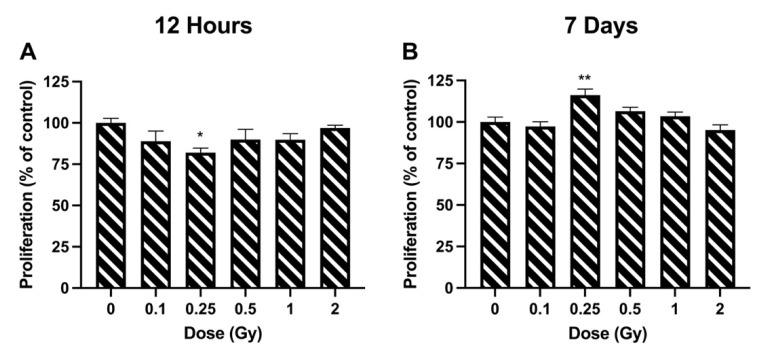
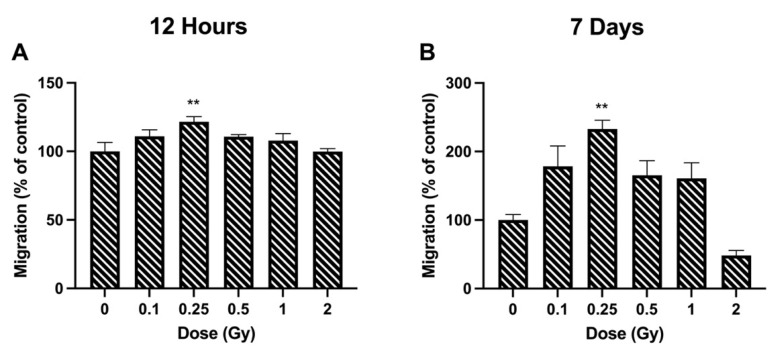
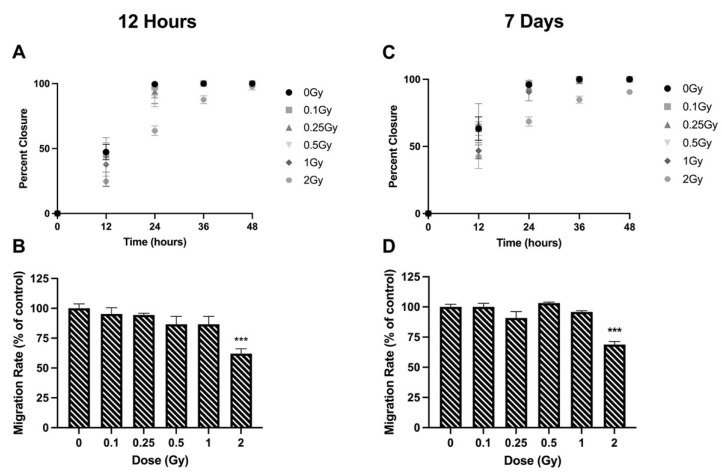
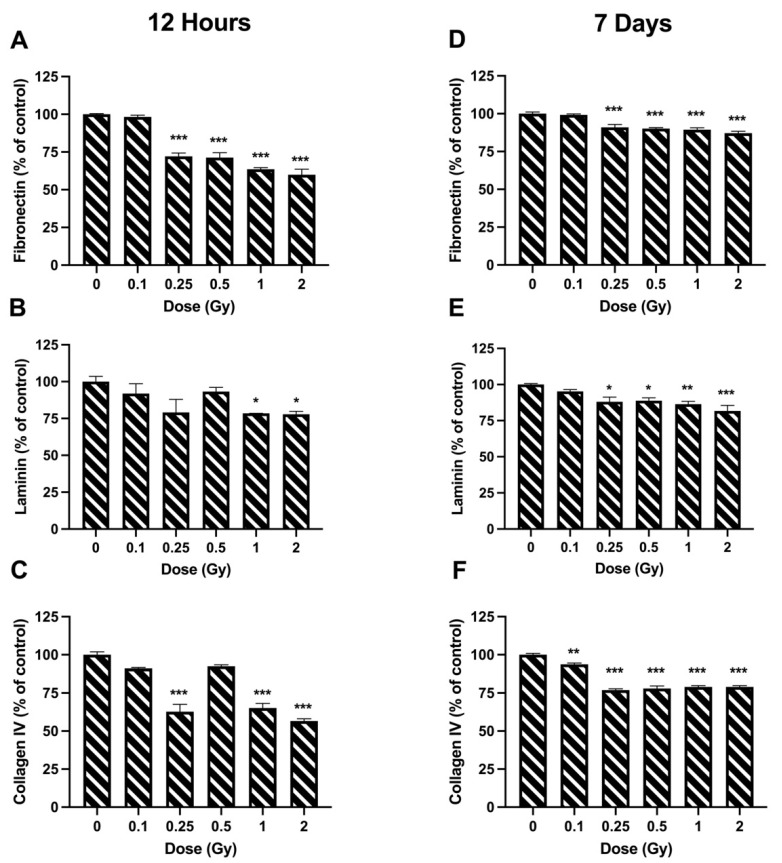
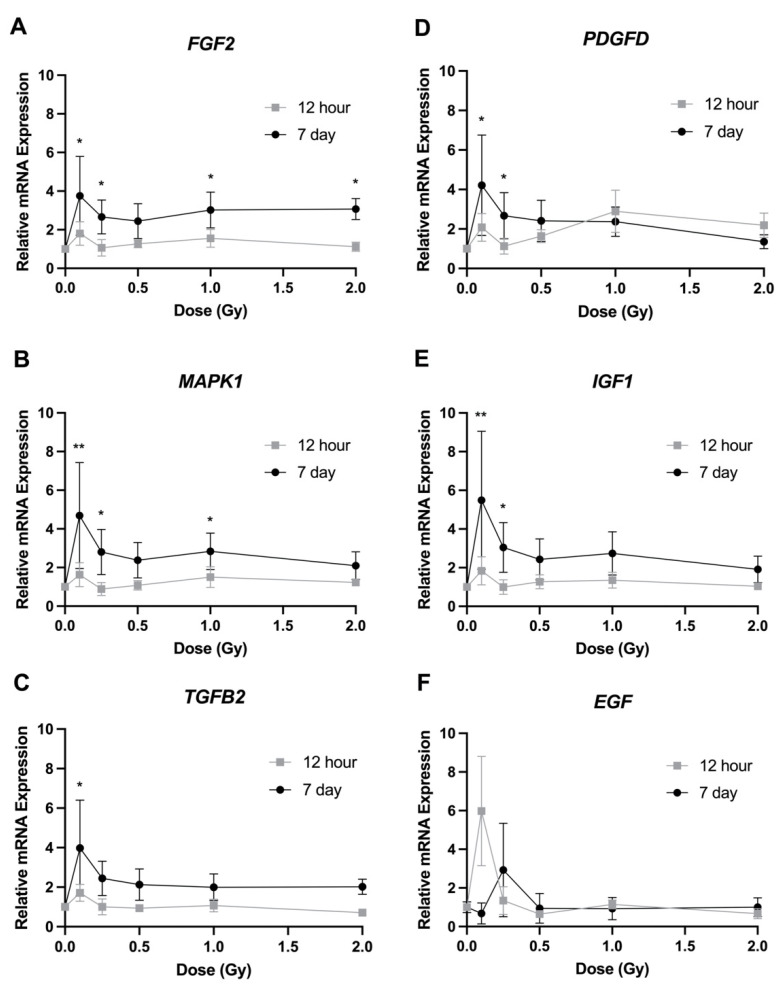
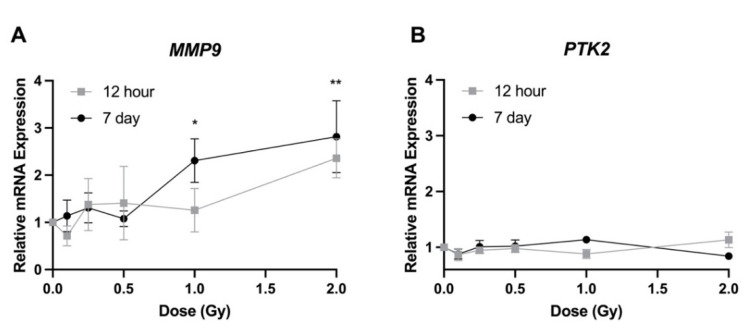
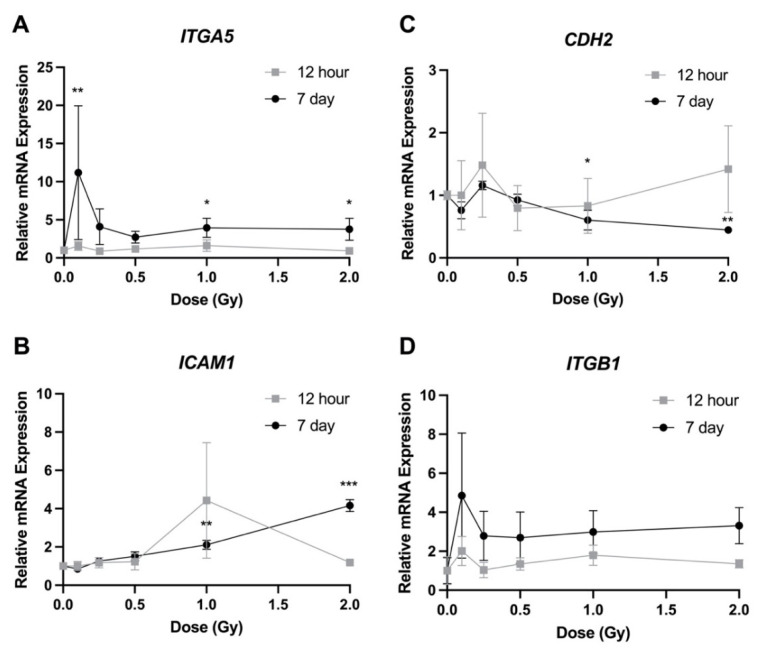
The lens of the eye is one of the most radiosensitive tissues. Although the exact mechanism of radiation-induced cataract development remains unknown, altered proliferation, migration, and adhesion have been proposed as factors. Lens epithelial cells were exposed to X-rays (0.1-2 Gy) and radiation effects were examined after 12 h and 7 day. Proliferation was quantified using an MTT assay, migration was measured using a Boyden chamber and wound-healing assay, and adhesion was assessed on three extracellular matrices. Transcriptional changes were also examined using RT-qPCR for a panel of genes related to these processes. In general, a nonlinear radiation response was observed, with the greatest effects occurring at a dose of 0.25 Gy. At this dose, a reduction in proliferation occurred 12 h post irradiation (82.06 ± 2.66%), followed by an increase at 7 day (116.16 ± 3.64%). Cell migration was increased at 0.25 Gy, with rates 121.66 ± 6.49% and 232.78 ± 22.22% greater than controls at 12 h and 7 day respectively. Cell adhesion was consistently reduced above doses of 0.25 Gy. Transcriptional alterations were identified at these same doses in multiple genes related to proliferation, migration, and adhesion. Overall, this research began to elucidate the functional changes that occur in lens cells following radiation exposure, thereby providing a better mechanistic understanding of radiation-induced cataract development.
Keywords: adhesion; cataract; ionizing radiation; lens epithelial cell; migration; proliferation.
Conflict of interest statement
The authors declare no conflict of interest.
Figures
Similar articles
-
Phenotypic and transcriptional changes in lens epithelial cells following acute and fractionated ionizing radiation exposure.Int J Radiat Biol. 2024;100(4):573-583. doi: 10.1080/09553002.2023.2295965. Epub 2024 Jan 30. Int J Radiat Biol. 2024. PMID: 38289679
-
The use of in vitro transcriptional data to identify thresholds of effects in a human lens epithelial cell-line exposed to ionizing radiation.Int J Radiat Biol. 2019 Feb;95(2):156-169. doi: 10.1080/09553002.2019.1539883. Epub 2018 Nov 29. Int J Radiat Biol. 2019. PMID: 30395761
-
Low-dose ionizing radiation: Effects on the proliferation and migration of lens epithelial cells via activation of the Wnt/β-catenin pathway.Mutat Res Genet Toxicol Environ Mutagen. 2023 May-Jun;888:503637. doi: 10.1016/j.mrgentox.2023.503637. Epub 2023 Apr 20. Mutat Res Genet Toxicol Environ Mutagen. 2023. PMID: 37188435
-
[IONIZING RADIATION AND THE RISK FOR CATARACT AND LENS OPACITIES].Harefuah. 2018 Oct;157(10):650-654. Harefuah. 2018. PMID: 30343544 Review. Hebrew.
-
Ionizing radiation induced cataracts: Recent biological and mechanistic developments and perspectives for future research.Mutat Res Rev Mutat Res. 2016 Oct-Dec;770(Pt B):238-261. doi: 10.1016/j.mrrev.2016.07.010. Epub 2016 Jul 29. Mutat Res Rev Mutat Res. 2016. PMID: 27919334 Review.
Cited by
-
Overexpression of FRA1 (FOSL1) Leads to Global Transcriptional Perturbations, Reduced Cellular Adhesion and Altered Cell Cycle Progression.Cells. 2023 Sep 24;12(19):2344. doi: 10.3390/cells12192344. Cells. 2023. PMID: 37830558 Free PMC article.
-
Exploring Angiotensin II and Oxidative Stress in Radiation-Induced Cataract Formation: Potential for Therapeutic Intervention.Antioxidants (Basel). 2024 Oct 8;13(10):1207. doi: 10.3390/antiox13101207. Antioxidants (Basel). 2024. PMID: 39456460 Free PMC article. Review.
-
Spatial Scattering Radiation to the Radiological Technologist during Medical Mobile Radiography.Bioengineering (Basel). 2023 Feb 16;10(2):259. doi: 10.3390/bioengineering10020259. Bioengineering (Basel). 2023. PMID: 36829753 Free PMC article.
-
miR-143 promotes cell proliferation, invasion and migration via directly binding to BRD2 in lens epithelial cells.Am J Transl Res. 2024 Feb 15;16(2):446-457. doi: 10.62347/BXFG4038. eCollection 2024. Am J Transl Res. 2024. PMID: 38463605 Free PMC article.
-
Evaluation of a New Real-Time Dosimeter Sensor for Interventional Radiology Staff.Sensors (Basel). 2023 Jan 3;23(1):512. doi: 10.3390/s23010512. Sensors (Basel). 2023. PMID: 36617110 Free PMC article.
References
-
- International Commission on Radiological Protection Recommendations of the ICRP. ICRP Publ. 26 Ann. ICRP. 1977;1:3. - PubMed
-
- International Commission on Radiological Protection Nonstochastic effects of ionizing radiation. ICRP Publ. 41 Ann. ICRP. 1984;14:3. - PubMed
-
- International Commission on Radiological Protection ICRP statement on tissue reactions/early and late effects of radiation in normal tissues and organs—Threshold doses for tissue reactions in a radiation protection context. ICRP Publ. 118 Ann. ICRP. 2012;41:1–2. - PubMed
Grants and funding
LinkOut - more resources
Full Text Sources
