

Ancestral SARS-CoV-2-specific T cells cross-recognize the Omicron variant
- PMID: 35042228
- PMCID: PMC8938268
- DOI: 10.1038/s41591-022-01700-x
Ancestral SARS-CoV-2-specific T cells cross-recognize the Omicron variant
Abstract
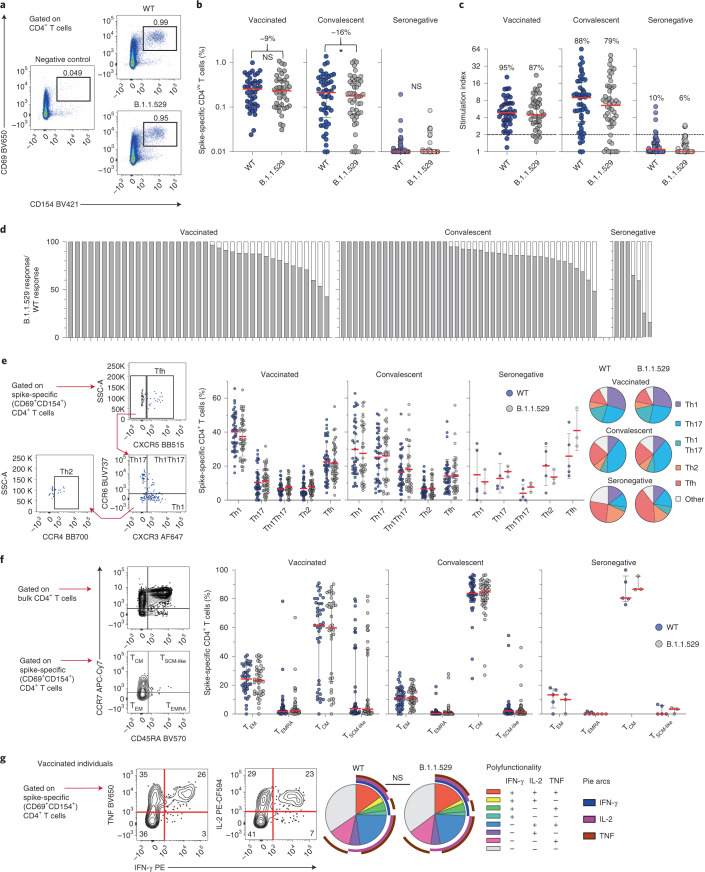
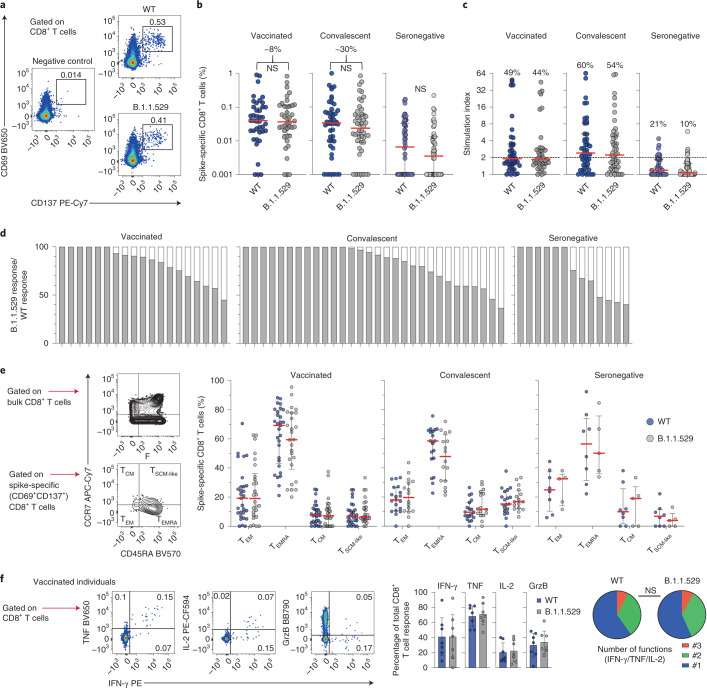
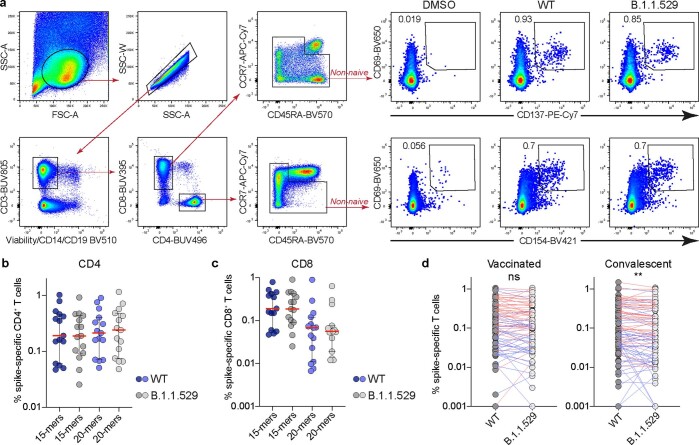
The emergence of the severe acute respiratory syndrome coronavirus 2 (SARS-CoV-2) Omicron (B.1.1.529) variant of concern (VOC) has destabilized global efforts to control the impact of coronavirus disease 2019 (COVID-19). Recent data have suggested that B.1.1.529 can readily infect people with naturally acquired or vaccine-induced immunity, facilitated in some cases by viral escape from antibodies that neutralize ancestral SARS-CoV-2. However, severe disease appears to be relatively uncommon in such individuals, highlighting a potential role for other components of the adaptive immune system. We report here that SARS-CoV-2 spike-specific CD4+ and CD8+ T cells induced by prior infection or BNT162b2 vaccination provide extensive immune coverage against B.1.1.529. The median relative frequencies of SARS-CoV-2 spike-specific CD4+ T cells that cross-recognized B.1.1.529 in previously infected or BNT162b2-vaccinated individuals were 84% and 91%, respectively, and the corresponding median relative frequencies for SARS-CoV-2 spike-specific CD8+ T cells were 70% and 92%, respectively. Pairwise comparisons across groups further revealed that SARS-CoV-2 spike-reactive CD4+ and CD8+ T cells were functionally and phenotypically similar in response to the ancestral strain or B.1.1.529. Collectively, our data indicate that established SARS-CoV-2 spike-specific CD4+ and CD8+ T cell responses, especially after BNT162b2 vaccination, remain largely intact against B.1.1.529.
© 2022. The Author(s).
Conflict of interest statement
A.S. is a consultant for Gritstone Bio, Flow Pharma, Arcturus Therapeutics, ImmunoScape, CellCarta, Avalia, Moderna, Fortress and Repertoire, and the La Jolla Institute has filed patents to protect various aspects of the T cell epitope and vaccine design work. S.A. has received honoraria from Gilead, AbbVie, MSD and Biogen and research grants from Gilead and AbbVie. M.B. is a consultant for Oxford Immunotec. The other authors declare no conflicts of interest.
Figures
Similar articles
-
Omicron BA.1 Mutations in SARS-CoV-2 Spike Lead to Reduced T-Cell Response in Vaccinated and Convalescent Individuals.Viruses. 2022 Jul 19;14(7):1570. doi: 10.3390/v14071570. Viruses. 2022. PMID: 35891550 Free PMC article.
-
SARS-CoV-2 spike glycoprotein-reactive T cells can be readily expanded from COVID-19 vaccinated donors.Immun Inflamm Dis. 2021 Dec;9(4):1452-1467. doi: 10.1002/iid3.496. Epub 2021 Jul 27. Immun Inflamm Dis. 2021. PMID: 34314576 Free PMC article.
-
The Third dose of CoronVac vaccination induces broad and potent adaptive immune responses that recognize SARS-CoV-2 Delta and Omicron variants.Emerg Microbes Infect. 2022 Dec;11(1):1524-1536. doi: 10.1080/22221751.2022.2081614. Emerg Microbes Infect. 2022. PMID: 35608053 Free PMC article.
-
Evolution of SARS-CoV-2-specific CD4+ T cell epitopes.Immunogenetics. 2023 Jun;75(3):283-293. doi: 10.1007/s00251-023-01295-8. Epub 2023 Jan 31. Immunogenetics. 2023. PMID: 36719467 Free PMC article. Review.
-
Act Early and at the Right Location: SARS-CoV-2 T Cell Kinetics and Tissue Localization.Int J Mol Sci. 2022 Sep 14;23(18):10679. doi: 10.3390/ijms231810679. Int J Mol Sci. 2022. PMID: 36142588 Free PMC article. Review.
Cited by
-
In-silico evaluation of the T-cell based immune response against SARS-CoV-2 omicron variants.Sci Rep. 2024 Oct 25;14(1):25413. doi: 10.1038/s41598-024-75658-w. Sci Rep. 2024. PMID: 39455652 Free PMC article.
-
Vaccine-Induced T-Cell and Antibody Responses at 12 Months after Full Vaccination Differ with Respect to Omicron Recognition.Vaccines (Basel). 2022 Sep 19;10(9):1563. doi: 10.3390/vaccines10091563. Vaccines (Basel). 2022. PMID: 36146641 Free PMC article.
-
Effectiveness of COVID-19 vaccination in healthcare workers in Shiga Prefecture, Japan.Sci Rep. 2022 Oct 21;12(1):17621. doi: 10.1038/s41598-022-22682-3. Sci Rep. 2022. PMID: 36271136 Free PMC article.
-
Pausing methotrexate prevents impairment of Omicron BA.1 and BA.2 neutralisation after COVID-19 booster vaccination.RMD Open. 2022 Oct;8(2):e002639. doi: 10.1136/rmdopen-2022-002639. RMD Open. 2022. PMID: 36216410 Free PMC article.
-
Dual spike and nucleocapsid mRNA vaccination confer protection against SARS-CoV-2 Omicron and Delta variants in preclinical models.Sci Transl Med. 2022 Sep 14;14(662):eabq1945. doi: 10.1126/scitranslmed.abq1945. Epub 2022 Sep 14. Sci Transl Med. 2022. PMID: 36103514 Free PMC article.
References
-
- Liu L. et al. Striking antibody evasion manifested by the Omicron variant of SARS-CoV-2. Nature10.1038/s41586-021-04388-0 (2021). - PubMed
-
- Goga, A., et al. Breakthrough COVID-19 infections during periods of circulating Beta, Delta and Omicron variants of concern, among health care workers in the Sisonke Ad26.COV2.S vaccine trial, South Africa. Preprint at medRxiv10.1101/2021.12.21.21268171 (2021).
Publication types
MeSH terms
Substances
Supplementary concepts
Grants and funding
- COV-LT2-0041/DH | National Institute for Health Research (NIHR)
- 75N93021C00016/AI/NIAID NIH HHS/United States
- 2019-00931/Karolinska Institutet (Karolinska Institute)
- 2020-02033/Vetenskapsrådet (Swedish Research Council)
- ALTF 1062-2020/European Molecular Biology Organization (EMBO)
- 20 0176 Pj/Cancerfonden (Swedish Cancer Society)
- 75N9301900065/U.S. Department of Health and Human Services (U.S. Department of Health & Human Services)
- 2019-00969/Karolinska Institutet (Karolinska Institute)
- 2020-06121; 2021-04779; 2020-05926; 2018-02330/Vetenskapsrådet (Swedish Research Council)
- SLS-883252/Svenska Läkaresällskapet (Swedish Society of Medicine)
- PR2020-0072/Barncancerfonden (Swedish Childhood Cancer Foundation)
LinkOut - more resources
Full Text Sources
Other Literature Sources
Medical
Research Materials
Miscellaneous
