

Significant improvement of apple (Malus domestica Borkh.) transgenic plant production by pre-transformation with a Baby boom transcription factor
- PMID: 35039859
- PMCID: PMC8795818
- DOI: 10.1093/hr/uhab014
Significant improvement of apple (Malus domestica Borkh.) transgenic plant production by pre-transformation with a Baby boom transcription factor
Abstract
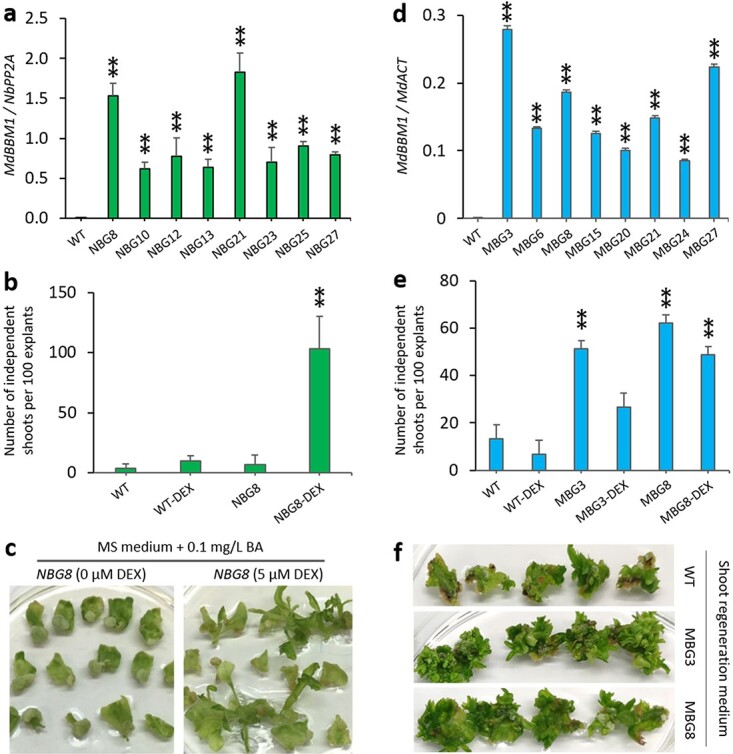
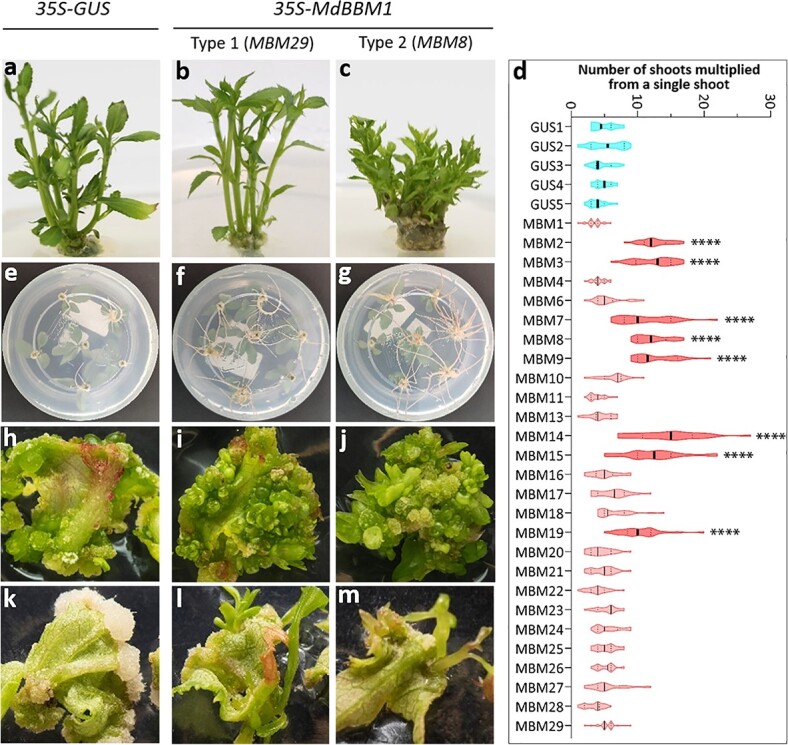
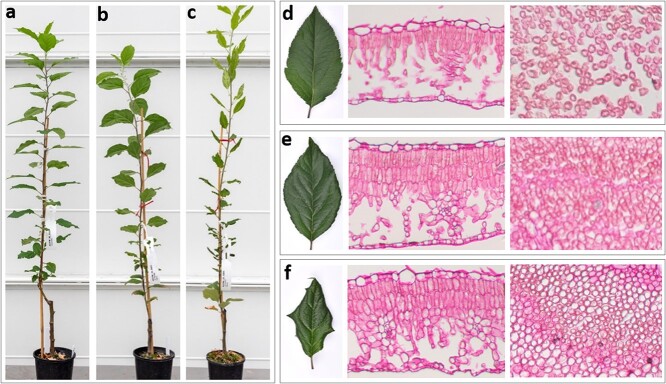
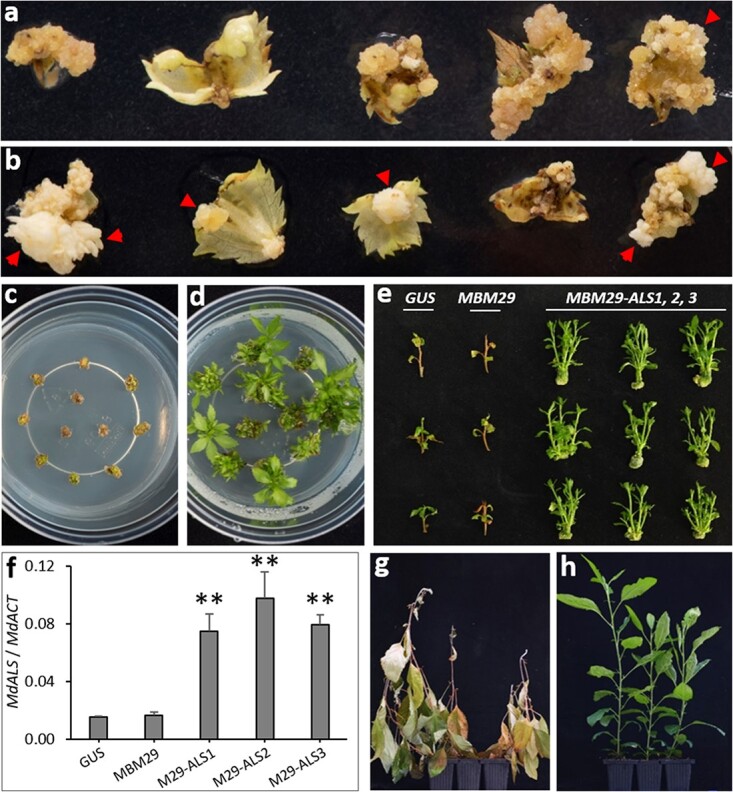
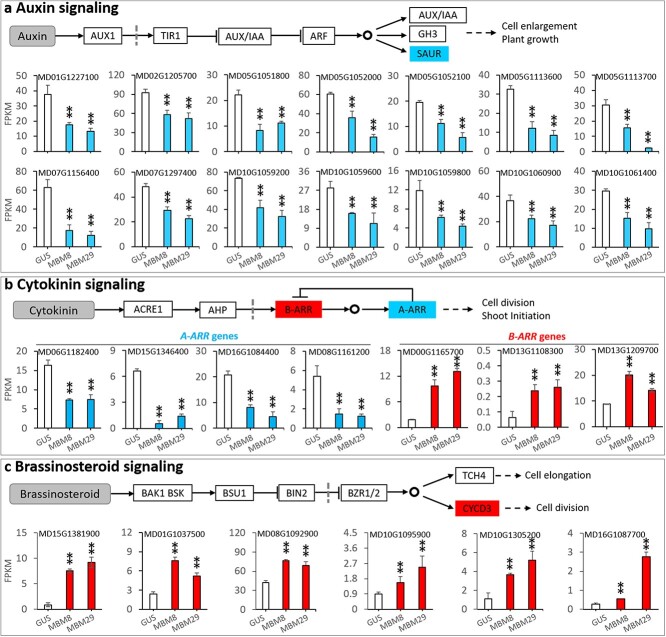
BABY BOOM (BBM) is a member of the APETALA2/ETHYLENE RESPONSE FACTOR (AP2/ERF) family and its expression has been shown to improve herbaceous plant transformation and regeneration. However, this improvement has not been shown clearly for tree species. This study demonstrated that the efficiency of transgenic apple (Malus domestica Borkh.) plant production was dramatically increased by ectopic expression of the MdBBM1 gene. "Royal Gala" apple plants were first transformed with a CaMV35S-MdBBM1 construct (MBM) under kanamycin selection. These MBM transgenic plants exhibited enhanced shoot regeneration from leaf explants on tissue culture media, with most plants displaying a close-to-normal phenotype compared with CaMV35S-GUS transgenic plants when grown under greenhouse conditions, the exception being that some plants had slightly curly leaves. Thin leaf sections revealed the MBM plants produced more cells than the GUS plants, indicating that ectopic-expression of MdBBM1 enhanced cell division. Transcriptome analysis showed that mRNA levels for cell division activators and repressors linked to hormone (auxin, cytokinin and brassinosteroid) signalling pathways were enhanced and reduced, respectively, in the MBM plants compared with the GUS plants. Plants of eight independent MBM lines were compared with the GUS plants by re-transforming them with an herbicide-resistant gene construct. The number of transgenic plants produced per 100 leaf explants was 0-3% for the GUS plants, 3-8% for five MBM lines, and 20-30% for three MBM lines. Our results provided a solution for overcoming the barriers to transgenic plant production in apple, and possibly in other trees.
Keywords: Apple (M. domestica); Baby Boom (BBM); Plant hormone response; Shoot regeneration; Transformation.
© The Author(s) 2022. Published by Oxford University Press. All rights reserved.
Figures
Similar articles
-
Regeneration of transgenic plants from the commercial apple cultivar Royal Gala.Plant Cell Rep. 1995 Apr;14(7):407-12. doi: 10.1007/BF00234044. Plant Cell Rep. 1995. PMID: 24185446
-
Agrobacterium-mediated transformation of apple (Malus x domestica Borkh.): an assessment of factors affecting regeneration of transgenic plants.Plant Cell Rep. 1996 Mar;15(7):549-54. doi: 10.1007/BF00232992. Plant Cell Rep. 1996. PMID: 24178471
-
Ectopic expression of class 1 KNOX genes induce adventitious shoot regeneration and alter growth and development of tobacco (Nicotiana tabacum L) and European plum (Prunus domestica L).Plant Cell Rep. 2011 Apr;30(4):655-64. doi: 10.1007/s00299-010-0993-7. Epub 2011 Jan 7. Plant Cell Rep. 2011. PMID: 21212958
-
In vitro tissue culture of apple and other Malus species: recent advances and applications.Planta. 2019 Apr;249(4):975-1006. doi: 10.1007/s00425-019-03100-x. Epub 2019 Feb 20. Planta. 2019. PMID: 30788577 Review.
-
BABY BOOM (BBM): a candidate transcription factor gene in plant biotechnology.Biotechnol Lett. 2018 Dec;40(11-12):1467-1475. doi: 10.1007/s10529-018-2613-5. Epub 2018 Oct 8. Biotechnol Lett. 2018. PMID: 30298388 Review.
Cited by
-
Genome editing of apple SQUAMOSA PROMOTER BINDNG PROTEIN-LIKE 6 enhances adventitious shoot regeneration.Plant Physiol. 2023 Feb 12;191(2):840-843. doi: 10.1093/plphys/kiac570. Plant Physiol. 2023. PMID: 36494099 Free PMC article. No abstract available.
-
Time-Course Responses of Apple Leaf Endophytes to the Infection of Gymnosporangium yamadae.J Fungi (Basel). 2024 Feb 3;10(2):128. doi: 10.3390/jof10020128. J Fungi (Basel). 2024. PMID: 38392801 Free PMC article.
-
Recent Developments and Strategies for the Application of Agrobacterium-Mediated Transformation of Apple Malus × domestica Borkh.Front Plant Sci. 2022 Jun 30;13:928292. doi: 10.3389/fpls.2022.928292. eCollection 2022. Front Plant Sci. 2022. PMID: 35845652 Free PMC article. Review.
-
Establishment of in vitro regeneration system and molecular analysis of early development of somatic callus in Capsicum chinense and Capsicum baccatum.Front Plant Sci. 2022 Nov 17;13:1025497. doi: 10.3389/fpls.2022.1025497. eCollection 2022. Front Plant Sci. 2022. PMID: 36466290 Free PMC article.
-
Current status and trends in forest genomics.For Res (Fayettev). 2022 Aug 31;2:11. doi: 10.48130/FR-2022-0011. eCollection 2022. For Res (Fayettev). 2022. PMID: 39525413 Free PMC article. Review.
References
-
- James DJ, Passey AJ, Barbara DJet al. . Genetic transformation of apple (Malus pumila mill.) using a disarmed Ti-binary vector. Plant Cell Rep. 1989;7:658–61. - PubMed
-
- Yao J-L, Cohen D, Atkinson Ret al. . Regeneration of transgenic plants from the commercial apple cultivar Royal Gala. Plant Cell Rep. 1995;14:407–12. - PubMed
-
- Yao J-L, Tomes S, Gleave AP. Transformation of apple (Malus × domestica) using mutants of apple acetolactate synthase as a selectable marker and analysis of the T-DNA integration sites. Plant Cell Rep. 2013;32:703–14. - PubMed
-
- Mourgues F, Chevreau E, Lambert Cet al. . Efficient agrobacterium-mediated transformation and recovery of transgenic plants from pear (Pyrus communis L.). Plant Cell Rep. 1996;16:245–9. - PubMed
LinkOut - more resources
Full Text Sources
Research Materials
