. 2022 Feb 22;50(3):1465-1483.
doi: 10.1093/nar/gkab1300.

53BP1-ACLY-SLBP-coordinated activation of replication-dependent histone biogenesis maintains genomic integrity

Affiliations

53BP1-ACLY-SLBP-coordinated activation of replication-dependent histone biogenesis maintains genomic integrity

TingTing Wu et al. Nucleic Acids Res. .

Abstract

p53-binding protein 1 (53BP1) regulates the DNA double-strand break (DSB) repair pathway and maintains genomic integrity. Here we found that 53BP1 functions as a molecular scaffold for the nucleoside diphosphate kinase-mediated phosphorylation of ATP-citrate lyase (ACLY) which enhances the ACLY activity. This functional association is critical for promoting global histone acetylation and subsequent transcriptome-wide alterations in gene expression. Specifically, expression of a replication-dependent histone biogenesis factor, stem-loop binding protein (SLBP), is dependent upon 53BP1-ACLY-controlled acetylation at the SLBP promoter. This chain of regulation events carried out by 53BP1, ACLY, and SLBP is crucial for both quantitative and qualitative histone biogenesis as well as for the preservation of genomic integrity. Collectively, our findings reveal a previously unknown role for 53BP1 in coordinating replication-dependent histone biogenesis and highlight a DNA repair-independent function in the maintenance of genomic stability through a regulatory network that includes ACLY and SLBP.


Figures

Figure 1.
Figure 1.
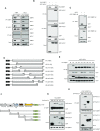
53BP1 interacts with ACLY and promotes ACLY activity. (A) Immunoprecipitations (IPs) with anti-53BP1, anti-ACLY, or control IgG antibodies were carried out using extracts from 53BP1+/+ or 53BP1−/− MEFs (left) and control or 53BP1-depleted HeLa cells (right). Western blots were conducted using the indicated antibodies. (B) Co-IPs and western blot analysis of overexpressed HA-53BP1 and GFP-ACLY in HEK293T cells. Antibodies used for IPs and western blots are indicated. (C) A GST pulldown assay was carried out using GST or GST-tagged N-terminus of the 53BP1 fusion protein (GST-53BP1-N) and recombinant ACLY protein. The in vitro interaction of ACLY with GST-53BP1-N was validated by western blotting using an anti-ACLY antibody. Note that GST-53BP1-N migrates to a position where a dimer would be expected. (D) A schematic of the HA-tagged N-terminal S/T-Q motif of 53BP1 (H1) and seven deletion mutants (H2-H8) is shown. (E) HEK293T cells were co-transfected with the indicated HA-tagged 53BP1 constructs along with the GFP-tagged ACLY construct. Cell lysates were then subjected to IPs and western blots using indicated antibodies. (F) A schematic of GFP-ACLY (full length) and a series of deletion mutants is shown. (G) Co-IPs and western blot analyses of the interactions between GFP-ACLY deletion mutants and HA-53BP1 in HEK293T cells. (H) A GST pulldown assay was carried out using recombinant GST-53BP1-N and total cell lysates from WT GFP-ACLY or GFP-ACLY deletion mutants (D3 and D4) transfected HEK293T cells.
Figure 2.
Figure 2.
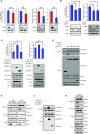
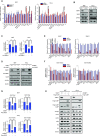
53BP1 positively regulates the ACLY activity by promoting the interaction between ACLY and NDPK. (A) The ACLY enzyme activity and the level of acetyl-CoA were measured in whole cell extracts made of control siRNA- and 53BP1 siRNA-transfected HeLa cells (left) or 53BP1+/+ and 53BP1−/− MEFs (right). The results are shown as the mean ± SD (n = 3), ** P < 0.01, Student's t-test. (B) The ACLY enzyme activity and the level of acetyl-CoA were measured in whole cell extracts made of control siRNA-, ACLY siRNA-, and 53BP1 siRNA-transfected HeLa cells. The results are shown as the mean ± SD (n = 3), ** P < 0.01, Student's t-test. (C) HA-tagged N-terminus (HA-53BP1-N) or C-terminus (HA-53BP1-C) of 53BP1 was expressed in HEK293T cells along with GFP-ACLY. The ACLY enzyme activity and the level of acetyl-CoA were then measured after 48h. The results are shown as the mean ± SD (n = 3), ∗∗P < 0.01. ns, not significant, Student's t-test. (D) HA-53BP1, WT GFP-ACLY, GFP-ACLY H760A, HA-NDPK, and NDPK siRNA were transfected into HeLa cells with the indicated combinations. Co-IPs using the anti-GFP antibody were performed and the following western blot analyses were done using anti-ACLY or anti-phospho-histidine antibodies. (E) ACLY was immunoprecipitated from control or 53BP1 siRNA-transfected HeLa cells (left) and 53BP1+/+ or 53BP1−/− MEF cell extracts (right). Phosphorylation of ACLY was analyzed using an anti-phospho-histidine antibody. (F) HA-53BP1-N or HA-53BP1-C was overexpressed in HEK293T cells along with GFP-ACLY. Co-IPs using an anti-GFP antibody was performed and analyzed by western blots using anti-ACLY or anti-phospho-histidine antibodies. (G) HeLa cells were transfected with control or 53BP1 siRNA for 48 h. IPs were conducted using an anti-NDPK antibody or an anti-ACLY antibody and western blot analyses were done using the indicated antibodies.
Figure 3.
Figure 3.
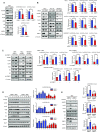
53BP1 regulates global histone acetylation. (A) Total cell extracts from 53BP1+/+ and 53BP1−/− MEFs were analyzed for total and acetylated histones by western blotting using the indicated antibodies. Quantitation of acetylated histones was done by normalizing to total histone/α-tubulin (please refer to materials and methods for details of the procedure). (B) Western blot analyses of total and acetylated histones in HeLa, HCT116, and HEK293T cells with control or 53BP1 knockdown. Quantitation of acetylated histone was done by normalizing to total histone/α-tubulin. The results are shown as the mean ± SD (n = 3), ∗∗P < 0.01, Student's t-test. (C) HA-53BP1 was reconstituted in 53BP1−/− MEFs, 53BP1-depleted HeLa and HEK293T cells by overexpression for 48 h. Histone acetylation and total amounts of histones were analyzed using the indicated antibodies. Quantitation of acetylated histone was done by normalizing to total histone/α-tubulin. The results are shown as the mean ± SD (n = 3), ∗∗P < 0.01, Student's t-test. (D) 53BP1+/+ and 53BP1−/− MEFs were starved by serum depletion for 16 h and subsequently stimulated with 10% fetal bovine serum-containing media for the indicated time points. Total cell lysates were analyzed for total and acetylated histones by western blotting using the indicated antibodies. Quantitation of acetylated histone was done by normalizing to total histone/α-tubulin. The results are shown as the mean ± SD (n = 3). (E) 53BP1+/+ and 53BP1−/− MEFs were cultured for 48 h in the presence or absence of 25 mM glucose. Total cell lysates were analyzed by western blotting using the indicated antibodies. Quantitation of acetylated histone was done by normalizing to total histone/α-tubulin. The results are shown as the mean ± SD (n = 3), ∗∗P < 0.01. ns, not significant, Student's t-test.
Figure 4.
Figure 4.
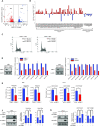
53BP1 is important for the histone gene expression. (A) Differential gene expression analysis of 53BP1+/+ and 53BP1−/− MEFs using RNA-seq. The X-axis in the volcano plot indicates fold changes of gene expression in 53BP1+/+ and 53BP1−/− MEFs and the Y-axis indicates log value of FDR-adjusted p-values. FDR cutoff 0.1 and fold change cutoff 2 were used to highlight differential gene expression in the analysis. (B) Fold-changes (log2) of the polyadenylated replication-dependent and replication-independent histone gene families in the RNA-seq data from 53BP1+/+ and 53BP1−/− MEFs. (C) Cell cycle distribution in 53BP1+/+ and 53BP1−/− MEFs. G0/G1, S, and G2/M indicate cell cycle phases. (D) Total RNAs from 53BP1+/+ and 53BP1−/− MEFs (left) or control siRNA- and 53BP1 siRNA-transfected HeLa cells (right) were analyzed for the expression of histone mRNAs by RT-qPCR using random-priming. Western blots show the level of 53BP1 in cells used in these experiments. The results are shown as the mean ± SD (n = 3). (E) Absolute quantitation of histone transcripts from select histone genes was conducted using 53BP1+/+, 53BP1−/− MEFs and 53BP1 depleted-HeLa cells by RT-qPCR. The results are shown as the mean ± SD (n = 3), ∗∗P < 0.01, Student's t-test. (F and G) RT-qPCR analyses of Hist1h2ac and Hist1h2bg transcripts in 53BP1+/+, 53BP1−/−, and 53BP1-reconstituted 53BP1−/− MEFs (F). The same analyses for HIST1H2AC and HIST1H2BD transcripts were performed in control, 53BP1 depleted-HeLa cells with or without reconstitution of 53BP1 (G). The results are shown as the mean ± SD (n = 3), ∗∗P < 0.01. ns, not significant, Student's t-test.
Figure 5.
Figure 5.
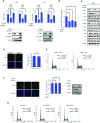
53BP1 regulates the expression of SLBP and affects histone biogenesis. (A) RT-qPCR analysis of representative genes known for their function in histone mRNA biogenesis. Total RNAs from 53BP1+/+ and 53BP1−/− MEFs (left) or control and 53BP1 siRNA-transfected HeLa cells (right) were used. The results are shown as the mean ± SD (n = 3), ∗∗P < 0.01, Student's t-test. (B) Western blot analyses of SLBP expression using 53BP1+/+ and 53BP1−/− MEFs or control siRNA- and 53BP1 siRNA-transfected HeLa cells. CPSF3 is a known processing factor for histone gene expression and was used as a control. (C) Relative measurement of SLBP mRNA expression was done by RT-qPCR in 53BP1+/+, 53BP1−/−, and 53BP1-reconstituted 53BP1−/− MEFs or control, 53BP1-depleted HeLa cells, and 53BP1-depleted HeLa cells with 53BP1 reconstitution. The results are shown as the mean ± SD (n = 3), ∗∗P < 0.01, Student's t-test. (D) 53BP1 was reconstituted in 53BP1−/− MEFs or 53BP1-depleted HeLa cells and the changes of SLBP expression were analyzed by western blotting. (E and F) 53BP1 was knocked down in the indicated human immortalized or cancer cell lines by siRNA. 48 h after transfection, the levels of SLBP and 53BP1 mRNA (E), and HIST1H2AC and HIST1H2BD mRNA (F) were analyzed by RT-qPCR. The results are shown as the mean ± SD (n = 3). ns, not significant, Student's t-test. (G) RT-qPCR analysis of HIST1H2AC and HIST1H2BG/D mRNAs in 53BP1+/+, 53BP1−/−, and SLBP-reconstituted 53BP1−/− MEFs (left), or control, 53BP1 depleted-HeLa cells, and SLBP-reconstituted 53BP1 knockdown HeLa cells (right). The results are shown as the mean ± SD (n = 3), ∗∗P < 0.01, Student's t-test. (H) Analysis of total and acetylated histones H2B, H3 and H4 by western blotting in SLBP-reconstituted 53BP1−/− MEFs or 53BP1-depleted HeLa cells with SLBP reconstitution.
Figure 6.
Figure 6.
53BP1 positively regulates the SLBP expression by altering the acetylation status of the SLBP promoter. (A) Chromatin immunoprecipitation (ChIP)-qPCR analysis of the SLBP and CPSF3 promoters in 53BP1+/+ and 53BP1−/− MEFs (left) or control and 53BP1 siRNA-transfected HeLa cells (right). ChIP-qPCR was performed using antibodies to acetylated histone H3 (Ac-H3) and H4 (Ac-H4). Data represent ChIP enrichment relative to input. The results are shown as the mean ± SD (n = 3), ∗∗P < 0.01, Student's t-test. (B and C) The levels of SLBP mRNA (B) and protein (C) in MEF cells transfected with control siRNA-, 53BP1 siRNA-, or ACLY siRNA in the indicated combinations. The results are shown as the mean ± SD (n = 3), ∗∗P < 0.01, Student's t-test. (D) 53BP1+/+ and 53BP1−/− MEFs were stained with propidium iodide and the DNA content was analyzed by flow cytometry. G0/G1, S, and G2/M indicate cell cycle phases. (E) The number of 53BP1+/+ and 53BP1−/− MEFs in the S-phase was detected by EdU incorporation assay. EdU staining (red) for S-phase cells. Hoechst staining (blue) for the cell nuclei. Lower panel shows quantification of the percentage of EdU-positive cells. The results are shown as the mean ± SD (n = 3). ns, not significant, Student's t-test. (F) Cell cycle profiles of control, 53BP1-, and ACLY-depleted HeLa cells obtained by flow cytometry. (G) The S-phase cells of control, 53BP1-, and ACLY-depleted HeLa cells were stained by EdU incorporation. Lower panel shows the percentage of EdU-positive cells. Data are presented as mean ± SD (n = 3). Student's t-test was used. ns, not significant, Student's t-test.
Figure 7.
Figure 7.
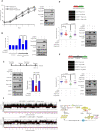
53BP1-ACLY-SLBP regulatory axis contributes to S-phase progression and genomic integrity. (A) Proliferation of control (siCtrl), 53BP1-depleted (si53BP1) HeLa cells, and 53BP1-depleted HeLa cells with SLBP overexpression was monitored by live cell imaging for 5 days. The results are shown as the mean ± SD (n = 3), ∗∗P < 0.01, Student's t-test. (B) The indicated siRNA and/or vector-transfected HeLa cells were treated with aphidicolin to arrest cells in S-phase. Then cells were incubated with colcemid-containing medium to release from the arrest and to trap in M-phase. Cell cycle profiles were measured by flow cytometry. The results are shown as the mean ± SD (n = 3), ∗∗P < 0.01, Student's t-test. (C) The experimental design for S-phase synchronization (top) is shown. The indicated siRNA and/or vector-transfected HeLa cells were synchronized at S-phase through a two-step thymidine block. Total cell extracts were prepared and analyzed by western blotting using the indicated antibodies (bottom). (D) Replication elongation rates of control, 53BP1-depleted, and Flag-SLBP-reconstituted/53BP1-depleted HeLa cells were measured. Each cell was treated with CIdU (red) and IdU (green) for 40 min each and the IdU track length of CIdU-positive fibers was measured. Data represent mean ± SD (n = 3). P values between indicated samples were calculated using a Mann-Whitney test. (E) Replication fork restart of control, 53BP1-depleted, SLBP-reconstituted 53BP1-depleted HeLa cells was measured. Pulse-labelling of cells with CIdU, HU (hydroxyurea), and IdU was done as shown in the schematic of experiment. DNA fibers were counted by contiguous IdU and CIdU tracks. Data represent mean ± SD (n = 3). P values between indicated samples were calculated using a Mann-Whitney test. (F) Array CGH profiles of clones derived from 53BP1−/− MEFs (top), 53BP1−/− MEF with SLBP-reconstitution (bottom) are shown. Chromosomal regions above or below the dotted line indicate amplifications or deletions of genomic regions, respectively. (G) A model of the newly characterized role for 53BP1 in quantitative and qualitative histone homeostasis. The interaction between 53BP1 and ACLY enhances histidine phosphorylation of ACLY by NDPK, leading to increased expression of SLBP, which then influences histone mRNA processing and production of new histones. This pathway is critical for S-phase progression and chromosomal stability.

Similar articles

Cited by

References

    1. Botuyan M.V., Lee J., Ward I.M., Kim J.E., Thompson J.R., Chen J., Mer G.. Structural basis for the methylation state-specific recognition of histone H4-K20 by 53BP1 and crb2 in DNA repair. Cell. 2006; 127:1361–1373. - PMC - PubMed
    1. Fradet-Turcotte A., Canny M.D., Escribano-Diaz C., Orthwein A., Leung C.C., Huang H., Landry M.C., Kitevski-LeBlanc J., Noordermeer S.M., Sicheri F.et al. .. 53BP1 is a reader of the DNA-damage-induced H2A lys 15 ubiquitin mark. Nature. 2013; 499:50–54. - PMC - PubMed
    1. Chapman J.R., Barral P., Vannier J.B., Borel V., Steger M., Tomas-Loba A., Sartori A.A., Adams I.R., Batista F.D., Boulton S.J.. RIF1 is essential for 53BP1-dependent nonhomologous end joining and suppression of DNA double-strand break resection. Mol. Cell. 2013; 49:858–871. - PMC - PubMed
    1. Escribano-Diaz C., Orthwein A., Fradet-Turcotte A., Xing M., Young J.T., Tkac J., Cook M.A., Rosebrock A.P., Munro M., Canny M.D.et al. .. A cell cycle-dependent regulatory circuit composed of 53BP1-RIF1 and BRCA1-CtIP controls DNA repair pathway choice. Mol. Cell. 2013; 49:872–883. - PubMed
    1. Ochs F., Somyajit K., Altmeyer M., Rask M.B., Lukas J., Lukas C.. 53BP1 fosters fidelity of homology-directed DNA repair. Nat. Struct. Mol. Biol. 2016; 23:714–721. - PubMed

Publication types

MeSH terms

Substances