. 2021 Dec;1(12):1162-1174.
doi: 10.1038/s43587-021-00146-z. Epub 2021 Dec 20.

Telomerase Reverse Transcriptase Preserves Neuron Survival and Cognition in Alzheimer's Disease Models

Affiliations

Telomerase Reverse Transcriptase Preserves Neuron Survival and Cognition in Alzheimer's Disease Models

Hong Seok Shim et al. Nat Aging. 2021 Dec.

Abstract

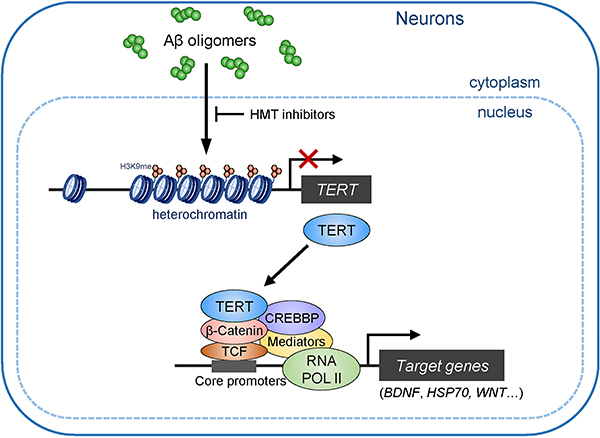
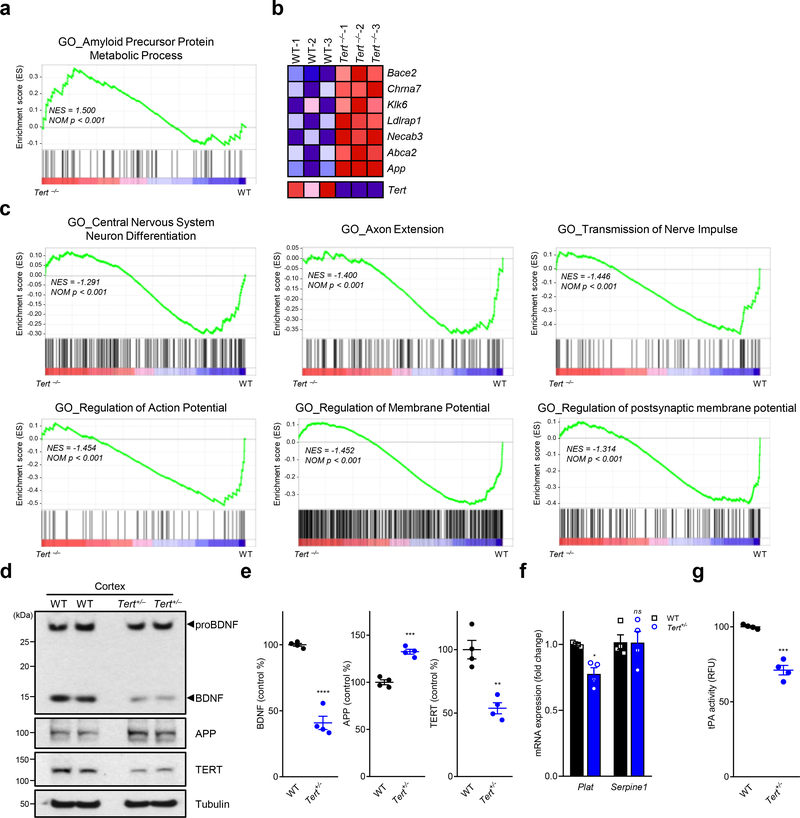
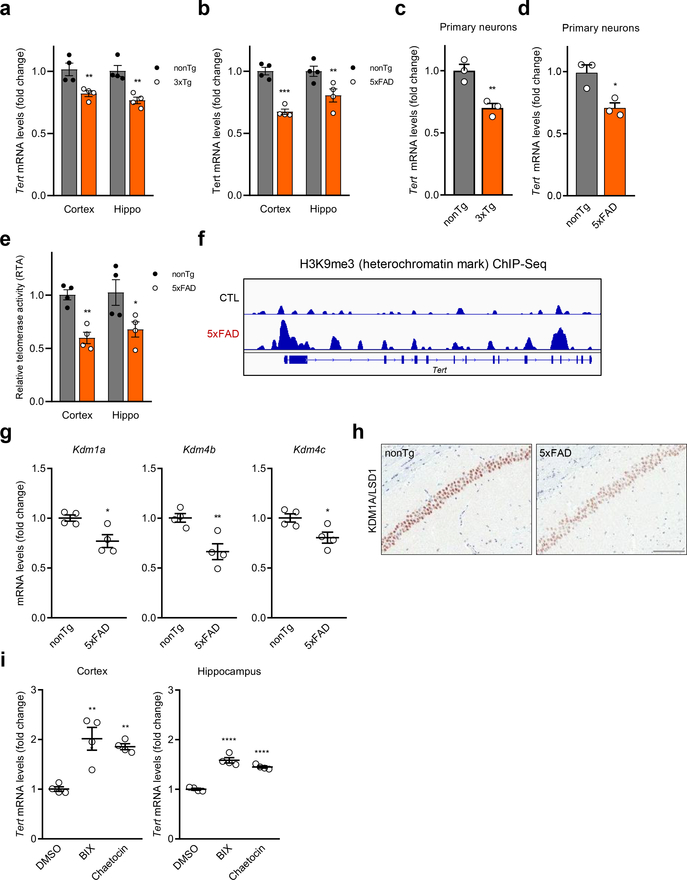
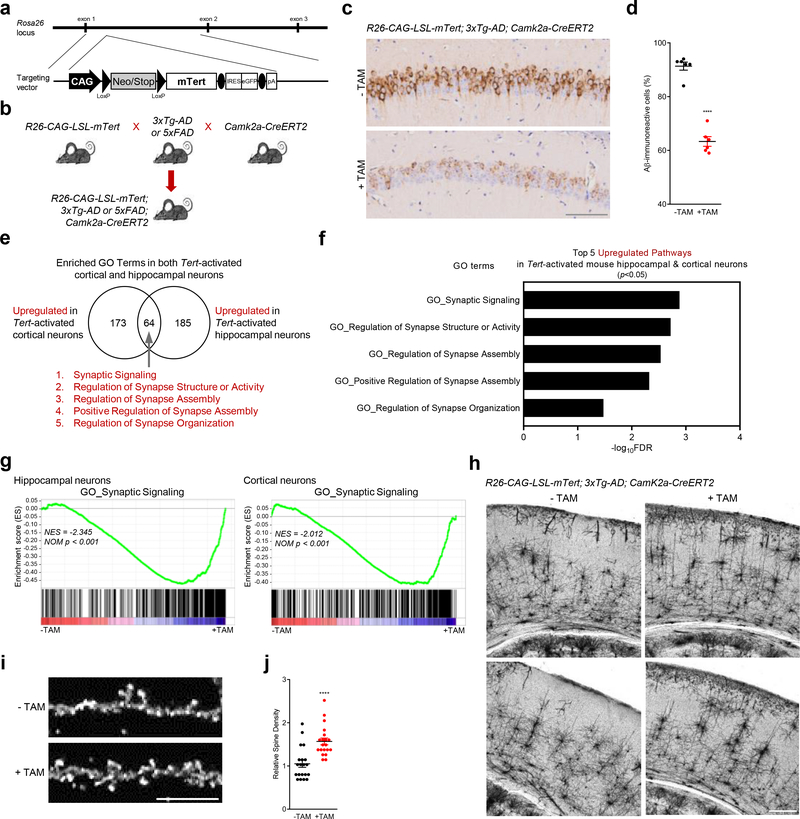
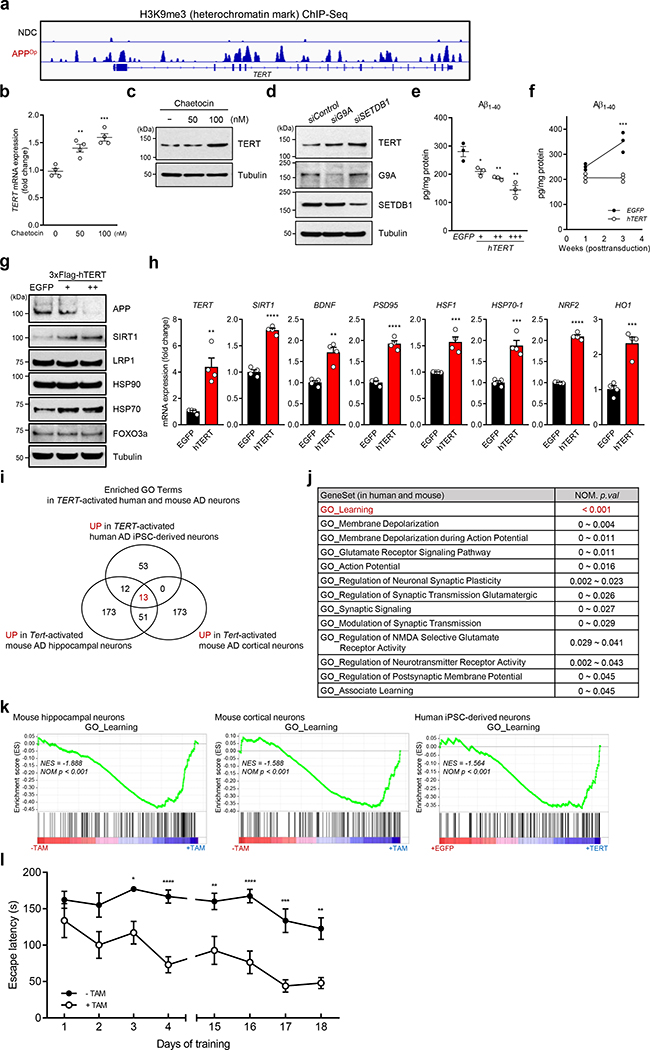
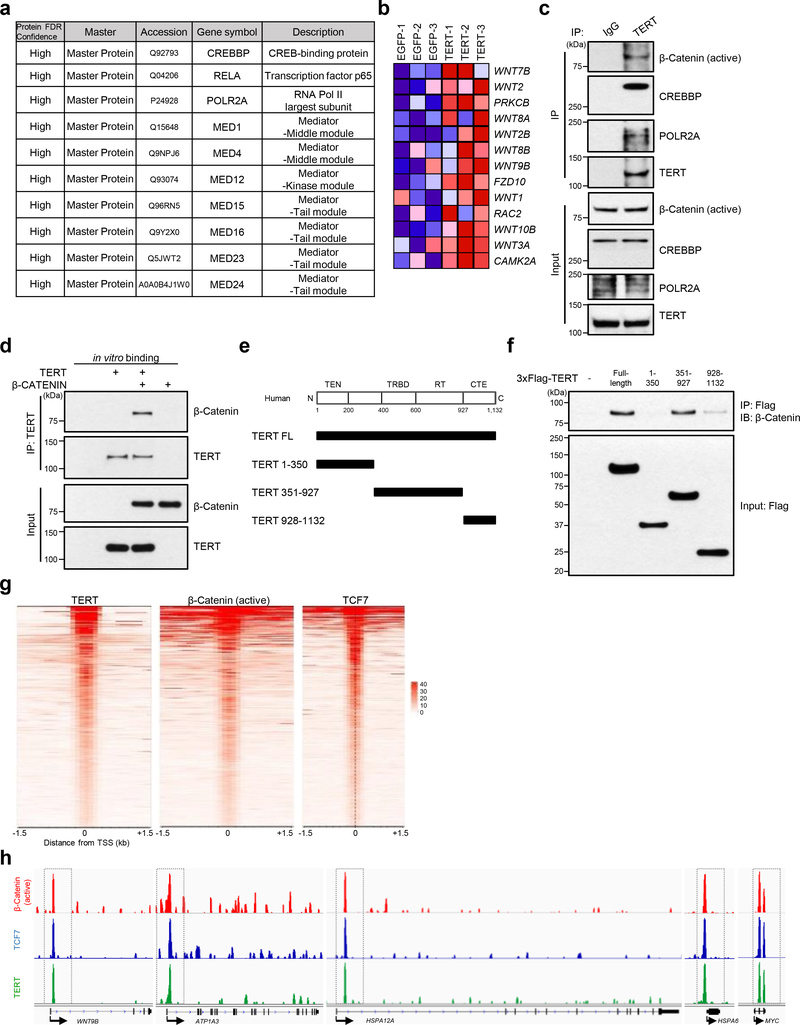
Amyloid-induced neurodegeneration plays a central role in Alzheimer's disease (AD) pathogenesis. Here, we show that telomerase reverse transcriptase (TERT) haploinsufficiency decreases BDNF and increases amyloid-β (Aβ) precursor in murine brain. Moreover, prior to disease onset, the TERT locus sustains accumulation of repressive epigenetic marks in murine and human AD neurons, implicating TERT repression in amyloid-induced neurodegeneration. To test the impact of sustained TERT expression on AD pathobiology, AD mouse models were engineered to maintain physiological levels of TERT in adult neurons, resulting in reduced Aβ accumulation, improved spine morphology, and preserved cognitive function. Mechanistically, integrated profiling revealed that TERT interacts with β-catenin and RNA polymerase II at gene promoters and upregulates gene networks governing synaptic signaling and learning processes. These TERT-directed transcriptional activities do not require its catalytic activity nor telomerase RNA. These findings provide genetic proof-of-concept for somatic TERT gene activation therapy in attenuating AD progression including cognitive decline.


Figures

Extended Data Fig. 1:
Extended Data Fig. 1:. Mouse primary cortical and hippocampal neuronal culture and gene expression profile of histone methyltransferases and demethylases in 5xFAD neurons.
a, Brightfield images of primary hippocampal and cortical neurons isolated from 5xFAD last-stage embryos (E18.5). b, Immunoblots for full-length APP and oligomeric amyloid-β in primary cortical and hippocampal neurons from 5xFAD and non-transgenic control mice at 1, 8, 14 and 21 DIV. A tubulin was used as a loading control. Experiments in a-b were repeated three times independently with similar results. c, d, mRNA expression levels of each histone methyltransferase (c) or demethylase (d) in cortical and hippocampal neurons isolated from 5xFAD and non-transgenic control mice at 2~3-month-old. Transcript levels were normalized to Hprt1 mRNA (n = 3 per group). e, Quantification of KDM1A staining intensity in the CA1 hippocampal subfield of 5xFAD and wildtype littermate control mice (n = 4 per group, p = 0.0003). Data are mean ± s.e.m. ***P < 0.001; ns, not significant (two-tailed unpaired t-test).
Extended Data Fig. 2:
Extended Data Fig. 2:. Generation of Cre-inducible Tert knock-in mouse (R26-CAG-LSL-mTert).
a, Genotyping results of the original ES targeted lines carrying the R26-CAG-LSL-mTert-IRES-eGFP-pA alleles. b, Representative photographs of chimeric mice obtained from targeted ES cells. c, Aβ immunostaining in the hippocampus of adult (7-month-old) control and Tert-activated R26-CAG-LSL-mTert; 5xFAD; Camk2a-CreERT2 mice. Experiments were repeated three times independently with similar results. Scale bar, 300 μm.
Extended Data Fig. 3:
Extended Data Fig. 3:. The effects of TERT induction on neuroinflammation associated with activation of astrocytes and microglia.
a, Immunohistochemical staining for the astrocytic marker GFAP in the CA1 hippocampal subfield of adult control and Tert-activated R26-CAG-LSL-mTert; 3xTg-AD; Camk2a-CreERT2 mice. Scale bar, 100 μm. b, Quantitative comparison of GFAP-positive astrocytes in the hippocampus (n = 4 per group, 8-month-old, p = 0.0177). c, IBA-1 immunostaining in the CA1 hippocampal subfield of adult control and Tert-activated R26-CAG-LSL-mTert; 3xTg-AD; Camk2a-CreERT2 mice. Scale bar, 100 μm. d, Quantification of IBA1-positive activated microglia in the mouse hippocampus (n = 4 per group, p = 0.0015). Data are mean ± s.e.m. *P < 0.05, **P < 0.01 (two-tailed unpaired t-test).
Extended Data Fig. 4:
Extended Data Fig. 4:. Significantly up- or downregulated genes identified in RNA-Seq of Tert-activated R26-CAG-LSL-mTert; 3xTg-AD; Camk2a-CreERT2 mouse neurons.
a, mRNA levels of Tert and Terc in control and Tert-activated neurons isolated from R26-CAG-LSL-mTert; 3xTg-AD; Camk2a-CreERT2 mouse brains (n = 4 per group; p = 0.0391, p > 0.9999, respectively). b, mRNA levels of significantly downregulated genes in Tert-activated neurons compared to control (n = 4 per group; p = 0.0089, p = 0.0001, p = 0.0031, p = 0.0002, p = 0.0375, p = 0.0462, p = 0.0714, p = 0.0011, p = 0.0084, p = 0.0002, p = 0.0498, p = 0.0015, p = 0.002, p = 0.0438, respectively). c, mRNA levels of significantly upregulated genes in Tert-activated neurons compared to control (n = 4 per group; p = 0.0029, p = 0.0026, p = 0.0048, p = 0.0019, p = 0.0024, p = 0.0129, p = 0.0154, p = 0.0036, p = 0.0032, p = 0.0044, p = 0.0005, p = 0.0311, p = 0.01, p = 0.0063, p = 0.0063, p = 0.0225, p = 0.0005, p = 0.0403, p = 0.0129, respectively). d,e, Validation of App and ApoE mRNA (d) and protein (e) expression levels in the mouse brains of control (-TAM) and Tert-activated (+TAM) R26-CAG-LSL-mTert; 3xTg-AD; Camk2a-CreERT2 mice by quantitative RT-PCR (n = 4 per group; p = 0.0134, p = 0.0061, respectively) and immunoblotting. Data are mean ± s.e.m. *P < 0.05, **P < 0.01, ***P < 0.001; ns, not significant (two-tailed unpaired t-test).
Extended Data Fig. 5:
Extended Data Fig. 5:. Tert expression in mouse adult neurons and neural stem cells as well as during neuronal maturation.
a, Mouse brain section showing the subventricular zone (SVZ) and cerebral cortex (Cx) for harvesting NSCs and neurons. Scale bar, 500 μm. b, mRNA levels of Tert gene in neural stem cells (NSCs) and neurons isolated from the brains of R26-CAG-LSL-mTert; 3xTg-AD; Camk2a-CreERT2 mouse with or without tamoxifen treatment (n = 7 (NSCs), 5 (neurons), 7 (neurons + TAM group); p < 0.0001, p = 0.0033, respectively). c, Tert mRNA levels during neuronal maturation of primary cortical and hippocampal neurons from 3xTg-AD mice at 1, 8, 14 and 21 DIV (n = 6 per group; day 1 vs. day 21: p < 0.0001). Data are mean ± s.e.m. **P < 0.01, ****P < 0.0001 (two-tailed unpaired t-test).
Extended Data Fig. 6:
Extended Data Fig. 6:. Sixty-four (64) pathways activated in both mouse cortical and hippocampal neurons isolated from TERT-AD mice upon Tert activation.
Boxplots showing the Tert-induced fold changes of all the upregulated coding genes in Tert-activated cortical (Mouse_C) and hippocampal (Mouse_H) neurons isolated from R26-CAG-LSL-mTert; 3xTg-AD; Camk2a-CreERT2 mouse brains compared to each untreated and matched control group. For all box plots, each dot represents the average value of differentially expressed gene found in the comparison; centre lines denote medians; box limits denote 25th–75th percentile (Q1-Q3); whiskers are drawn up to the smallest or largest observed value that is still within 1.5 times the interquartile range below the first quartile or above the third quartile, respectively; all other observed points are plotted as outliers. p values were calculated by two-tailed Student’s t test.
Extended Data Fig. 7:
Extended Data Fig. 7:. TERT levels in NDC- and APPDp-derived neurons, cloning of wild-type and catalytically inactive Flag-hTERT lentiviral vector and quantification of immunoblots shown in Fig.4.
a,b, TERT mRNA (a) and protein (b) levels in the neurons derived from NDC- and APPDp-derived iPSCs. c, Quantification of immunoblots in Fig. 4d. The values were normalized to respective control band intensity (n = 3; TERT: p = 0.0053, p = 0.0007, respectively, G9A: p < 0.0001, p < 0.0001, respectively, SETDB1: p < 0.0001, p < 0.0001, respectively). d, Schematic of wild-type Flag-tagged human TERT lentiviral expression construct. e, Immunoblots for the confirmation of 3xFlag-TERT expression in HEK293 cells. A tubulin was used as a loading control. Experiments were repeated three times independently with similar results. f, Quantification of immunoblots in Fig. 4g (n = 3 per group; APP: p = 0.0024, p < 0.0001, respectively, SIRT1: p = 0.0006, p = 0.0002, respectively, HSP70: p = 0.0228, p = 0.0037, respectively). Data are mean ± s.e.m. *P < 0.05, **P < 0.01, ***P < 0.001, ****P < 0.0001; ns, not significant (two-tailed unpaired t-test (a) or two-way ANOVA with Tukey’s multiple comparisons test (c,f)). g, Schematic of catalytically inactive (CI) human TERT lentiviral expression construct. The white asterisk indicates the position of the single mutation D712A, which renders the protein catalytically inactive. h, Immunoblots for the confirmation of Flag-tagged catalytically inactive TERT expression in HEK293 cells. A tubulin was used as a loading control. Experiments were repeated three times independently with similar results. i, mRNA expression levels of each gene indicated in EGFP-, wildtype (WT) TERT- or catalytically inactive (CI) TERT-transduced APPDp neurons (n = 4; EGFP vs. WT and EGFP vs. CI: TERT: p = 0.0003, p = 0.0003, respectively, SIRT1: p = 0.0031, p = 0.0014, respectively, BDNF: p = 0.0001, p < 0.0001, respectively, PSD95: p = 0.0081, p = 0.0021, respectively, HSF1: p = 0.0014, p = 0.0005, respectively, HSP70–1: p = 0.0041, p = 0.0006, respectively, NRF2: p = 0.0053, p = 0.0052, respectively, HO1: p = 0.0024, p = 0.0005, respectively). Transcript levels were normalized to HPRT1 mRNA. Data are mean ± s.e.m. **P < 0.01, ***P < 0.001, ****P < 0.0001; ns, not significant (two-way ANOVA with Tukey’s multiple comparisons test)
Extended Data Fig. 8:
Extended Data Fig. 8:. Thirteen (13) pathways activated in mouse cortical and hippocampal AD neurons as well as in human iPSC-derived APPDp neurons upon TERT activation.
Violin plots showing the TERT-induced fold changes of all the upregulated coding genes in Tert-activated cortical neurons (Mouse_C) and hippocampal neurons (Mouse_H) isolated from R26-CAG-LSL-mTert; 3xTg-AD; Camk2a-CreERT2 mouse brains as well as TERT-activated human iPSC-derived APPDp neurons (Human) compared to each matched control group.
Extended Data Fig. 9:
Extended Data Fig. 9:. TERT contributes to β-Catenin/TCF-mediated transactivation in AD neurons.
At the early pathological stage of AD, amyloid-β (Aβ) oligomers induce the transcriptional repression of TERT gene via the propagation of heterochromatin in neurons. Genetic depletion and pharmacological inhibition of H3K9 methyltransferases (HMTs) can de-repress TERT gene suppression. TERT protein is able to interact with RNA pol II core transactivation machinery through β-Catenin and triggers the transcriptional induction of specific genes associated with neuronal survival and synaptic function in AD neurons, enabling to alleviate cognitive deficits.
Fig. 1.
Fig. 1.. Tert insufficiency enhances APP and reduces mature BDNF levels in mouse brains.
a, Gene set enrichment analysis (GSEA) plots showing relative upregulation of APP metabolic process genes in the cerebral cortex of Tert–/– (TertLSL/LSL) G1 mouse brain relative to wildtype controls (n = 3 per group). b, RNA-Seq heat map of genes involved in APP metabolic process in wildtype and Tert–/– mouse brain (p < 0.001). c, GSEA plots showing downregulated Gene Ontology pathways in the hippocampus of Tert–/– mouse brain relative to wildtype controls. GSEA in a-c was based on the two-sided Kolmogorov-Smirnov statistic, and nominal p values unadjusted for multiple comparisons were calculated from 1,000 iterations of permutation on sample labels. d, Immunoblots for the indicated endogenous proteins in wildtype (C57BL/6) or Tert heterozygous Tert+/– (Tert+/LSL) mouse cerebral cortex. A tubulin was used as a loading control. e, Quantitative comparison of BDNF, APP and TERT levels in the immunoblots (n = 4 per group; p < 0.001, p = 0.001, p = 0.0016, respectively, two-tailed unpaired t-test). f, mRNA levels of the tPA gene Plat and the PAI-1 gene Serpine1 in the neurons isolated from mouse hippocampus and cerebral cortex (n = 4 per group; p = 0.0306, p = 0.9993, respectively, two-way ANOVA with Sidak’s multiple comparisons test). g, tPA proteolytic activity in the mouse hippocampus and cerebral cortex (n = 4 per group; p = 0.0001, two-tailed unpaired t-test). Data are mean ± s.e.m. *P < 0.05, **P < 0.01, ***P < 0.001, ****P < 0.0001; ns, not significant.
Fig. 2.
Fig. 2.. Downregulation of Tert via H3K9me3-dependent heterochromatin in two distinct AD mouse models.
a, Tert mRNA levels in the cortex and hippocampus of 3xTg-AD and wildtype control (B6;129S) mice (n = 4, 3-month-old; nonTg vs. 3xTg-AD: p = 0.007, p = 0.0017, respectively, two-way ANOVA with Sidak’s multiple comparisons test). b, Tert mRNA levels in the cortex and hippocampus of 5xFAD and wildtype littermate control (B6;SJL) mice (n = 4, 2~3-month-old; nonTg vs. 5xFAD: p = 0.0001, p = 0.0074, respectively, two-way ANOVA with Sidak’s multiple comparisons test). c, Tert mRNA levels in primary neurons isolated from 3xTg-AD and control mice at DIV 14 (n = 3, p = 0.0089, two-tailed unpaired t-test). d, Tert mRNA levels in primary neurons isolated from 5xFAD and control mice at DIV 14 (n = 3, p = 0.0198, two-tailed unpaired t-test). e, Telomerase activity in cortical and hippocampal neurons isolated from 5xFAD and control mice (n = 4, 2~3-month-old; nonTg vs. 5xFAD: p = 0.0067, p = 0.0173, respectively, two-way ANOVA with Sidak’s multiple comparisons test). f, Representative view of H3K9me3 repressive histone mark occupancy in Tert gene of 5xFAD and control mouse primary neurons at DIV 14. g, mRNA levels of histone demethylase Kdm1a, Kdm4b, and Kdm4c genes in cortical and hippocampal neurons of 5xFAD and wildtype littermate control mice (n = 4, 2~3-month-old; p = 0.0178, p = 0.0094, p = 0.0289, respectively, two-tailed unpaired t-test). h, Representative images of KDM1A immunostaining in the CA1 hippocampal subfield of 5xFAD and wildtype littermate control mice (2~3-month-old). Experiments were repeated three times independently with similar results. Scale bar, 100 μm. i, Tert mRNA levels in the cortex and hippocampus of 5xFAD mice treated with chaetocin or BIX-01294 (n = 4, 2~3-month-old; DMSO vs. inhibitor: cortex: p = 0.0015, p = 0.0036, respectively, hippocampus: p < 0.0001, p < 0.0001, respectively, two-way ANOVA with Tukey’s multiple comparisons test). Data are mean ± s.e.m. *P < 0.05, **P < 0.01, ***P < 0.001, ****P < 0.0001.
Fig. 3.
Fig. 3.. TERT activation not only alleviates amyloid pathology but enhances synaptic pathways and neural networks in AD mouse model.
a, Targeting strategy for the generation of CAG-LSL-mTert-IRES-eGFP-polyA knock-in mice. b, Breeding strategy of R26-CAG-LSL-mTert with 3xTg-AD or 5xFAD and Camk2a-CreERT2 mice. c, Aβ immunostaining in the CA1 hippocampal subfield of adult (8-month-old) control and Tert-activated R26-CAG-LSL-mTert; 3xTg-AD; Camk2a-CreERT2 mice. Scale bar, 100 μm. d, Quantitative comparison of Aβ-immunoreactive pyramidal neurons in the CA1 regions (n = 6 per group, 8-month-old; p < 0.0001, two-way ANOVA with Tukey’s multiple comparisons test). e, Venn diagram showing intersections of upregulated biological processes based on the RNA-Seq results from Tert-activated cortical and hippocampal neurons of R26-CAG-LSL-mTert; 3xTg-AD; Camk2a-CreERT2 mice compared with control groups. f, Top 5 overlapping pathways upregulated in both Tert-activated cortical and hippocampal neurons. g, Gene Set Enrichment Analysis (GSEA) plots showing relative upregulation of synaptic signaling genes in Tert-activated cortical and hippocampal neurons by comparison with control neurons. GSEA was based on the two-sided Kolmogorov-Smirnov statistic, and nominal p values unadjusted for multiple comparisons were calculated from 1,000 iterations of permutation on sample labels. h, Representative images of Golgi-stained cortical neurons from aged (18 months) control and Tert-activated R26-CAG-LSL-mTert; 3xTg-AD; Camk2a-CreERT2 mice (n = 4 independent biological replicates per group). Experiments were repeated four times independently with similar results. Scale bar, 250 μm. i, High magnification of dendritic spines in impregnated pyramidal cortical neurons of aged control and Tert-activated R26-CAG-LSL-mTert; 3xTg-AD; Camk2a-CreERT2 mice. Scale bar, 10 μm. j, Quantification of dendritic spine density (n = 5 dendrites per mouse, n = 4 mice per group, 18-month-old; p < 0.0001, two-tailed unpaired t-test). Data are mean ± s.e.m. ****P < 0.0001.
Fig. 4.
Fig. 4.. TERT activation alleviates amyloid pathology in human iPSC-derived neurons and ameliorates learning and memory deficits in AD.
a, H3K9me3 repressive histone mark occupancy in TERT gene of neurons from APPDp patient- and non-demented control (NDC) individual-derived iPSCs. b, c, TERT mRNA levels (b, n = 4; 0 vs. each concentration: p = 0.0038, p = 0.0005, respectively, two-way ANOVA with Tukey’s multiple comparisons test) and TERT protein levels (c) in chaetocin-treated human iPSC-derived APPDp neurons. d, TERT protein levels in human iPSC-derived APPDp neurons treated with siRNAs targeting histone methyltransferase genes, G9A or SETDB1 (n = 3 independent biological replicates per group). e, f, Aβ1–40 levels measured by ELISA in EGFP- or TERT-transduced iPSC-derived APPDp neurons (n = 3; EGFP vs. hTERT: p = 0.0251, p = 0.007, p = 0.0049, respectively, two-tailed unpaired t-test (e) and week 3: p = 0.0001, two-way ANOVA with Sidak’s multiple comparisons test (f)). g, Immunoblots for the indicated endogenous proteins in EGFP- or TERT-transduced iPSC-derived APPDp neurons (n = 3 independent biological replicates per group). h, Relative gene expression by qRT-PCR in EGFP- or TERT-transduced iPSC-derived APPDp neurons (n = 4; EGFP vs. hTERT: p = 0.0025, p < 0.0001, p = 0.0013, p < 0.0001, p = 0.001, p = 0.0005, p < 0.0001, p = 0.0006, respectively, two-tailed unpaired t-test). i, Venn diagram showing intersections of upregulated biological processes based on three (3) independent RNA-Seq results from Tert-activated mouse cortical and hippocampal neurons of R26-CAG-LSL-mTert; 3xTg-AD; Camk2a-CreERT2 mice (n = 4 for each group) and TERT-activated human iPSC-derived APPDp neurons (n = 3) compared with each control group (all p < 0.05). j, List of 13 overlapping pathways upregulated in all Tert-activated mouse cortical and hippocampal AD neurons and TERT-activated human iPSC-derived APPDp neurons. k, GSEA plots showing relative upregulation of learning-related genes in Tert-activated cortical and hippocampal AD neurons and TERT-activated human iPSC-derived APPDp neurons by comparison with each control group. GSEA in i-k was based on the two-sided Kolmogorov-Smirnov statistic, and nominal p values unadjusted for multiple comparisons were calculated from 1,000 iterations of permutation on sample labels. l, Escape latency of aged (22~26 months) control and Tert-activated R26-CAG-LSL-mTert; 3xTg-AD; Camk2a-CreERT2 mice in the Barnes maze over training days (n = 9 for each group; day 3: p = 0.0251, day 4: p < 0.0001, day 15: p = 0.0078, day 16: p < 0.0001, day 17: p = 0.0001, day 18: p = 0.0022, two-way ANOVA with Sidak’s multiple comparisons test). Experiments in d and g were repeated three times independently with similar results. Data are mean ± s.e.m. *P < 0.05, **P < 0.01, ***P < 0.001, ****P < 0.0001.
Fig. 5.
Fig. 5.. TERT interacts with β-Catenin-containing transactivation complex and is recruited to the promoters of specific target genes in AD neurons.
a, List of TERT-interacting proteins identified by mass spectrometry in human iPSC-derived APPDp neurons. b, RNA-Seq heat map of WNT signaling pathway genes in EGFP- and TERT-transduced human iPSC-derived APPDp neurons (n = 3). c, Co-immunoprecipitation of endogenous β-Catenin (active), CREBBP, POLR2A, and TERT from human iPSC-derived APPDp neurons. d, In vitro binding assay between human TERT and β-Catenin. e, Schematic of full-length and truncated forms of human TERT. The upper panel represents four domains of TERT protein as the TERT N-terminal (TEN) domain, the TERT-specific RNA-binding domain (TRBD), the reverse transcriptase (RT) domain and the C-terminal extension (CTE)/thumb domain. f, Co-immunoprecipitation of endogenous β-Catenin with the full-length and truncated forms of 3xFlag-TERT. g, ChIP-Seq density heat maps of TERT, β-Catenin (active) and TCF7 across the gene promoters of human iPSC-derived APPDp neurons. h, Chromatin-state maps showing β-Catenin (active), TCF7 and TERT binding peaks for the WNT9B, ATP1A3, HSPA12A, HSPA6, and MYC locus, as determined by ChIP-Seq. Experiments in c, d and f were repeated three times independently with similar results.

Comment in

Similar articles

Cited by

References

    1. Huang YD & Mucke L Alzheimer Mechanisms and Therapeutic Strategies. Cell 148, 1204–1222, doi:10.1016/j.cell.2012.02.040 (2012). - DOI - PMC - PubMed
    1. Selkoe DJ & Hardy J The amyloid hypothesis of Alzheimer’s disease at 25years. Embo Mol Med 8, 595–608, doi:DOI 10.15252/emmm.201606210 (2016). - DOI - PMC - PubMed
    1. Iaccarino HF et al. Gamma frequency entrainment attenuates amyloid load and modifies microglia. Nature 540, 230–+, doi:10.1038/nature20587 (2016). - DOI - PMC - PubMed
    1. Naslund J et al. Correlation between elevated levels of amyloid beta-peptide in the brain and cognitive decline. Jama-J Am Med Assoc 283, 1571–1577, doi:DOI 10.1001/jama.283.12.1571 (2000). - DOI - PubMed
    1. Tarasoff-Conway JM et al. Clearance systems in the brain-implications for Alzheimer disease. Nat Rev Neurol 11, 457–470, doi:10.1038/nrneurol.2015.119 (2015). - DOI - PMC - PubMed

Publication types