. 2021 Dec 28;25(1):103702.
doi: 10.1016/j.isci.2021.103702. eCollection 2022 Jan 21.

Transposable element activation promotes neurodegeneration in a Drosophila model of Huntington's disease

Affiliations

Transposable element activation promotes neurodegeneration in a Drosophila model of Huntington's disease

Assunta Maria Casale et al. iScience. .

Abstract

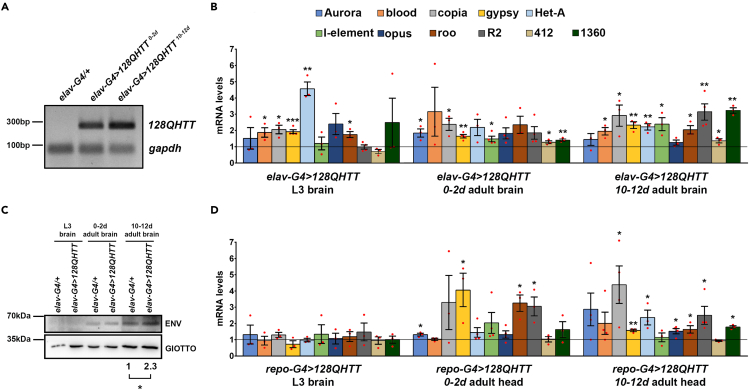
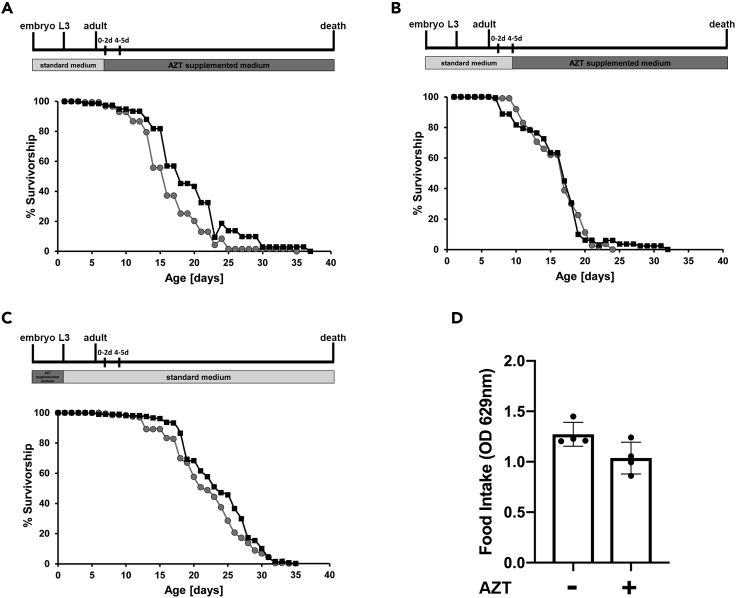
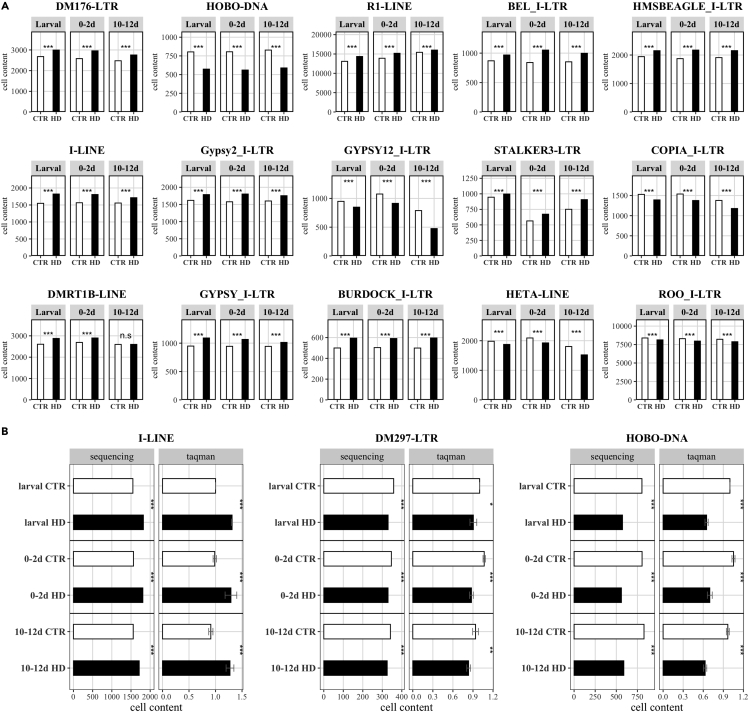
Huntington's disease (HD) is an autosomal dominant disorder with progressive motor dysfunction and cognitive decline. The disease is caused by a CAG repeat expansion in the IT15 gene, which elongates a polyglutamine stretch of the HD protein, Huntingtin. No therapeutic treatments are available, and new pharmacological targets are needed. Retrotransposons are transposable elements (TEs) that represent 40% and 30% of the human and Drosophila genomes and replicate through an RNA intermediate. Mounting evidence suggests that mammalian TEs are active during neurogenesis and may be involved in diseases of the nervous system. Here we show that TE expression and mobilization are increased in a Drosophila melanogaster HD model. By inhibiting TE mobilization with Reverse Transcriptase inhibitors, polyQ-dependent eye neurodegeneration and genome instability in larval brains are rescued and fly lifespan is increased. These results suggest that TE activation may be involved in polyQ-induced neurotoxicity and a potential pharmacological target.

Keywords: Biological sciences; Molecular biology; Neuroscience.


Conflict of interest statement

The authors declare no competing interests.

Figures

None
Graphical abstract
Figure 1
Figure 1
Neuronal and glial expression of 128QHtt results in transposable element derepression (A) Semiquantitative RT-PCR analysis to assess the induction levels of the HD transgenic construct by elav-Gal4. cDNA was prepared from total RNA purified from HD (elav-G4>128QHtt) and control (elav-G4/+) head tissues. The constitutive gapdh was examined as an endogenous control. (B) qRT-PCR analysis of transposable element expression in larval and adult brains of flies expressing 128QHtt in neurons (elav-G4>128QHtt); adult brains were analyzed at both young (0–2 days) and aged (10–12 days) time points; transcript levels were normalized to rp49 and displayed as fold change relative to flies carrying the elav-Gal4 driver with no 128QHtt transgene (elav-G4/+). (C) Western blot assay of gypsy envelope protein (ENV) expression in HD larval and adult brains. GIOTTO protein was used as a loading control. Result was expressed as means for at least three independent biological replicates (∗p < 0.05; one-sample t test). (D) qRT-PCR analysis of TE expression in larval brains and adult heads isolated from 0- to 2-day-old and 10- to 12-day-old flies expressing 128QHtt with the pan-glial repo-Gal4 driver (repo-Gal4>128QHtt). Transcript levels were normalized to gapdh and displayed as fold change relative to flies carrying the repo-Gal4 driver with no128QHtt transgene (repo-G4/+). (B and D) Bar graph represents the mean ± SEM from at least three independent experiments (∗p < 0.05, ∗∗p < 0.01, ∗∗∗p < 0.001; unpaired t tests). Red dots indicate individual data points. The black horizontal line indicates the fold change control value, set to 1. See also Figures S1–S3.
Figure 2
Figure 2
Global heterochromatin relaxation mediates HD-induced TE activation (A) Transposon DNA sequences show decreased H3K9me3 levels in HD. The relative fold enrichment, normalized to the heterochromatic F22 control region, was calculated by dividing the amount of immunoprecipitated DNA from elav-G4>128QHtt heads by that from the control (elav-G4/+). Bars represent mean ± SEM of three independent experiments performed in duplicate (∗p < 0.05, ∗∗p < 0.01, ∗∗∗p < 0.01; unpaired t tests). The gray area represents the control value set to 1. (B) HP1 and Su(var)3–9 are genetic modifiers of HD eye phenotype. GMR-driven HP1 overexpression (GMR-Gal4>HP1OE;128QHtt) or GMR driven Su(var)3–9 overexpression (GMR-Gal4>Su(var)3–9OE;128QHtt) strongly prevents HD-induced eye neurodegeneration. GMR-G4/+ was used as control. The lower graph represents the phenotypic scores of each indicated genotype. The phenotypic scores are concordant with the visual assessment of the eye phenotypes. The number of images used for this analysis ranged from 7 to 17 (∗∗p < 0.01, ∗∗∗p < 0.001; one-way ANOVA with Tukey's post hoc test). (C) Survival curves of control (elav-Gal4/+) and HD flies (elav-Gal4>128QHtt) overexpressing HP1 or Su(var)3–9. The log rank test with Bonferroni correction for multiple comparisons indicates a significant difference between all survival curves (∗∗∗p < 0.001), except for elav-G4/+ vs elav-G4>Su(var)3–9OE;128QHtt lifespan curves (p = 1). (D) Mutant Htt suppresses BL2 PEV. Histochemical staining for β-galactosidase activity in larval brains isolated from HD (elav-G4/Tp(3;Y)BL2; UAS-128QHtt, right panel) and control (elav-G4/Tp(3;Y)BL2, left panel) male larvae. Scale bar indicates 100 μm. Scatter plot indicates the quantitative analysis of X-gal staining intensities. Data are the means ± SD. The dots indicate individual data points (∗∗∗p < 0.01; unpaired t tests). See also Figures S3, S4, and S6.
Figure 3
Figure 3
Treatment with reverse transcriptase inhibitors rescues HD eye phenotype and prevents HD-induced genome instability (A) 3TC and AZT treatments significantly improve the altered HD eye-phenotype. Transgenic flies expressing GMR-Gal4>128QHtt and treated with 3TC at 1 mg/mL or AZT at 5 mg/mL for the entire development period show a significant improvement of the polyQ-induced neurodegenerative phenotype relative to untreated flies. GMR-G4/+ was used as control. The right graph indicates the phenotypic scores of each genotype. The phenotypic scores are concordant with the visual assessment of the eye phenotypes. The number of images used for this analysis ranged from 5 to 6 (∗p < 0.05, ∗∗p < 0.01, ∗∗∗p < 0.001; one-way ANOVA with Tukey's post hoc test). (B) Mitotic chromosomes from third instar larval HD brains stained with DAPI. HD chromosomes show a higher degree of chromatin decondensation and structural rearrangements (see arrows for examples) when compared with the control. Scale bar indicates 5 μm. (C) Quantification of chromosomal abnormalities observed in HD larval brains (∗∗p < 0.01, ∗∗∗p < 0.001; Chi-square test with Bonferroni correction). (D) Confocal microscopy images showing immunofluorescence against γH2Av on HD (elav-Gal4>128QHtt) and control (elav-Gal4/+) larval brains. Images were captured at 63X magnification. Scale bar indicates 10 μm. (E) Bar graph represents mitotic index (percentage of cells in mitosis per optical field, at 40X magnification) observed in the brains of HD and control larvae treated with or not with AZT (∗∗∗p < 0.001; one-way ANOVA with Tukey's post hoc test). See also Figure S7.
Figure 4
Figure 4
AZT treatment is more effective in rescuing median lifespan only when it is administered in the larval and early adult stage (A and B) Survival curves of elav-Gal4>128QHtt flies untreated (gray circles) or treated with AZT (black squares) starting at 0–2 (A) or 4–5 days (B) following eclosion. The survival curves shown in (A) are significantly different (∗∗∗p < 0.001; log rank test). In (B) the survival difference is not statistically significant (p = 0.68; log rank test). (C) Survival curves of elav-Gal4>128QHtt flies untreated (gray circles) or treated with AZT (black squares) from eggs hatch to postfeeding larval stage. The log rank test showed that the two curves were significantly different (∗∗p < 0.01; log rank test). The schemes at the top represent an outline of experimental strategy. Lifespan experiment was conducted with at least 150–200 flies per condition. (D) AZT supplementation does not affect solid food intake in elav-Gal4>128QHtt HD flies. Food intake was quantified by spectrophotometric absorbance measurements (OD 629 nm) (p = 0.06; unpaired t tests). See also Figures S8, S10, and S11.
Figure 5
Figure 5
TE copy number according to sequencing analyses and TaqMan CNV assay (A) Fifteen top significant TEs at the 0–2 days stage. Cell content of each TE has been calculated at larval, 0–2 days, and 10–12 days for both CTR and HD samples. The top15 significant TEs at 0–2 days stage (the pathogenetic one) are here represented. All the top15 TEs are classified as retrotransposons (LINE and LTR elements) except for HOBO, a DNA transposon. Of the 15 reported TEs, ten showed a higher cell TE content in HD than CTR 0–2 days sample (DM176, R1, BEL_I, HMSBEAGLE_I, I-element, Gypsy2_I, STALKER-3, DMRT1B, GYPSY_I, and BURDOCK_I). The cell TE content reported on y axis has been calculated counting the reads mapping against each TE RepBase consensus and normalizing on the total number of sequenced reads and multiplied by 1,000,000 (∗∗∗ FDR< 0.001, two proportions Z-test with Benjamin-Hochberg FDR correction). (B) Validation of the TE copy number by TaqMan CNV assay. The I-element (retrotransposon) assay fully confirmed the sequencing results highlighting higher content of I-element in HD samples than CTR samples, in all the 3 time points (left). TaqMan CNV assay and sequencing analyses showed concordant significant results for DM297 element (middle) (retrotransposon). TaqMan CNV assay displayed a lower CNV of HOBO (DNA transposon) in HD than control samples in all the 3 time points confirming sequencing results (right). Sequencing panel: cell content indicated as number of reads mapped on the TE consensus normalized on the total number of sequenced reads multiplied by 1,000,000. Two proportions Z-test with Benjamin-Hochberg FDR correction. TaqMan panel: cell content reported as ddCt using as reference gene DMRT1C and as calibrator offspring larval CTR sample. Data reported as mean ± SD (∗p < 0.05, ∗∗p < 0.01, ∗∗∗p < 0.001; two-way ANOVA with Bonferroni post hoc test). Offspring CTR samples are depicted in white, whereas offspring HD are in black. See also Figures S9, S12 and Table S1.

Similar articles

Cited by

References

    1. Allshire R.C., Madhani H.D. Ten principles of heterochromatin formation and function. Nat. Rev. Mol. Cell Biol. 2018;19:229–244. doi: 10.1038/nrm.2017.119. - DOI - PMC - PubMed
    1. Andrews S. Babraham Bioinformatic; 2010. FASTQC. A Quality Control Tool for High Throughput Sequence Data. Available online at: http://www.bioinformatics.babraham.ac.uk/projects/fastqc/
    1. Armstrong J.D., Kaiser K., Müller A., Fischbach K.F., Merchant N., Strausfeld N.J. Flybrain, an on-line atlas and database of the Drosophila nervous system. Neuron. 1995;15:17–20. doi: 10.1016/0896-6273(95)90059-4. - DOI - PubMed
    1. Awasaki T., Lai S.-L., Ito K., Lee T. Organization and postembryonic development of glial cells in the adult central brain of Drosophila. J. Neurosci. 2008;28:13742–13753. doi: 10.1523/JNEUROSCI.4844-08.2008. - DOI - PMC - PubMed
    1. Ayarpadikannan S., Kim H.-S. The impact of transposable elements in genome evolution and genetic instability and their implications in various diseases. Genomics Inform. 2014;12:98–104. doi: 10.5808/GI.2014.12.3.98. - DOI - PMC - PubMed

LinkOut - more resources