. 2022 Mar;9(7):e2103262.
doi: 10.1002/advs.202103262. Epub 2022 Jan 14.

Pseudomonas aeruginosa Biofilm Dispersion by the Human Atrial Natriuretic Peptide

Affiliations

Pseudomonas aeruginosa Biofilm Dispersion by the Human Atrial Natriuretic Peptide

Mélissande Louis et al. Adv Sci (Weinh). 2022 Mar.

Abstract

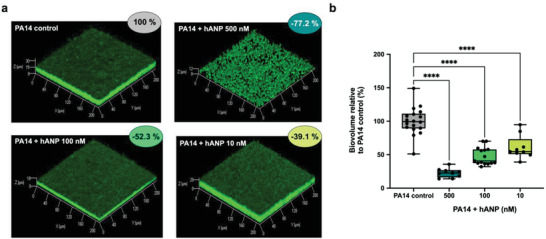
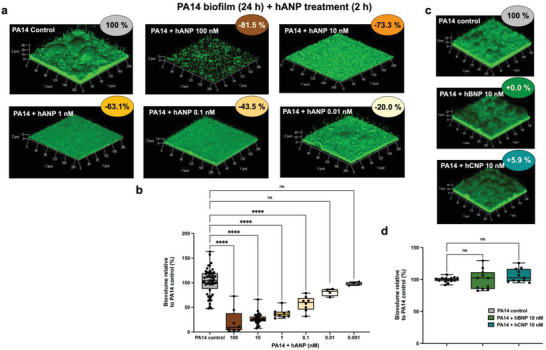
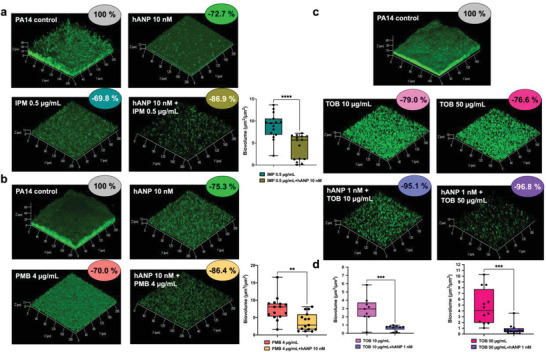
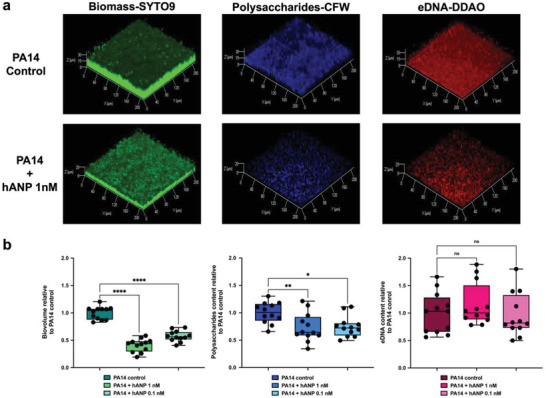
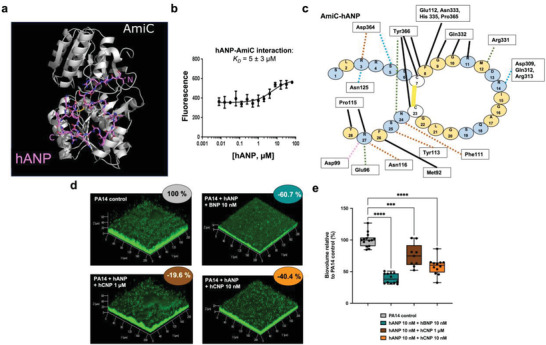
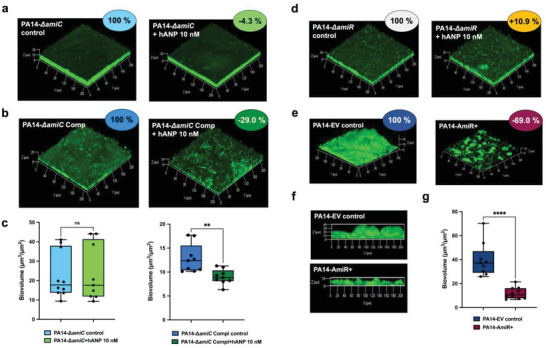
Pseudomonas aeruginosa biofilms cause chronic, antibiotic tolerant infections in wounds and lungs. Numerous recent studies demonstrate that bacteria can detect human communication compounds through specific sensor/receptor tools that modulate bacterial physiology. Consequently, interfering with these mechanisms offers an exciting opportunity to directly affect the infection process. It is shown that the human hormone Atrial Natriuretic Peptide (hANP) both prevents the formation of P. aeruginosa biofilms and strongly disperses established P. aeruginosa biofilms. This hANP action is dose-dependent with a strong effect at low nanomolar concentrations and takes effect in 30-120 min. Furthermore, although hANP has no antimicrobial effect, it acts as an antibiotic adjuvant. hANP enhances the antibiofilm action of antibiotics with diverse modes of action, allowing almost full biofilm eradication. The hANP effect requires the presence of the P. aeruginosa sensor AmiC and the AmiR antiterminator regulator, indicating a specific mode of action. These data establish the activation of the ami pathway as a potential mechanism for P. aeruginosa biofilm dispersion. hANP appears to be devoid of toxicity, does not enhance bacterial pathogenicity, and acts synergistically with antibiotics. These data show that hANP is a promising powerful antibiofilm weapon against established P. aeruginosa biofilms in chronic infections.

Keywords: Pseudomonas aeruginosa; ami pathway; antibiotics; bacterial adaptation; bacterial sensor; biofilm dispersion; hANP; natriuretic peptides.


Conflict of interest statement

The authors declare no conflict of interest.

Figures

Figure 1
Figure 1
Effect of hANP on P. aeruginosa biofilm formation. a) 3D shadow representations of P. aeruginosa PA14 biofilm structures, unexposed (control condition) or exposed to hANP (500 × 10−9, 100 × 10−9, or 10 × 10−9 m), grown in dynamic conditions at 37 °C for 24 h. Bacterial cells within biofilms were stained with SYTO9 and observed by CLSM. b) COMSTAT image analyses of biofilms structures of P. aeruginosa PA14 exposed during biofilm formation to hANP (500 × 10−9, 100 × 10−9, or 10 × 10−9 m) in dynamic conditions for 24 h at 37 °C, compared to unexposed condition. Data are the result of the analysis of 18 (control condition), nine (hANP 500 × 10−9 m), 15 (hANP 100 × 10−9 m), and nine (hANP 10 × 10−9 m) views from at least three independent biological experiments (n = 3). Statistics were achieved by one‐way ANOVA followed by Dunnett's multiple‐comparison test. Values that are significantly different are indicated by asterisks as follows: ****, p < 0.0001.
Figure 2
Figure 2
Effect of hANP, Brain Natriuretic Peptide (hBNP), and C‐type Natriuretic Peptide (hCNP) on established biofilm of P. aeruginosa. a) 3D shadow representations of 24 h preformed P. aeruginosa PA14 biofilm structures exposed to various concentration of hANP (100 × 10−9 to 0.01 × 10−9 m) for 2 h at 37 °C compared to untreated biofilms (control condition). b) COMSTAT image analyses of biofilms structures of P. aeruginosa PA14 control or exposed for 2 h to hANP (100 × 10−9, 10 × 10−9, 1 × 10−9, 0.1 × 10−9, 0.01 × 10−9, or 0.001 × 10−9 m), at 37 °C. Data are the result of the analysis of 30 views from eight independent biological experiments (hANP 100 × 10−9 m), 127 measurements from 40 independent experiments (n = 40) (hANP 10 × 10−9 m), 28 measurements from nine independent experiments (n = 9) (hANP 1 × 10−9 m), 27 measurement from eight independent experiments (n = 8) (hANP 0.1 × 10−9 m), 13 measurement from four independent experiments (n = 4) (hANP 0.01 × 10−9 m), and 13 measurement from four independent experiments (n = 4) (hANP 0.001 × 10−9 m). c) 3D shadow representations of 24 h preformed P. aeruginosa PA14 biofilm structures untreated (control condition) or exposed to hBNP (10 × 10−9 m) or hCNP (10 × 10−9 m) for 2 h at 37 °C. d) COMSTAT image analyses of biofilms structures of P. aeruginosa PA14 control or exposed to hBNP (10 × 10−9 m) or hCNP (10 × 10−9 m) for 2 h at 37 °C. Data are the result of the analysis of at least 11 views from at least three independent biological experiments (n = 3). All biofilms were stained with the SYTO9 and observed by CLSM. Statistics were achieved by ordinary one‐way ANOVA followed by Dunnett's multiple‐comparison test. Values that are significantly different are indicated by asterisks as follows: ***, p < 0.001; ****, p < 0.0001.
Figure 3
Figure 3
Synergistic effect of hANP in combination with antibiotics on established biofilm of P. aeruginosa. a) 3D shadow representations of 24 h old P. aeruginosa PA14 biofilm structures untreated (control condition) or treated with hANP (10 × 10−9 m), imipenem (IPM) (0.5 µg mL−1), or the combination of IPM (0.5 µg mL−1) and hANP (10 × 10−9 m). COMSTAT image analyses of 24 h old biofilm structures of P. aeruginosa PA14 exposed to IPM (0.5 µg mL−1) or a combination of IMP (0.5 µg mL−1) and hANP (10 × 10−9 m). Data are the result of the analysis of 15 views from five independent biological experiments (n = 5). Statistics were achieved by a two‐tailed t test. Asterisks indicate values that are significantly different as follows: ****, p < 0.0001. b) 3D shadow representations of 24 h old P. aeruginosa PA14 biofilm structures untreated (control condition) or treated with hANP (10 × 10−9 m), polymyxin B (PMB) (4 µg mL−1), or the combination of PMB (4 µg mL−1) and hANP (10 × 10−9 m). COMSTAT image analyses of 24 h old biofilm structures of P. aeruginosa PA14 exposed to PMB (4 µg mL−1) or a combination of PMB (4 µg mL−1) and hANP (10 × 10−9 m). Data are the result of the analysis of 15 views from five independent biological experiments (n = 5). Statistics were achieved by a two‐tailed t test. Asterisks indicate values that are significantly different as follows: **, p < 0.01. c) 3D shadow representations of 24 h preformed P. aeruginosa PA14 biofilm structures in control condition (untreated) or exposed to tobramycin (TOB) at 10 or 50 µg mL−1, or to a combination of TOB (at 10 or 50 µg mL−1) and hANP (1 × 10−9 m) for 2 h at 37 °C. d) COMSTAT image analyses of 24 h old biofilm structures of P. aeruginosa PA14 exposed to tobramycin at 10 µg mL−1 or a combination of tobramycin (10 µg mL−1) and hANP (1 × 10−9 m) (left panel) and 50 µg mL−1 or a combination of tobramycin (50 µg mL−1) and hANP (1 × 10−9 m) (right panel), for 2 h at 37 °C. Data are the result of the analysis of nine views from three independent biological experiments (n = 3) for TOB at 10 µg mL−1 and 12 views from four independent biological experiments (n = 4) for TOB at 50 µg mL−1. Statistics were achieved by a two‐tailed t test. Asterisks indicate values that are significantly different as follows: ***, p < 0.001.
Figure 4
Figure 4
Impact of hANP on P. aeruginosa matrix composition. a) 3D shadow representations of the 24 h preformed P. aeruginosa PA14 biofilm structures, polysaccharides, and eDNA matrix components, exposed to hANP (1 × 10−9 or 0.1 × 10−9 m) for 2 h compared to control condition. Bacterial cells within biofilms were stained in green using SYTO9 (left panel). β1‐3 and β1‐4 polysaccharides were stained in blue using CalcoFluor White (CFW) (central panel). eDNA was stained in red using DDAO (right panel). Image acquisition was performed using CLSM. b) COMSTAT image analyses of bacterial biovolume (left panel), β1‐3 and β1‐4 polysaccharides (central panel) or eDNA (right panel) matrix components of P. aeruginosa PA14 biofilms structures unexposed (control condition) or exposed to hANP (1 × 10−9 or 0.1 × 10−9 m) for 2 h at 37 °C. Polysaccharides and eDNA values are normalized to biofilm biomass. Data are the result of the analysis of 12 views from four independent biological experiments (n = 4). Statistics were achieved by ordinary one‐way ANOVA followed by Dunnett's multiple‐comparison test. Asterisks indicate values that are significantly different as follows: *, p < 0.05, **, p < 0.01; ****, p < 0.0001.
Figure 5
Figure 5
hANP and P. aeruginosa AmiC protein binding. a) Docking of hANP to AmiC. Shown is the best pose of hANP docking to the AmiC monomer determined by the FRODOCK server. The peptide binds across the surface where AmiC binds to AmiR. AmiC is shown in the cartoon representation, and hANP is shown in sticks. Colors: AmiC, white; hANP carbon, pink; oxygen, red; nitrogen, blue; sulfur, yellow. Image generated using the PyMOL Molecular Graphics System v2.4.1, Schrödinger, LLC. b) Direct hANP affinity for purified AmiC using MicroScale Thermophoresis. Recombinant AmiC was fluorescently labeled and incubated with varying concentrations of hANP. Data are the mean of three independent experiments. c) Schematic of the AmiC‐hANP interaction. Interactions were determined using LigPlot+ (Figure S4, Supporting Information) and checked manually using PyMOL. The hANP peptide is shown as individual amino acids in circles. AmiC residues interacting with hANP are shown in rectangles. Interactions are colored by type: hydrophobic interactions, black solid line. Disulfide bond, yellow solid line. Hydrogen bond to side chain, orange dashed line. Hydrogen bond to main chain, green dashed line. Salt bridge, pink dashed line. Assigned as hydrophobic by LigPlot but likely hydrogen bonds, blue dashed line. d) 3D shadow representations of the 24 h preformed P. aeruginosa PA14 biofilm structures exposed for 2 h at 37 °C to hANP and hBNP (10 × 10−9 m each) or to hANP (10 × 10−9 m) and hCNP at 1 × 10−6 m or 10 × 10−9 m compared to control condition (PA14 control; untreated). e) COMSTAT image analyses of biofilms structures of P. aeruginosa PA14 control or exposed for 2 h to hANP and hBNP cocktail (10 × 10−9 m each) or to hANP (10 × 10−9 m) and hCNP at 1 × 10−6 or 10 × 10−9 m. Data are the result of the analysis of at least nine views from at least three independent biological experiments (n = 3). All biofilms were stained with SYTO9 and observed by CLSM. Statistics were achieved by ordinary one‐way ANOVA followed by Dunnett's multiple‐comparison test. Asterisks indicate values that are significantly different as follows: ***, p < 0.001; ****, p < 0.0001.
Figure 6
Figure 6
Involvement of P. aeruginosa ami operon in hANP antibiofilm effect. a–c) Involvement of the AmiC sensor protein in hANP antibiofilm effect. a) 3D shadow representations of the 24 h old biofilm structures of the mutant strain PA14‐ΔamiC control (left panel) or exposed to hANP (2 h; 10 × 10−9 m; right panel). b) 3D shadow representations of the 24 h old biofilm structures of the complemented strain PA14‐ΔamiC Comp (left panel) or exposed to hANP (2 h; 10 × 10−9 m; right panel). c) COMSTAT image analyses of the biofilm structures of P. aeruginosa PA14‐ΔamiC and PA14‐ΔamiC Comp strains, control (blue) or exposed to hANP (green) for 2 h at 37 °C. Data are the result of the analysis of nine views from three independent biological experiments (n = 3). d–g) Involvement of the AmiR regulator protein in hANP antibiofilm effect. d) 3D shadow representations of the 24 h old biofilm structures of the mutant PA14‐ΔamiR control (left panel) or exposed to hANP (2 h; 10 × 10−9 m; right panel). e) 3D shadow representations of the 24 h old biofilm structures of the PA14 strain overexpressing AmiR (AmiR+; right panel) and an empty vector control (PA14 EV control; left panel). f) 3D shadow lateral representations showing the thickness of the 24 h old biofilm structures of the PA14 strain overexpressing (AmiR+; lower panel) and the empty vector control (PA14 EV control; upper panel). g) COMSTAT image analyses of the biofilm structures of both P. aeruginosa PA14‐EV and PA14‐AmiR+ strains. Data are the result of the analysis of ten views from three independent biological experiments (n = 3). Statistics were achieved by a two‐tailed t test. Asterisks indicate values that are significantly different as follows: **, p < 0.01; ****, p < 0.0001.

Similar articles

Cited by

References

    1. Talwalkar J. S., Murray T. S., Clin. Chest Med. 2016, 37, 69. - PubMed
    1. Jurado‐Martin I., Sainz‐Mejias M., McClean S., Int. J. Mol. Sci. 2021, 22, 3128. - PMC - PubMed
    1. Høiby N., Bjarnsholt T., Moser C., Bassi G. L., Coenye T., Donelli G., Hall‐Stoodley L., Holá V., Imbert C., Kirketerp‐Møller K., Lebeaux D., Oliver A., Ullmann A. J., Williams C., Clin. Microbiol. Infect. 2015, 21, S1. - PubMed
    1. Ciofu O., Rojo‐Molinero E., Macia M. D., Oliver A., APMIS 2017, 125, 304. - PubMed
    1. Moradali M. F., Ghods S., Rehm B. H., Front. Cell. Infect. Microbiol. 2017, 7, 39. - PMC - PubMed

Publication types

MeSH terms

Substances

LinkOut - more resources