. 2022 Feb 2;9(1):ENEURO.0403-21.2021.
doi: 10.1523/ENEURO.0403-21.2021. Print 2022 Jan-Feb.

The Role of Even-Skipped in Drosophila Larval Somatosensory Circuit Assembly

Affiliations

The Role of Even-Skipped in Drosophila Larval Somatosensory Circuit Assembly

Zarion D Marshall et al. eNeuro. .

Abstract

Proper somatosensory circuit assembly is critical for processing somatosensory stimuli and for responding accordingly. In comparison to other sensory circuits (e.g., olfactory and visual), somatosensory circuits have unique anatomy and function. However, understanding of somatosensory circuit development lags far behind that of other sensory systems. For example, there are few identified transcription factors required for integration of interneurons into functional somatosensory circuits. Here, as a model, we examine one type of somatosensory interneuron, Even-skipped (Eve) expressing laterally placed interneurons (ELs) of the Drosophila larval nerve cord. Eve is a highly conserved, homeodomain transcription factor known to play a role in cell fate specification and neuronal axon guidance. Because marker genes are often functionally important in the cell types they define, we deleted eve expression specifically from EL interneurons. On the cell biological level, using single neuron labeling, we find eve plays several previously undescribed roles in refinement of neuron morphogenesis. Eve suppresses aberrant neurite branching, promotes axon elongation, and regulates dorsal-ventral dendrite position. On the circuit level, using optogenetics, calcium imaging, and behavioral analysis, we find eve expression is required in EL interneurons for the normal encoding of somatosensory stimuli and for normal mapping of outputs to behavior. We conclude that the eve gene product coordinately regulates multiple aspects of EL interneuron morphogenesis and is critically required to properly integrate EL interneurons into somatosensory circuits. Our data shed light on the genetic regulation of somatosensory circuit assembly.

Keywords: embryo; larva; mechanosensation; proprioception; somatosensation.


Figures

Figure 1.
Figure 1.
In EL eve mutants, EL interneurons lack Eve expression. A, B, Images of Eve expression in the nerve cord of Drosophila embryos. A, In control, each segment has Eve(+) motor neurons (MNs; red) and Eve(+) EL interneurons (INs; green). B, In EL eve mutants, Eve is selectively lost from EL, but neurons themselves remain (Fujioka et al., 2003). Images show Eve expression in three segments of the Drosophila nerve cord of stage 16 embryos. Anterior is up with scale bar of 15 μm. Position of EL interneurons in one hemisegment is circled. Midline is marked by an arrowhead. C, D, Schematics of genomic constructs that rescue eve expression. C, The top line shows a wild-type “WT eve” genomic DNA fragment (EGN92; Fujioka et al., 2003), which contains all known eve coding and regulatory sequences. The bottom line represents the “ΔEL” rescue construct, which is identical to WT eve construct except it lacks the EL enhancer (EGN92 ΔEL; Fujioka et al., 2003). D, Two different eve null alleles, Df(2R)eve and eve(3), are rescued with the ΔEL construct, referred to EL eve mutant (1) and EL eve mutant (2), respectively. Genotypes: control is ΔEL, Df(2R)eve/+ and EL eve mutant is ΔEL, eve(3)/ΔEL, Df(2R)eve.
Figure 2.
Figure 2.
In embryos, eve expression is required for proper medial-lateral and anterior-posterior neurite positioning of EL interneurons. A–C, Images and quantification of stage 15 embryos with EL interneurons extending axons across the midline. A, B, In control and EL eve mutants, ELs extend across the midline. Two abdominal segments are shown with midline noted as an arrowhead. Anterior is up and scale bars are 10 μm. Below each image is an illustration of the phenotype. C, For this quantification, n = number of hemisegments with EL processes crossing the midline over the total number of hemisegments scored. D–F, Images and quantification of stage 16 embryos with defects in medial-lateral positioning of EL neurites in EL eve mutants. D, In control, ELs project toward the anterior mainly along the intermediate fascicle. E, In EL eve mutants, ELs project in additional fascicles (arrows; L = lateral fascicle, I = intermediate, M = medial). F, For this quantification, n = number of hemisegments scored. G–I, Images and quantification of stage 17 embryos, with defects in anterior-posterior positioning of EL neurites in EL eve mutants. G, In control, ELs extend neurites to the next anterior segment. H, In EL eve mutants, neurites do not extend to the next segment (arrow). I, For this quantification, n = number of hemisegments with processes reaching the next segment over the total number of hemisegments scored; chi-squared test, ****p < 0.0001. Genotypes: control 1 is EL-GAL4/UAS-myr-GFP; control 2 is UAS-FLP, act5C-FRT.stop-GAL4;;EL-GAL4/UAS-myr-GFP. EL eve mutant (1) is UAS-FLP, act5C-FRT.stop-GAL4; ΔEL, Df(2R)eve/ΔEL, Df(2R)eve; EL-GAL4/UAS-myr-GFP.
Figure 3.
Figure 3.
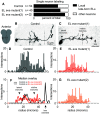
In larvae, Eve(–) ELs have excessive branching off the main neurite and diminished axon extension. A, Quantification of labeled neurons. In all genotypes, the most numerous type of singly-labeled neurons are local, late-born ELs. n = total number of singly-labeled neurons for each genotype. B, C, Images of singly-labeled ELs. Drosophila neurons are pseudo-unipolar. B, In control, dendrites are located ipsilateral to the soma. On the contralateral side, axons turn to the anterior and form branches where output synapses are found (Heckscher et al., 2015). C, In EL eve mutants, there is excessive branching off the main neurite (arrowheads), and the axon is less extended (arrow). Anterior is up with a scale bar of 5 μm. Dashed line indicates midline. D–G, Quantifications of neuron morphology. For each plot, the x-axis is the radius of a concentric circle centered on the EL soma. The y-axis is number of times a singly-labeled EL intersects a circle. Median (dark line) and range (lighter bars) are shown. F, Control is black; red and orange lines are EL eve mutants (1) and (2), respectively. Wilcoxon test, ***p < 0.0001. Genotypes: control is 11F02-GAL4/UAS-MCFO. EL eve mutant (1) is ΔEL, Df(2R)eve/ΔEL, Df(2R)eve; 11F02-GAL4/UAS-MCFO. EL eve mutant (2) is ΔEL, Df(2R)eve/ΔEL, eve(3); 11F02-GAL4/UAS-MCFO.
Figure 4.
Figure 4.
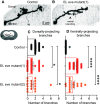
Eve(–) ELs have mispositioned dorsal-ventral dendrites. A, B, Images of singly-labeled ELs in side view. A, In control, ELs have ipsilateral dendrites that project dorsally. B, In EL eve mutants, many branches project ventrally. These are the same neurons as in Figure 3B,C, except here dorsal is up. C, D, Quantification of dendrite orientation. The number of branches pointing dorsally or ventrally is plotted with each dot representing a single neuron. Bars show average, and whiskers show standard deviation. ANOVA with Dunnett’s multiple comparison; *p < 0.05 and ****p < 0.0001.
Figure 5.
Figure 5.
Eve(–) ELs do not derepress molecular markers. A–D, Images of marker gene expression in ELs. A, C, In control, ELs lack expression of ventral motor neuron maker, HB9 (A’) and an interneuron marker En (A’’). ELs express both Eagle (C’) and Collier (C’’). B, D, In EL eve mutants, there is no change in marker gene expression. Representative segments of stage 16 embryos. Anterior is up with a scale bar of 5 μm. Arrowhead shows midline. Area containing EL neurons is circled. n = number of hemisegments scored. Each row shows separate image channels of the same co-stained stained embryo. Genotypes: control is wild-type and EL eve mutant(1) is ΔEL, Df(2R)eve/ΔEL, Df(2R)eve.
Figure 6.
Figure 6.
In EL eve mutants, there are no changes in sensory neurons axonal trajectories. A, B, Illustration of sensory inputs onto ELs. A, Late-born ELs get direct input from proprioceptors and indirect input via the Jaam CNS interneurons. B, Early-born ELs get direct input from mechanoreceptors (chordotonals) and indirect input via the Basin CNS interneurons. C–F, Illustrations of sensory neuron-to-interneuron wiring in different genetic conditions. C, In wild-type, sensory neuron axons (green) and interneuron dendrites (blue) are in close enough proximity they can form synaptic contacts. D, When sensory neuron axons are genetically mispositioned, interneurons grow in response, and the two cell types continue to form synaptic contacts. E, F, When EL interneuron dendrites are mispositioned because of lack of Eve, sensory neurons might or might not change position in response. G, H, Images of vibration and proprioceptive sensory neurons arbors. G, H, Axonal positions are similar in control and EL eve mutants for both vibration sensitive and proprioceptive sensory neurons. Single hemisegments of an L1 larval CNS are shown with dorsal up. Eve-expressing motor neurons are shown as solid circles with a diameter of five microns. Positions of Fas2(+) fascicles are shown as dashed circles. To the left of each image is a schematic of the axon position relative to landmarks. n = the number of hemisegments scored. Genotypes: control in G is iav-GAL4/UAS-myr-GFP. EL eve mutant in G is ΔEL, Df(2R)eve/ΔEL, Df(2R)eve; iav-GAL4/UAS-myr-GFP. Control in H is 0165-GAL4/UAS-myr-GFP. EL eve mutant in H is ΔEL, Df(2R)eve/ΔEL, Df(2R)eve; 0165-GAL4/UAS-myr-GFP.
Figure 7.
Figure 7.
EL interneurons require eve expression to encode somatosensory stimuli. A, Illustration of the semi-restrained preparation and stimulus protocol. Fluorescence in the CNS (gray lobed structure with two white lines representing neuropil) is recorded before, during, and after a sound is played from a speaker. B, C, Quantifications of EL calcium signals. B, In control, EL have small amplitude, dynamic calcium signals before sound onset, which corresponds to periods of self-movement. There are large amplitude changes in EL calcium signal on sound/vibration stimuli. ΔF/F is the change in fluorescence over baseline. C, In EL eve mutants, ELs do not respond to stimuli. Averages (dark line) and SEM (light line) are shown. Scale for both is shown as an inset. n = number of larvae recorded. D, E, Images from representative recordings of calcium signals in ELs. Fluorescence images are shown in pseudo-color with white/red as high fluorescence intensity and blue as low. Anterior is up with a scale bar of 100 μm. Dashed lines show the outline of the nerve cord. In D, asterisk denotes region of nerve cord neuropile (central region) with increased fluorescence. In E, > points to mouth hooks. Genotypes: control is UAS-FLP, act5C-FRT.stop-GAL4; ΔEL, Df(2R)eve/+; EL-GAL4/UAS-GCaMP6m. EL eve mutant is UAS-FLP, act5C-FRT.stop-GAL4; ΔEL, Df(2R)eve/ΔEL, Df(2R)eve; EL-GAL4/UAS-GCaMP6m.
Figure 8.
Figure 8.
In Eve(–) ELs, output synapses are anatomically repositioned. A, B, Images of tagged presynaptic active zones. Eve labels ELs (“ELs” in A) but not in EL eve mutants (* in B). A’, In control, labeled active zones (BRP) are clustered around the central intermediate Fas2(+) fascicles (CI). B’, In EL eve mutants, BRP signal is diffuse throughout the entire neuropile. A–A’’ are the same CNS and B–B’’ are the same CNS. A’’, B’’ are a magnifications of the neuropile from one hemisegment in A’ or B’, respectively. Images are overlaid with lines showing medial (M), intermediate (I), and lateral (L) zones. Images show the CNS in cross section with dorsal up. Arrow denotes midline. Neuropile is outlined by a dashed circle. Scale bar: 10 μm. C, D, Quantifications of BRP signal distribution. n = number of hemisegments with BRP signal above background within a given region/total number of hemisegments scored. Zones scored were medial (M), intermediate (I), and lateral (L) as shown in A’’, B’’. Genotype: control is UAS-FLP, act5C-FRT.stop-GAL4; ΔEL, Df(2R)eve/+; EL-GAL4/UAS-FLP, BRP-frt-stop-frt-V5-2A-LexA. EL eve mutant is UAS-FLP, act5C-FRT.stop-GAL4; ΔEL, Df(2R)eve/ΔEL, Df(2R)eve; EL-GAL4/UAS-FLP, BRP-frt-stop-frt-V5-2A-LexA.
Figure 9.
Figure 9.
In EL eve mutants, there are defects in spontaneously-occurring crawling behavior. A–C, Images and quantification of larva crawling. A, B, Images of control and EL eve mutants during forward crawling. Images are frames (0.66-s intervals) from representative behavioral recordings. Anterior is up and scale bar is 150 μm. C. Quantification of crawling speed is calculated as centroid movement over time. Each dot represents the average data for one larva. Bars represent average of all data points, and whiskers show SEM. One-way ANOVA with Dunnett’s multiple comparison; **p < 0.01, ****p < 0.0001. D–F, Images of left-right asymmetrical body posture. D, In control, larvae crawl left-right symmetrically. E, When ELs are genetically ablated during embryogenesis, larvae crawl with left-right asymmetrical body posture. F, In EL eve mutants, when Eve is removed from ELs, but the EL neurons remain, larvae crawl with a significantly severe left-right asymmetrical body posture. Images are single representative frames from behavioral recordings showing body shape with anterior up and scale bar of 40 μm. F is overlaid to show how angles are calculated. G, H, Quantification of left-right body asymmetry. Asymmetry is measured as tail-to-centroid and head-to-centroid angles during crawling. Each dot represents the average data for one larva. Data for No ELs replotted from Heckscher et al. (2015), with permission. Bars represent average of all data points, and whiskers show SEM ANOVA with Dunnett’s multiple comparison test; **p < 0.01, Genotypes: Control is wildtype (+/+); no EL is UAS-RPR, UAS-HID/+;; EL-GAL4/+; refer to Figure 1D for naming of mutant allele genotypes used in this experiment.
Figure 10.
Figure 10.
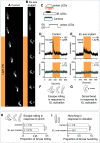
EL outputs are remapped in the absence of Eve. A, B, Images of behavioral responses to optogenetic stimulation of ELs. A, Control larvae fed ATR and expressing CsChrimson in ELs roll in response to light. B, EL eve mutant larvae fed ATR and expressing CsChrimson in ELs display a novel dorsal bend phenotype (can be either side). Images are frames from representative behavioral recordings (shown at 0.6-s intervals). Scale bar: 150 μm. In B, > points to dorsal. C, Illustration of the behavioral rig. The rig uses infrared light emitting diodes (IR LEDs) to illuminate larvae, which is detected by the camera, but not the larvae. Amber LEDs stimulate optogenetic effectors. D, E, Quantification of larval movement. Centroid speed is calculated as centroid displacement/time. Orange bar shows exposure to amber light. Gray traces (bottom) are control larvae not fed ATR, a co-factor needed for optogenetic simulation. Black traces are experimental larvae, which were fed ATR. n = number of larvae recorded. Average is shown as darker lines and SEM is shown as lighter lines. F, G, Illustrations of behavioral responses. Controls roll in response to EL activation, whereas EL eve mutants perform a dorsal bend in response to EL activation. H, I, Quantification of larval sensorimotor transformations. Control and EL eve mutant larvae roll in response to body wall pinch and hunch in response to vibration. Illustration of each behavior is shown in top left of each panel. For quantifications, n = number of larvae responding to each stimulus over the total number of larvae stimulated. Chi-squared test, n.s. = not significant. Genotype: control in A, D is UAS-FLP, act5C-FRT.stop-GAL4; ΔEL, Df(2R)eve/+; EL-GAL4/UAS-Cs.Chrimson.mVenus. EL eve mutant in B and E is UAS-FLP, act5C-FRT.stop-GAL4; ΔEL, Df(2R)eve/ΔEL, Df(2R)eve; EL-GAL4/UAS-Cs.Chrimson.mVenus; control in H is ΔEL, Df(2R)eve/+. EL eve mutant in I is ΔEL, Df(2R)eve)/ΔEL, Df(2R)eve.

Similar articles

Cited by

References

    1. Broihier HT, Skeath JB (2002) Drosophila homeodomain protein dHb9 directs neuronal fate via crossrepressive and cell-nonautonomous mechanisms. Neuron 35:39–50. 10.1016/S0896-6273(02)00743-2 - DOI - PubMed
    1. Chen Y, Akin O, Nern A, Tsui CY, Pecot MY, Zipursky SL (2014) Cell-type-specific labeling of synapses in vivo through synaptic tagging with recombination. Neuron 81:280–293. 10.1016/j.neuron.2013.12.021 - DOI - PMC - PubMed
    1. Clark MQ, Zarin AA, Carreira-Rosario A, Doe CQ (2018) Neural circuits driving larval locomotion in Drosophila. Neural Dev 13:6. 10.1186/s13064-018-0103-z - DOI - PMC - PubMed
    1. Couton L, Mauss AS, Yunusov T, Diegelmann S, Evers JF, Landgraf M (2015) Development of connectivity in a motoneuronal network in Drosophila larvae. Curr Biol 25:568–576. 10.1016/j.cub.2014.12.056 - DOI - PMC - PubMed
    1. D’Elia KP, Dasen JS (2018) Development, functional organization, and evolution of vertebrate axial motor circuits. Neural Dev 13:10. 10.1186/s13064-018-0108-7 - DOI - PMC - PubMed

Publication types

LinkOut - more resources