. 2022 Jan 13;13(1):321.
doi: 10.1038/s41467-021-27869-2.

Genomic loci mispositioning in Tmem120a knockout mice yields latent lipodystrophy

Affiliations

Genomic loci mispositioning in Tmem120a knockout mice yields latent lipodystrophy

Rafal Czapiewski et al. Nat Commun. .

Abstract

Little is known about how the observed fat-specific pattern of 3D-spatial genome organisation is established. Here we report that adipocyte-specific knockout of the gene encoding nuclear envelope transmembrane protein Tmem120a disrupts fat genome organisation, thus causing a lipodystrophy syndrome. Tmem120a deficiency broadly suppresses lipid metabolism pathway gene expression and induces myogenic gene expression by repositioning genes, enhancers and miRNA-encoding loci between the nuclear periphery and interior. Tmem120a-/- mice, particularly females, exhibit a lipodystrophy syndrome similar to human familial partial lipodystrophy FPLD2, with profound insulin resistance and metabolic defects that manifest upon exposure to an obesogenic diet. Interestingly, similar genome organisation defects occurred in cells from FPLD2 patients that harbour nuclear envelope protein encoding LMNA mutations. Our data indicate TMEM120A genome organisation functions affect many adipose functions and its loss may yield adiposity spectrum disorders, including a miRNA-based mechanism that could explain muscle hypertrophy in human lipodystrophy.


Conflict of interest statement

The authors declare no competing interests.

Figures

Fig. 1
Fig. 1. Ad-Tmem120a−/− mice have reduced fat accumulation in WAT while fat is increased in BAT.
a Female body weight on high-fat (HFD) vs low-fat (LFD) diet. Data from two separate experiments, shown as mean ± SEM, control LFD n = 9, Ad-Tmem120a−/− LFD n = 8, control HFD n = 10, Ad-Tmem120a−/− n = 10, P values for each time point are available in Source Data file. b Representative images of 6-month-old female mice, control and Ad-Tmem120a−/− mice after 10 weeks on HFD. c 24 h food intake by females on HFD measured during calorimetry experiment; shown as mean ± SEM (n = 4 for each genotype). Female mice body composition measured by TD-NMR after 10 weeks of LFD and HFD, fat mass (d) and lean mass (e) are shown as percent of whole-body weight; shown as mean ± SEM (each group n = 4). f Whole body mass-normalised weight of different adipose tissue depots: inguinal-subcutaneous (iWAT), gonadal (gWAT), mesenteric (mWAT) and interscapular BAT, shown as mean ± SEM, control LFD n = 7, Ad-Tmem120a−/− LFD n = 6, control HFD n = 7, Ad-Tmem120a−/− n = 6. Images of haematoxylin and eosin stained iWAT (g) and interscapular BAT (h), from control and Ad-Tmem120a−/− female mice on HFD vs LFD, scale bars 40 µm. il Quantification of lipid droplet size in iWAT and BAT form control and Ad-Tmem120a−/− females on LFD and HFD, the sizes of the lipid droplets were assigned to size bins and are shown as frequency, area in µm2, shown as mean ± SEM control LFD n = 7, Ad-Tmem120a−/− LFD n = 6, control HFD n = 7, Ad-Tmem120a−/− n = 6, P values were calculated by unpaired, two-sided Student’s t test. See also Supplementary Fig. 1. Source data are provided as a Source Data file.
Fig. 2
Fig. 2. Insulin resistance in Ad-Tmem120a-/- mice.
Glucose tolerance test in control and Ad-Tmem120a−/− females on HFD (a) and LFD (b), fasting for 16 h, and quantification of the area under the curve (AUC) (c), panels shown as mean ± SEM, control LFD n = 9, Ad-Tmem120a−/− LFD n = 8, control HFD n = 9, Ad-Tmem120a−/− n = 9. d Insulin tolerance test in control and Ad-Tmem120a−/− females on LFD vs HFD, fasting for 6 h, shown as mean ± SEM, control LFD n = 7, Ad-Tmem120a−/− LFD n = 6, control HFD n = 9, Ad-Tmem120a−/− n = 6. Blood biochemistry. Fasting serum insulin (e), fasting leptin (f), high molecular weight (HMW) adiponectin (g), NEFA—nonestrified fatty acids (h), and triglycerides levels (i) in control and Ad-Tmem120a−/− females on LFD vs HFD, fasting for 16 h, shown as mean ± SEM, control LFD n = 4, Ad-Tmem120a−/− LFD n = 3, control HFD n = 4, Ad-Tmem120a−/− n = 4. j Representative images of haematoxylin and eosin-stained liver sections from control and Ad-Tmem120a−/− female mice on HFD, scale bars: 40 µm. k Quantification of lipid droplet size in liver form control and Ad-Tmem120a−/− females on HFD, the sizes of the lipid droplets were assigned to size bins and are shown as frequency, area in µm2, shown as mean ± SEM, control HFD n = 9, Ad-Tmem120a−/− n = 9. l Mean daily water intake by control and Ad-Tmem120a−/− females after 10 weeks on HFD, shown as mean ± SEM, (for each group n = 4), P values: by unpaired, two-sided Student’s t test. Source data are provided as a Source Data file.
Fig. 3
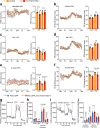
Fig. 3. Oxidative metabolism is altered in Ad-Tmem120a-/- mice.
Indirect calorimetry on standard diet female control and Ad-Tmem120a−/− mice, respiratory exchange rates—RER (VCO2/VO2) (a), and energy expenditure—EE [kcal/h/kg lean mass] (b). RER trace (c) and EE (d) in control and Ad-Tmem120a-/- female mice treated with high fat-diet for 48 h. RER trace (e) and EE (f) in control and Ad-Tmem120a−/− female mice treated with high fat-diet for 8 weeks. Line graphs (a–f) show representative 24 h trace means and error bars ± SEM and bar graphs show 48 h means and error bars show ± SEM. Indirect calorimetry experiment was performed once and data (EE and RER) from 48 h run were analysed, control HFD n = 4, Ad-Tmem120a−/− n = 4. g, h Oxygen consumption rates (OCR) in stromal vascular fraction cells (SVF) differentiated into adipocytes isolated from lox/lox animals infected with virus AAV_GFP_Cre to obtain Tmem120a knockout and as control SVF cells infected with GFP virus AAV_GFP. Mitochondria stress experiment in the presence of oligomycin, an ATPase inhibitor, FCCP—mitochondrial respiration uncoupler (maximal respiration) and rotenone with antimycin A (rot/AA)—electron transport chain complex I and III blockers, respectively. OCR traces normalised to total protein are shown as means SEM (g) and non-mitochondrial respiration-normalised quantification of OCR is shown on a bar chart graph (h) as means SEM, (n = 6 separate AAV infection per group). i, j Pyruvate dependency in SVF adipocytes from lox/lox mice subcutaneous fat infected with AAV_GFP or AAV_GFP_Cre as OCR was measured upon delivery of UK5099. P values: by unpaired, two-sided Student’s t test. See also Supplementary Fig. 4. Source data are provided as a Source Data file.
Fig. 4
Fig. 4. Ad-Tmem120a-/- mouse exhibits de-repression in inguinal WAT of many genes that normally repress myogenesis.
a Volcano plot of genes altered in inguinal subcutaneous white adipose tissue from control and Ad-Tmem120a−/− female mice on HFD (n = 5). b Gene Ontology (GO) Biological Process analysis for downregulated genes. GO terms found to be significantly enriched using g:Profiler fall into four classes: metabolism (beige), development (brown), transport (green) and response to stimulus (blue). The bars represent the proportion of genes associated with each individual enriched GO term that are present in the downregulated genes dataset. c Gene ontology (GO) Biological Process of analysis for upregulated genes. All of the enriched GO terms are related to muscle function, either skeletal (dark red) or cardiac (pale red). The bars represent the proportion of genes associated with each individual enriched GO term that are present in the upregulated genes dataset. d Tissue-specific gene enrichment for upregulated genes in iWAT from Ad-Tmem120a−/− mouse by TissueEnrich tool presented as fold enrichment. Source data are provided as a Source Data file.
Fig. 5
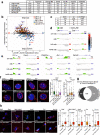
Fig. 5. DamID and transcriptomics analysis reveals Tmem120a contributes to gene regulation in adipocyte differentiation.
a LaminB1-DamID on 3T3-L1 preadipocytes and adipocytes, upon Tmem120a knockdown as well as Tmem120a and b double knockdown. Table shows metrics for lamina associated domains (LADs). b Correlation of gene expression and gene positioning shown as distribution scatter plot of genes differentially expressed (exp.up/exp.down) during adipogenesis (adip/pre-adip) and LamB1-DamID values, PI—genes moving from periphery to nuclear interion, IP—genes moving toward nuclear periphery. c Table showing numbers of genes changing expression upon being repositioned between nuclear interior “I” and nuclear periphery “P” during adipogenesis. Example DamID traces and expression changes of two genes being recruited to the NE (IP) upon differentiation that failed to reposition with Tmem120a knockdown (d), and examples for the opposite direction (PI) (e). f FISH in 3T3_L1 system for the Dctd and Fh1 genes in green with white arrow heads during wild-type adipogenesis and in the Tmem120a knockdown, distance from NE of n = 105 loci per group and gene, Tukey box plot representing median, cross on the box represents mean, bounds of box represents interquartile of the data, whiskers representing minima/maxima excluding outliers and dots represents outliers of more than 2/3 times of upper quartile, bars: 5 µm. g Venn diagram showing the number of genomic DRs affected by Tmem120 paralogs, representing the redundancy effect of single (Tmem120a) and double (Tmem120ab) knockdown on the genome organisation. h FISH in mouse iWAT from control animals vs. Ad-Tmem120a−/− detecting the position of the Dctd, Myh1/Myh2, Ano5, Fh1 and Unc13c genes; scale bars: 5 µm; distance from NE quantification is shown as Tukey box plot representing median, cross on the box represents mean, Dctd (WT n = 89 loci and KO n = 96 loci), Myh-1,2 (WT n = 105 loci, KO n = 105 loci), Ano5 (WT n = 165 loci, KO n = 138 loci), Fh1 (WT n = 111 loci, KO n = 83 loci), Unc13c (WT n = 90, KO n = 110). P values were calculated by unpaired two-sided, Student’s t test. See also Supplementary Fig. 5. Source data are provided as a Source Data file.
Fig. 6
Fig. 6. Enhancers and regulatory RNAs under NE positional control.
a Venn diagrams showing proportion of predicted adipogenic enhancers that become lost during adipogenesis—recruited to NE (light blue) or new adipocyte enhancers – released from NE (yellow). Dark blue circle represents enhancers that fail to recruit to NE during adipogenesis in Tmem120a KD 3T3-L1 cells. Red circle represents enhancers that fail to release form NE during Tmem120a KD 3T3-L1 differentiation. b DamID trace and FISH loci signal distance from NE quantification of the Klf9 enhancer shown as Tukey box plot representing median, cross on the box represents mean, bounds of box represents interquartile of the data, whiskers representing minima/maxima excluding outliers and dots represents outliers of more than 2/3 times of upper quartile. Pre-adipocytes (pre) and adipocytes (adip) n = 73 loci for both groups. P value was calculated by unpaired, two-sided, Student’s t test, c Volcano plot showing expression of lncRNA, highlighting strong upregulation of the H19 expression in Ad-Tmem120a−/− iWAT. d Volcano plot of differentially expressed miRNAs in iWAT. e DamID traces showing the position of miRNA-encoding loci with respect to changing LADs and their expression change in the knockout mouse. Blue, downregulated; red, upregulated. f Target genes of differentially expressed miRNAs show corresponding expression changes (RNA-Seq). See also Supplementary Data 5. Source data are provided as a Source Data file.
Fig. 7
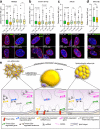
Fig. 7. Genes misregulated in Ad-Tmem120a-/- mice are also misregulated in human lipodystrophy patients.
ad Quantification of genetic loci distance from NE shown as Tukey box plot representing median, cross on the box represents mean, bounds of box represents interquartile of the data, whiskers representing minima/maxima excluding outliers and dots represents outliers of more than 2/3 times of upper quartile. n = 105 loci per condition/gene/participant, P values were calculated by unpaired two-sided, Student’s t test and representative images of FISH for TRIM55, MYH1/MYH2, ANO5, and MYO18b gene loci in human primary SVF cells before and after induction of adipogenesis, scale bars: 5 µm: CTRL, healthy donor; pre, preadipocytes; adip, adipocytes; P1 and P2 stands for patient 1 and patient 2 respectively. Cells are from anonymised FPLD patients donating tissue. e Model of genome organisation role in adipogenesis and lipodystrophy. In preadipocytes, some muscle genes (e.g., Myh1) are in the nuclear interior that need to be strongly shut off in adipocytes and so are recruited to the NE when Tmem120a is expressed during adipogenesis. In the opposite direction, some genes are released from the NE and become activated when Tmem120a is expressed; however, in the absence of Tmem120a they remain at the NE and their expression is reduced compared to wild-type adipocytes. Enhancers and miRNA-encoding loci are similarly under Tmem120a positional and expression regulation. Ad-Tmem120a−/− adipocytes parallel human FPLD2 patients in that the normal repositioning of several genes that takes place during adipogenesis is disrupted with a concomitant change in expression. Source data are provided as a Source Data file.

Similar articles

Cited by

References

    1. Fadason T, et al. Physical interactions and expression quantitative traits loci identify regulatory connections for obesity and type 2 diabetes associated SNPs. Front. Genet. 2017;8:150. - PMC - PubMed
    1. Frayling TM, et al. A common variant in the FTO gene is associated with body mass index and predisposes to childhood and adult obesity. Science. 2007;316:889–894. - PMC - PubMed
    1. Smemo S, et al. Obesity-associated variants within FTO form long-range functional connections with IRX3. Nature. 2014;507:371–375. - PMC - PubMed
    1. Guo Y, et al. CRISPR Inversion of CTCF sites alters genome topology and enhancer/promoter function. Cell. 2015;162:900–910. - PMC - PubMed
    1. Lupianez DG, et al. Disruptions of topological chromatin domains cause pathogenic rewiring of gene-enhancer interactions. Cell. 2015;161:1012–1025. - PMC - PubMed

Publication types

MeSH terms