. 2022 Jan 6;11(1):e1362.
doi: 10.1002/cti2.1362. eCollection 2022.

Identification of polo-like kinase 1 as a therapeutic target in murine lupus

Affiliations

Identification of polo-like kinase 1 as a therapeutic target in murine lupus

Yaxi Li et al. Clin Transl Immunology. .

Abstract

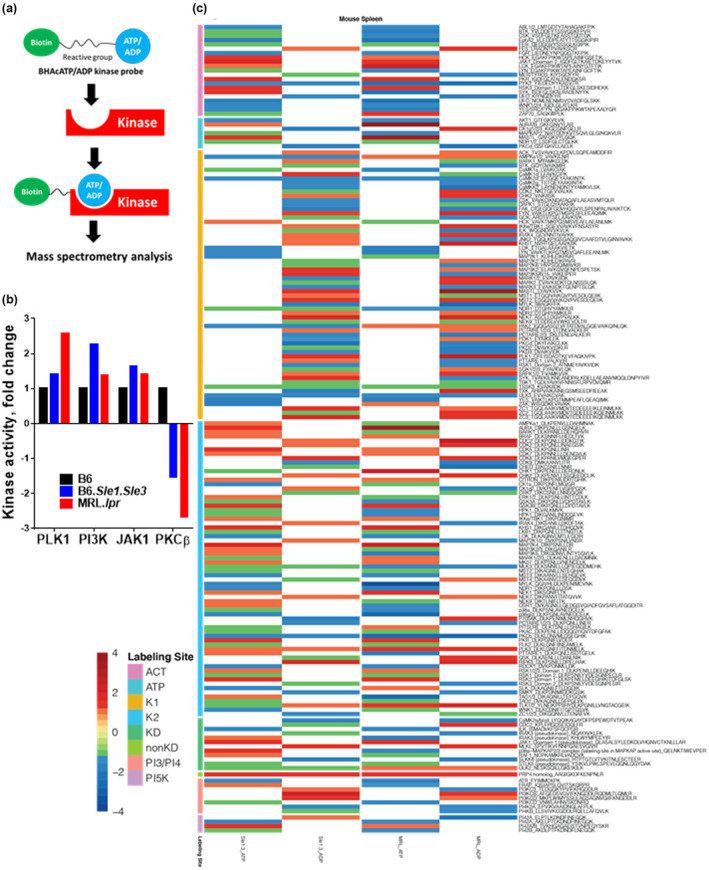
Introduction: The signalling cascades that contribute to lupus pathogenesis are incompletely understood. We address this by using an unbiased activity-based kinome screen of murine lupus.

Methods: An unbiased activity-based kinome screen (ABKS) of 196 kinases was applied to two genetically different murine lupus strains. Systemic and renal lupus were evaluated following in vivo PLK1blockade. The upstream regulators and downstream targets of PLK1 were also interrogated.

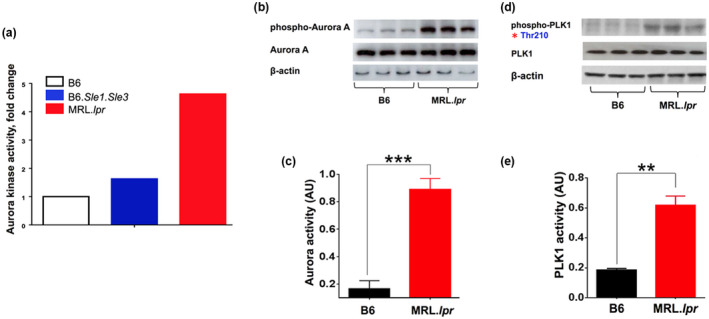
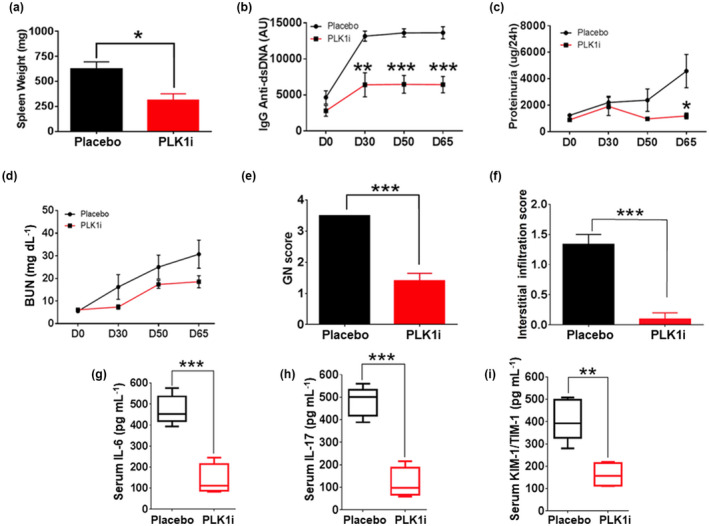
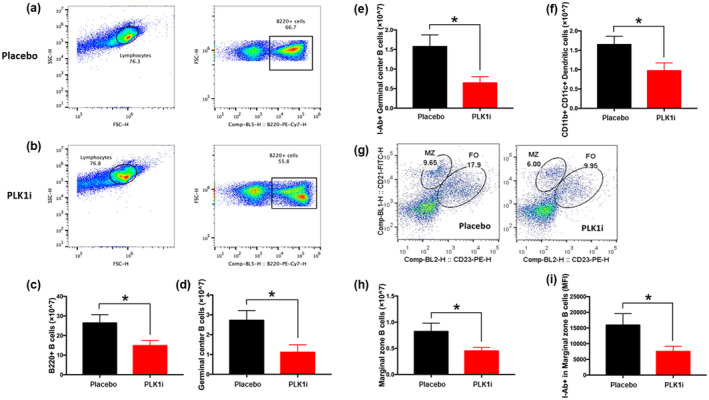
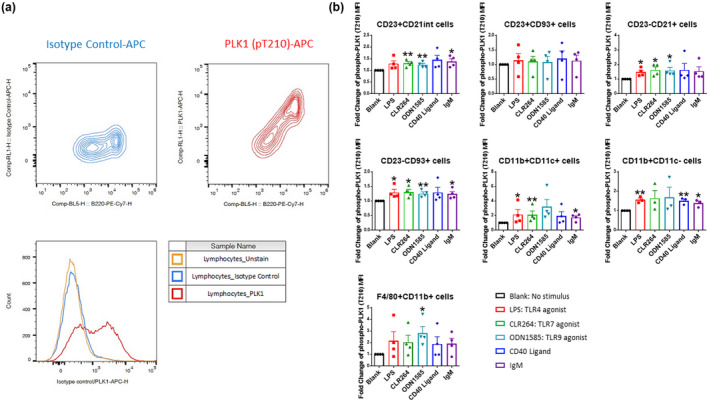
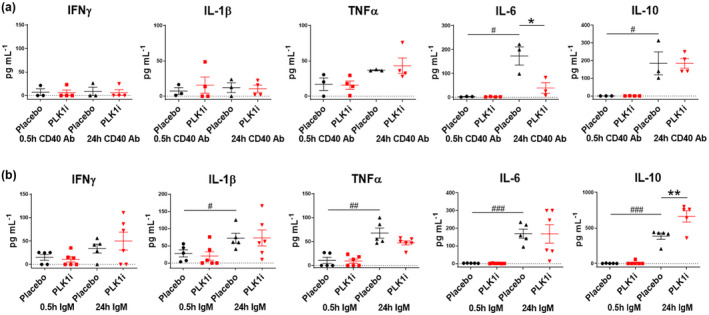
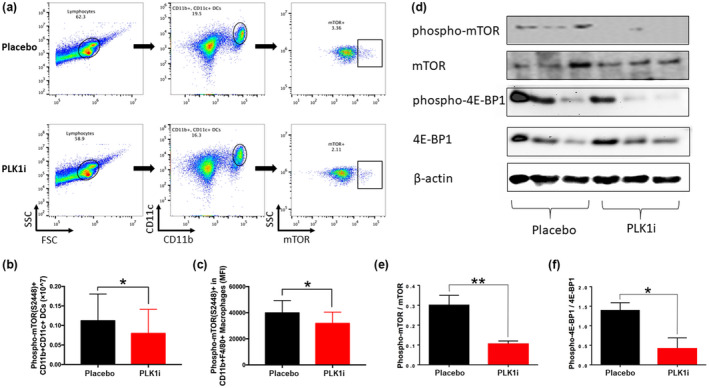
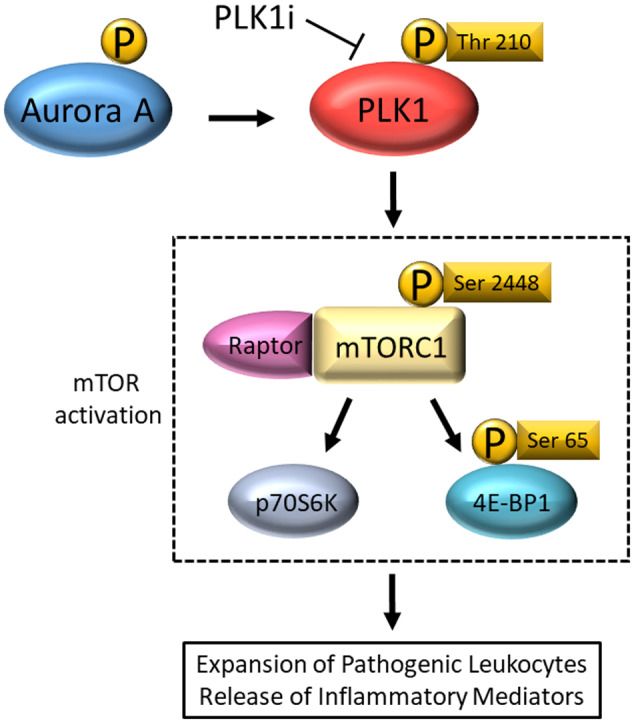
Results: Multiple signalling cascades were noted to be more active in murine lupus spleens, including PLK1. In vivo administration of a PLK1-specific inhibitor ameliorated splenomegaly, anti-dsDNA antibody production, proteinuria, BUN and renal pathology in MRL.lpr mice (P < 0.05). Serum IL-6, IL-17 and kidney injury molecule 1 (KIM-1) were significantly decreased after PLK1 inhibition. PLK1 inhibition reduced germinal centre and marginal zone B cells in the spleen, but changes in T cells were not significant. In vitro, splenocytes were treated with anti-mouse CD40 Ab or F(ab')2 fragment anti-mouse IgM. After 24-h stimulation, IL-6 secretion was significantly reduced upon PLK1 blockade, whereas IL-10 production was significantly increased. The phosphorylation of mTOR was assessed in splenocyte subsets, which revealed a significant change in myeloid cells. PLK1 blockade reduced phosphorylation associated with mTOR signalling, while Aurora-A emerged as a potential upstream regulator of PLK1.

Conclusion: The Aurora-A → PLK1 → mTOR signalling axis may be central in lupus pathogenesis, and emerges as a potential therapeutic target.

Keywords: PLK1; SLE; drug target; kinase activity.


Conflict of interest statement

The authors declare no conflict of interest.

Figures

Figure 1
Figure 1
Screening the activity of 196 kinases in lupus spleen using an unbiased Activity‐Based Kinome Scan (ABKS). (a) Model of the biotinylated acyl phosphate—ATP probe irreversibly reacting with protein kinases in the ATP binding pocket. (b) Kinome screening revealed several kinases with significantly altered activity in the spleens of lupus mouse models, B6.Sle1.Sle3 and MRL.lpr, compared to B6 controls (Female mice, 2–3‐month‐old, n = 3 per strain). (c) Detailed kinase activities of the screened kinome are presented in a heatmap where red represents upregulated kinases and blue represents downregulated kinases in lupus mice, MRL.lpr, and B6.Sle1.Sle3 spleens, normalised by the activity level of the same kinase from B6 healthy control spleens. For each strain, both the ADP‐binding and the ATP‐binding kinase activities are depicted in separate columns and each experiment was performed twice. Female mice, 2–3‐month‐old, n = 3 per strain.
Figure 2
Figure 2
Aurora‐A exhibits increased kinase activity and expression in MRL.lpr lupus mice, together with PLK1. Kinase activity of Aurora‐A, a putative regulator of PLK1, was measured in the spleens of lupus mouse models. (a) Elevated protein kinase activity of Aurora‐A was found in B6.Sle1.Sle3 and MRL.lpr, compared to B6 controls, in the initial ABKS screen (Figure 1). (b–e) Elevated phosphorylation and activity of Aurora‐A and PLK1 in splenic B cells of lupus mice. The assays were performed in triplicate. Female mice, 10‐week‐old, n = 3 per group. *P < 0.05; **P < 0.01; ***P < 0.001.
Figure 3
Figure 3
PLK1 inhibition in vivo rescues lupus phenotypes in MRL.lpr mice. A PLK1‐specific inhibitor or the vehicle control was administered to lupus mice, MRL.lpr via oral gavage at a dosage of 40 mg kg–1 daily for 2 days followed by a stop of 5 days, repeated every week for a total of 65 days. (a–f) Spleen weight, IgG anti‐dsDNA antibodies, proteinuria, BUN, renal pathology GN and interstitial infiltration score were considerably reduced after treatment. (g–i) Circulating mediators including serum IL‐6, IL‐17 and KIM‐1/TIM‐1 were also reduced by PLK1 inhibition. The assays were performed in triplicate. Female MRL.lpr, 10‐week‐old, n = 10 per group. *P < 0.05; **P < 0.01; ***P < 0.001.
Figure 4
Figure 4
Blocking PLK1 in vivo modulates B‐cell subsets and their activation status. A PLK1‐specific inhibitor was administered to MRL.lpr lupus mice, as detailed in Figure 2. Shown findings were derived when the mice were sacrificed following treatment. B220+ total B cells from (a) the placebo group and (b) the PLK1 inhibitor‐treated group were analysed. (c) Reduced numbers of B220+ total B cells, (e) B220+GL7+ germinal centre B cells, (g) CD11b+CD11c+ dendritic cells and (i) B220+CD21hiCD23low marginal zone B cells were observed after PLK1 blockade compared to the placebo group. (d) Numbers of double negative T cells exhibited no change after inhibitor treatment. (h) Gating strategy to define marginal zone and follicular B cells. Left, Placebo group. Right, Treatment group. (f) Numbers of I‐Ab+ germinal centre B cells were significantly decreased in the treatment group as well as the (j) MFI of the activation marker I‐Ab+ on marginal zone B cells. The assays were performed in triplicate. Female MRL.lpr, n = 10 per group. *P < 0.05.
Figure 5
Figure 5
Upregulated phospho‐PLK1(Thr210) expression in splenic cell subsets following various stimuli. (a) Validation of intracellular staining of phosphorylation of PLK1 at Thr210 through flow cytometry analysis. APC labelled isotype control and anti‐PLK1 (pT210) Ab were used for cell staining. PLK1 (pT210) exhibited clear and strong expression in B220+ splenic cells. (b) Splenocytes were cultured with various stimuli and the responses of B cell and myeloid cell subsets to LPS, CL264, ODN1585, CD40L and anti‐IgM were analysed. The assays were performed in triplicate. MFI, mean fluorescence intensity; fold‐change is presented relative to the p‐PLK1 levels on unstimulated cells (‘Blank’). Female MRL.lpr, 10‐week‐old, n = 5 per group. *P < 0.05; **P < 0.01.
Figure 6
Figure 6
PLK1 regulates inflammatory cytokines induced by anti‐CD40 and anti‐IgM stimulation in vitro. Splenocytes were isolated from MLR.lpr mice, stimulated with (a) anti‐CD40 antibody or (b) anti‐IgM for 0.5 h and 24 h, with or without PLK1 blockade. Secretion of inflammatory cytokine in the culture supernatant were measured by ELISA, including IFNγ, IL‐1β, TNFα, IL‐6 and IL‐10. The assays were performed in triplicate. Female MRL.lpr, 10‐week‐old, n = 3–6 per group. * indicates change between groups. # indicates change within one group. *P < 0.05; **P < 0.01; # P < 0.05; ## P < 0.01; ### P < 0.001.
Figure 7
Figure 7
mTOR is a downstream signalling target, potentially regulated by PLK1, in murine lupus. The expression level of phospho‐mTOR (Ser2448) was investigated, and its activity change was also examined after PLK1 inhibition in vitro. (a) Gating strategy for identifying CD11b+CD11c+ dendritic cells, as well as phospho‐mTOR(Ser2448) expression levels in the placebo and treatment groups. Top: Placebo group; Bottom: treatment group. (b) The number of splenic p‐mTOR(Ser2448)+CD11b+CD11c+ dendritic cells was reduced in the PLK1 inhibitor‐treated group. (c) The mean fluorescence intensity of phosphorylated mTOR was decreased in CD11b+F4/80+ splenic macrophages after PLK1 treatment. Female B6.lpr, 10‐month‐old, n = 3 per group. (d–f) Western blot results (with statistical analysis) of mTOR and phospho‐mTOR(Ser2448) expression in total spleen lysates from MRL.lpr mice, and its downstream targets 4E‐BP1 and phospho‐4E‐BP1 (Ser65), after in vivo PLK1 inhibition. Western blot images were cropped and aligned in Microsoft PowerPoint 2016. The assays were performed in triplicate. Female MRL.lpr, 10‐week‐old, n = 3 per group. *P < 0.05; **P < 0.01.
Figure 8
Figure 8
Schematic representation of the PLK1/mTOR signalling pathway. Phosphorylated Aurora‐A is elevated in murine lupus, which is highly conducive to the activation of PLK1. Activation of the PLK1 on Thr 210 regulates downstream mTOR association with a regulatory‐associated protein of mTOR (RAPTOR; a required component of mTORC1), but not the rapamycin‐insensitive companion of mTOR (RICTOR; a required component of mTORC2). Activated 4E‐BP1 is also a consequence of downstream mTORC1 mediated response to PLK1 regulation. Given that all of the above changes are observed in murine lupus, and the observation that PLK1 inhibition ameliorates systemic and renal lupus in mice, the pathogenic cascade shown is likely to be central in lupus pathogenesis.

Similar articles

Cited by

References

    1. Lipsky PE. Systemic lupus erythematosus: an autoimmune disease of B cell hyperactivity. Nat Immunol 2001; 2: 764–766. - PubMed
    1. Apostolidis SA, Lieberman LA, Kis‐Toth K, Crispin JC, Tsokos GC. The dysregulation of cytokine networks in systemic lupus erythematosus. J Interferon Cytokine Res 2011; 31: 769–779. - PMC - PubMed
    1. Lu R, Munroe ME, Guthridge JM et al. Dysregulation of innate and adaptive serum mediators precedes systemic lupus erythematosus classification and improves prognostic accuracy of autoantibodies. J Autoimmun 2016; 74: 182–193. - PMC - PubMed
    1. Morand EF, Mosca M. Treat to target, remission and low disease activity in SLE. Best Pract Res Clin Rheumatol 2017; 31: 342–350. - PubMed
    1. Cassia M, Alberici F, Gallieni M, Jayne D. Lupus nephritis and B‐cell targeting therapy. Expert Rev Clin Immunol 2017; 13: 951–962. - PubMed