. 2022 Feb 11;479(3):337-356.
doi: 10.1042/BCJ20210829.

N-terminal phosphorylation regulates the activity of glycogen synthase kinase 3 from Plasmodium falciparum

Affiliations

N-terminal phosphorylation regulates the activity of glycogen synthase kinase 3 from Plasmodium falciparum

Samuel Pazicky et al. Biochem J. .

Abstract

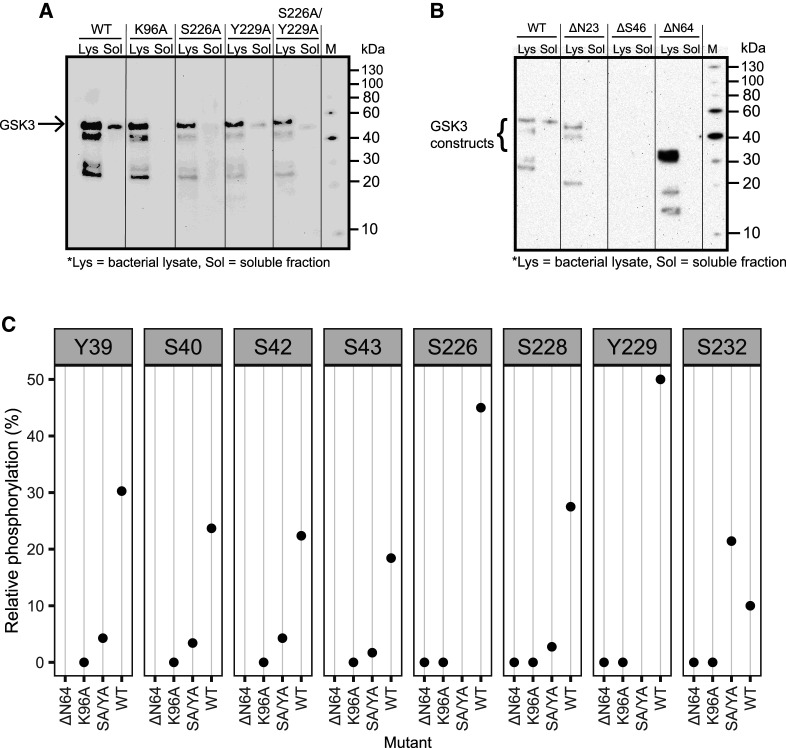
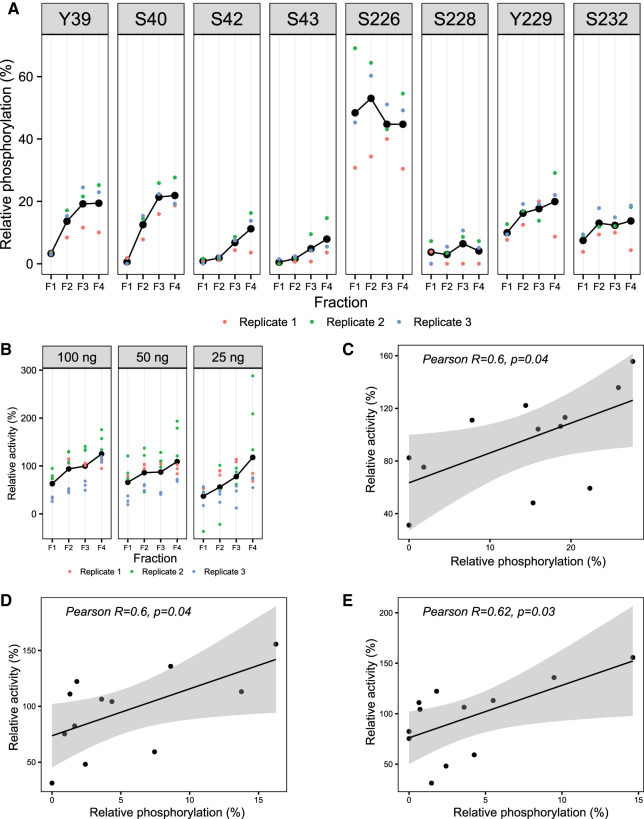
As the decline of malaria cases stalled over the last five years, novel targets in Plasmodium falciparum are necessary for the development of new drugs. Glycogen Synthase Kinase (PfGSK3) has been identified as a potential target, since its selective inhibitors were shown to disrupt the parasitès life cycle. In the uncanonical N-terminal region of the parasite enzyme, we identified several autophosphorylation sites and probed their role in activity regulation of PfGSK3. By combining molecular modeling with experimental small-angle X-ray scattering data, we show that increased PfGSK3 activity is promoted by conformational changes in the PfGSK3 N-terminus, triggered by N-terminal phosphorylation. Our work provides novel insights into the structure and regulation of the malarial PfGSK3.

Keywords: autophosphorylation; drug target; glycogen synthase kinase; malaria; small-angle scattering.


Conflict of interest statement

The authors declare that there are no competing interests associated with the manuscript.

Figures

Figure 1.
Figure 1.. Expression and purification of PfGSK3.
(A) Construct of PfGSK3 used for expression. The construct consists of the full-length sequence of PfGSK3 with an N-terminal His-tag and a 3C cleavage site. The domain organization and phosphorylation sites are marked. NTD is the N-terminal domain, CTD is the C-terminal domain, 3C is the 3C protease cleavage cite. (B) First PfGSK3 purification step: imidazole gradient elution profile from the His-Trap column. (C) Elution profile from the Superdex 200 size exclusion column. (D) NaCl gradient elution profile from Resource Q ion exchange column. The peaks of the ion exchange elution represent fractions that are phosphorylated to different extent, increasing from F1 to F4. The blue curves in the chromatograms show UV absorbance, the green curve shows imidazole concentration and the brown curve shows the conductivity. The peaks in red squares in chromatograms correspond to the red squares in corresponding SDS–PAGE gels.
Figure 2.
Figure 2.. Characterization of PfGSK3.
(A) Circular dichroism shows secondary structure composition similar to what is expected for a GSK3 protein, with 22% α helix, 26% β sheet, 24% turns and 29% disordered content. The circular dichroism was measured 10× and the data were averaged, buffer subtracted, and analyzed by DichroWeb. (B) Thermal unfolding profiles of PfGSK3 in presence or absence of 6 mM dATP. dATP stabilizes PfGSK3, suggesting that it binds in the ATP binding pocket. (C) Catalytic activity of GSK3 follows Michaelis–Menten kinetics. Saturation curve shows the reaction velocity (as calculated in Supplementary Figure S2F) plotted against different substrate concentrations. Michaelis–Menten constant (KM), maximal reaction velocity (Vmax) and turnover number (kcat) were calculated in GraphPad Prism using nonlinear regression. GS-1 = substrate peptide of the human glycogen synthase.
Figure 3.
Figure 3.. Heavy metal ions inhibit PfGSK3 activity.
(A) Analytical size exclusion chromatography profiles on a Superose 6 column of PfGSK3 apoprotein (black), after addition of 8× molar excess of zinc chloride (red) and after subsequent addition of EDTA (blue). The analysis shows that zinc ions induce the formation of high-MW PfGSK3 species. The formation is reversible because addition of EDTA shifts the elution profiles towards higher elution volumes. (B) The activity of PfGSK3 is strongly reduced in the presence of zinc ions, whereas the protein regains the activity after the addition of the metal chelator EDTA. (C) The distance distribution of the PfGSK3 high-MW species induced by zinc ions derived from SAXS data shows high heterogeneity in the sample, peaking at 20 nm but with Dmax = 89 nm.
Figure 4.
Figure 4.. PfGSK3 exhibits autophosphorylation.
(A) IEX elution chromatograms (upper plot) of PfGSK3 after incubation with ATP (red) or cAMP as negative control (black) in the presence of magnesium ions suggest that PfGSK3 exhibits autophosphorylation. The difference between both chromatograms (bottom plot) shows an increase in later-eluting species after ATP treatment, indicating higher amount of phosphorylation. (B) The ATP consumption measured by the luminescence assay in the absence of the substrate is dependent on the enzyme concentration, which is indicative of the autophosphorylation exhibited by PfGSK3. The experiment was performed in triplicates. The colored points (red, green and blue) represent individual replicates, while the large black points are their average.
Figure 5.
Figure 5.. The N-terminus and phosphorylation are essential for PfGSK3.
(A) Small-scale expression test of PfGSK3 mutants with inactivating mutations in the ATP binding site (K96A) and activation loop (Y226A and S229A). Whereas all protein constructs are expressed, only the wild-type PfGSK3 is soluble, which indicates that the autophosphorylation of PfGSK3 is important for its solubility. (B) Small-scale expression test of PfGSK3 constructs N-terminally truncated up to the residues N23, S46 or N64, respectively. In spite of a very strong expression of PfGSK3-N64, none of the proteins is soluble, indicating that the PfGSK3 N-terminus is crucial for the autophosphorylation process. The bacterial lysates (Lys) and their soluble fractions (Sol) were analyzed by Western blot with anti-His antibodies. (C) Analysis of phosphorylation of PfGSK3 mutants by tandem mass spectrometry shows that the phosphorylation is completely lost (K96A, ΔN64) or reduced (S226A/Y229A, labeled here as SA/YA) compared with the wild-type protein (WT). The individual panels (from Y39 to S232) show the extent of phosphorylation in the constructs ΔN64, K96A, SA/YA and the wild-type protein (WT).
Figure 6.
Figure 6.. N-terminal phosphorylation promotes PfGSK3 activity.
(A) Relative phosphorylation of selected residues in the individual wild-type PfGSK3 fractions separated by ion exchange chromatography, measured by tandem mass spectrometry. The relative phosphorylation represents the fraction of all identified residues that were also identified as phosphorylated by LC–MS/MS with Mascot score > 32 and MD score ≥ 5. The data show that the residues in the N-terminal domain are gradually more phosphorylated with increasing IEX elution volume, whereas the phosphorylation at the activation loop remains constant. The different colors represent three biological triplicates. (B) Activity of individual PfGSK3 fractions separated by ion exchange chromatography measured with different PfGSK3 amount (100, 50 and 25 ng). The data show a general trend towards higher activity with increasing phosphorylation in the N-terminal domain. The activity was measured in biological triplicates and at different PfGSK3 concentrations. (CE) Correlation between the relative phosphorylation of the residues S40, S42 and S43 measured by mass spectrometry, respectively, and the relative activity of the same samples (triplicates of fractions F1–F4). The data were fitted with a linear model (black line); the gray background shows the 95% confidence interval.
Figure 7.
Figure 7.. The N-terminus of PfGSK3 changes the structure upon phosphorylation.
(A) Structural models of PfGSK3 predicted by the Robetta server. Five different sequences (wild-type GSK3, mutants S40E, S42E, S43E and a triple mutant S40E/S42E/S43E, in short 3xS/E) were used as an input for the prediction and five models were predicted for each sequence. N-termini (residues 1–65) are red, residues S40, S42 and S43 cyan, the core domains green and C-termini (residues 403–440) blue. The models show a high variation in the predicted structure of N-terminus, ranging from extended to compact conformations. (B) The Robetta model that fits the SAXS data from F1 fraction best display an extended N-terminal helix. The inset shows the zoom of residues S40, S42 and S43 (cyan) that form a part of the N-terminal α-helix. (C) The Robetta model refined against SAXS data from fraction F4 using CORAL with the best fit to the data. The N-terminal helix of this model folds back towards the core of PfGSK3. The zoom in the inset shows that the phosphomimetic glutamates break the α-helix, enabling a bend that allows the N-terminal residues to fold back. (D) Χ2 values of PfGSK3 structures modeled based on five different sequence modifications (WLT, S40E, S42E, S43E and 3xS/E) compared with SAXS data recorded for fractions F1 or F4. The identical models are connected with lines. The size of each point correlates with the radius of gyration of the particular model. Three models with lowest Χ2 values for each F1 and F4 are colored (see legend). (E) Χ2 values of the chosen models refined with CORAL using different strategies, enabling flexibility at either the N-terminus (residues 1–63, strategy A), C-terminus (residues 403–440, strategy C), or at both the C-terminus and residues 47–63 (strategy B). Χ2 values of the original models are shown under ‘O'. (F) The SAXS data measured on the PfGSK3 fraction F1 with the fit of theoretical scattering calculated from the best fitting model (Χ2 = 1.19). (G) The SAXS data measured on the PfGSK3 fraction F4 with the fit of theoretical scattering calculated from the best fitting CORAL-refined model (Χ2 = 1.06). (H) Graphical summary of the strategies used for model refinement against SAXS data using CORAL. The gray box symbolizes that the structure of the model was maintained and the zigzag line symbolizes that the structure was replaced with disordered residues by CORAL.

Similar articles

References

    1. World Health Organization. (2019). World Malaria Report. https://www.who.int/malaria. (accessed 15 Dec. 2019). Available from: https://www.who.int/publications-detail/world-malaria-report-2019
    1. Haldar, K., Bhattacharjee, S. and Safeukui, I. (2018) Drug resistance in plasmodium. Nat. Rev. Microbiol. 16, 156–170 10.1038/nrmicro.2017.161 - DOI - PMC - PubMed
    1. Santos, R., Ursu, O., Gaulton, A., Bento, A.P., Donadi, R.S., Bologa, G.et al. (2017) A comprehensive map of molecular drug targets. Nat. Rev. Drug Discov. 16, 19–34 10.1038/nrd.2016.230 - DOI - PMC - PubMed
    1. Cabrera, D.G., Horatscheck, A., Wilson, C.R., Basarab, G., Eyermann, C.J. and Chibale, K. (2018) Plasmodial kinase inhibitors: license to cure? J. Med. Chem. 61, 8061–8077 10.1021/acs.jmedchem.8b00329 - DOI - PMC - PubMed
    1. Parker, P.J., Caudwell, F.B. and Cohen, P. (1983) Glycogen synthase from rabbit skeletal muscle; effect of insulin on the state of phosphorylation of the seven phosphoserine residues in vivo. Eur. J. Biochem. 130, 227–234 10.1111/j.1432-1033.1983.tb07140.x - DOI - PubMed

Publication types

MeSH terms

Substances