

Identification of Neoantigens in Two Murine Gastric Cancer Cell Lines Leading to the Neoantigen-Based Immunotherapy
- PMID: 35008270
- PMCID: PMC8750027
- DOI: 10.3390/cancers14010106
Identification of Neoantigens in Two Murine Gastric Cancer Cell Lines Leading to the Neoantigen-Based Immunotherapy
Abstract
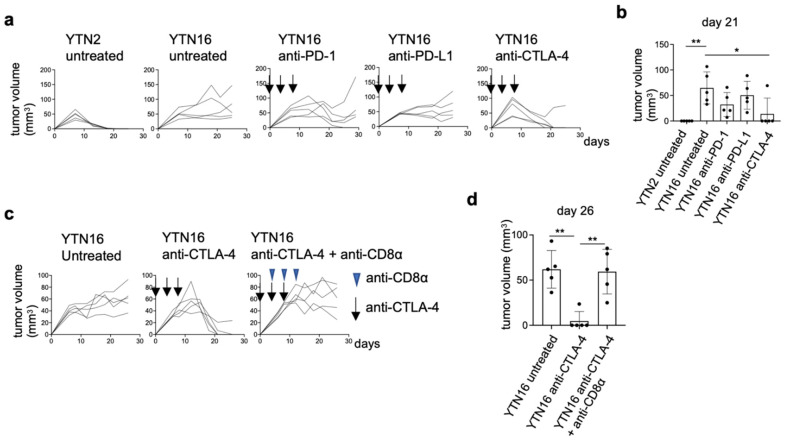
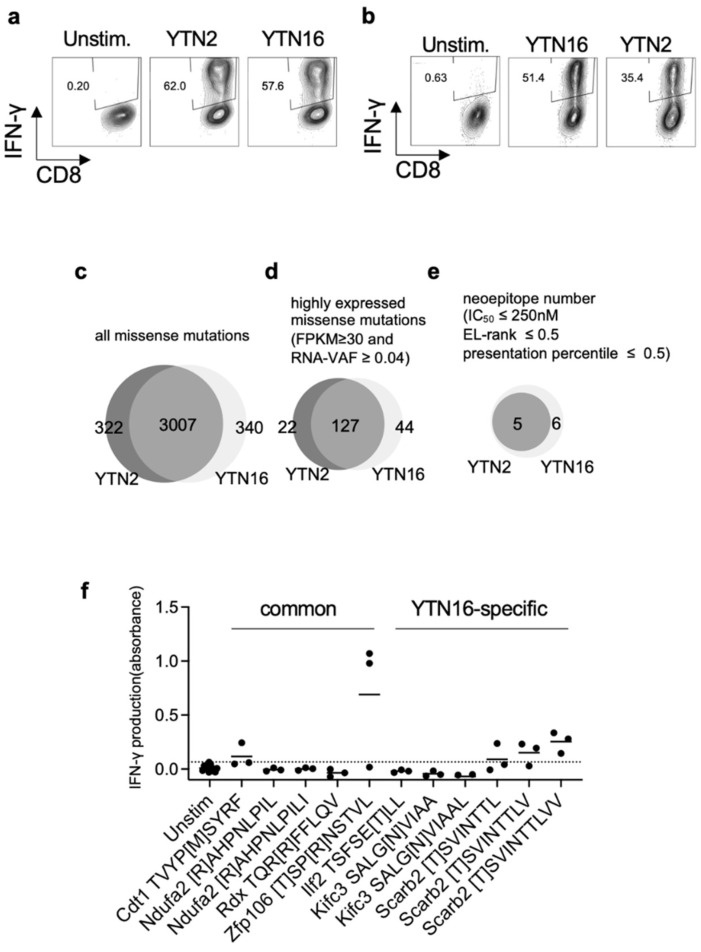
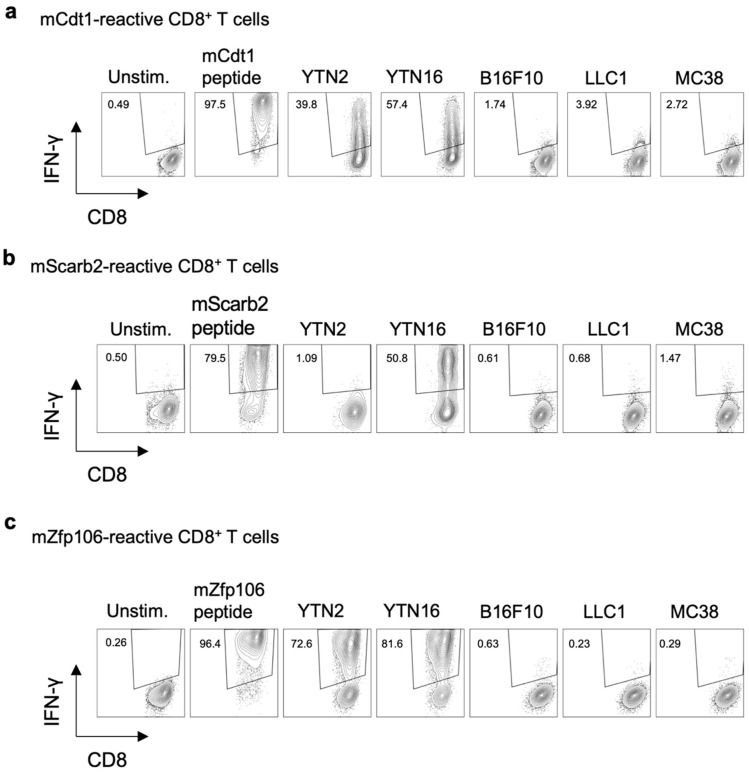
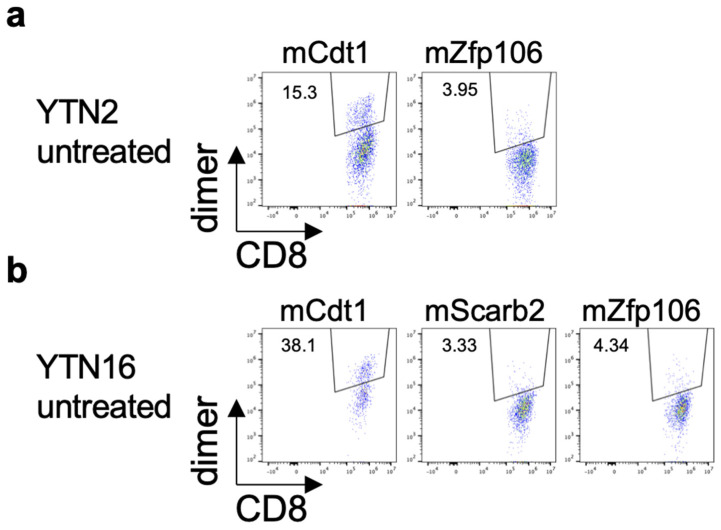
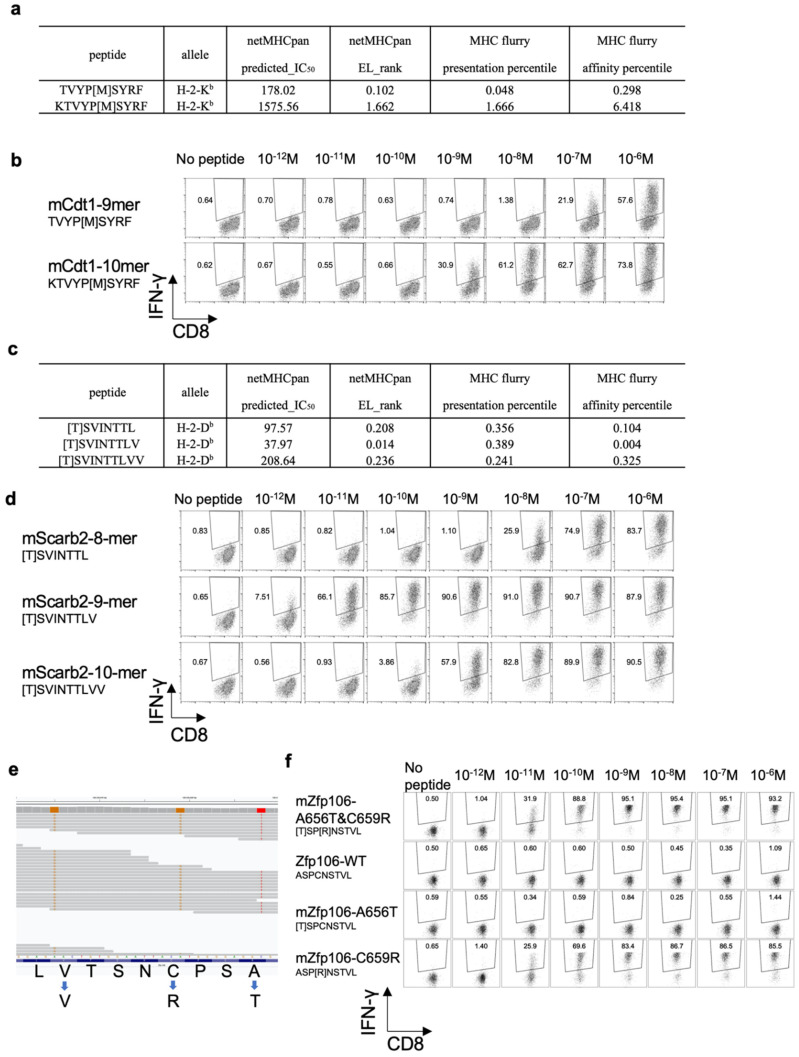
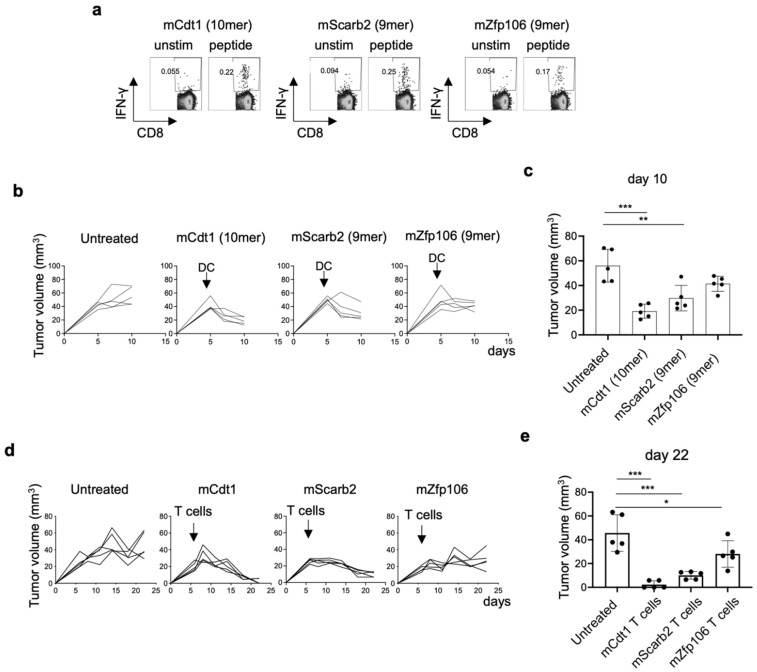
To develop combination immunotherapies for gastric cancers, immunologically well-characterized preclinical models are crucial. Here, we leveraged two transplantable murine gastric cancer cell lines, YTN2 and YTN16, derived from the same parental line but differing in their susceptibility to immune rejection. We established their differential sensitivity to immune checkpoint inhibitors (ICI) and identified neoantigens. Although anti-CTLA-4 mAbs eradicated YTN16 tumors in 4 of 5 mice, anti-PD-1 and anti-PD-L1 mAbs failed to eradicate YTN16 tumors. Using whole-exome and RNA sequencing, we identified two and three neoantigens in YTN2 and YTN16, respectively. MHC class I ligandome analysis detected the expression of only one of these neoantigens, mutated Cdt1, but the exact length of MHC binding peptide was determined. Dendritic cell vaccine loaded with neoepitope peptides and adoptive transfer of neoantigen-specific CD8+ T cells successfully inhibited the YTN16 tumor growth. Targeting mutated Cdt1 had better efficacy for controlling the tumor. Therefore, mutated Cdt1 was the dominant neoantigen in these tumor cells. More mCdt1 peptides were bound to MHC class I and presented on YTN2 surface than YTN16. This might be one of the reasons why YTN2 was rejected while YTN16 grew in immune-competent mice.
Keywords: DC vaccine; adoptive cell therapy (ACT); checkpoint inhibitor; gastric cancer; neoantigen.
Conflict of interest statement
Kazuhiro Kakimi reports grants from TAKARA BIO Inc. outside the submitted work. The Department of Immunotherapeutics, The University of Tokyo Hospital, is an endowed department by TAKARA BIO Inc. The other authors have no competing interests to disclose.
Figures

Similar articles
-
Immunotherapies targeting neoantigens are effective in PD-1 blockade-resistant tumors.Int J Cancer. 2023 Apr 1;152(7):1463-1475. doi: 10.1002/ijc.34382. Epub 2022 Dec 13. Int J Cancer. 2023. PMID: 36451303
-
Deep immunophenotyping at the single-cell level identifies a combination of anti-IL-17 and checkpoint blockade as an effective treatment in a preclinical model of data-guided personalized immunotherapy.J Immunother Cancer. 2020 Oct;8(2):e001358. doi: 10.1136/jitc-2020-001358. J Immunother Cancer. 2020. PMID: 33093158 Free PMC article.
-
Established gastric cancer cell lines transplantable into C57BL/6 mice show fibroblast growth factor receptor 4 promotion of tumor growth.Cancer Sci. 2018 May;109(5):1480-1492. doi: 10.1111/cas.13569. Epub 2018 Apr 15. Cancer Sci. 2018. PMID: 29532565 Free PMC article.
-
The Role of Neoantigens in Cancer Immunotherapy.Front Oncol. 2021 Aug 27;11:682325. doi: 10.3389/fonc.2021.682325. eCollection 2021. Front Oncol. 2021. PMID: 34513673 Free PMC article. Review.
-
The role of neoantigen in immune checkpoint blockade therapy.Exp Hematol Oncol. 2018 Nov 16;7:28. doi: 10.1186/s40164-018-0120-y. eCollection 2018. Exp Hematol Oncol. 2018. PMID: 30473928 Free PMC article. Review.
Cited by
-
Modeling human gastric cancers in immunocompetent mice.Cancer Biol Med. 2024 Jun 28;21(7):553-70. doi: 10.20892/j.issn.2095-3941.2024.0124. Cancer Biol Med. 2024. PMID: 38940675 Free PMC article. Review.
-
Cancer neoepitopes viewed through negative selection and peripheral tolerance: a new path to cancer vaccines.J Clin Invest. 2024 Mar 1;134(5):e176740. doi: 10.1172/JCI176740. J Clin Invest. 2024. PMID: 38426497 Free PMC article. Review.
-
Janus kinase inhibitor overcomes resistance to immune checkpoint inhibitor treatment in peritoneal dissemination of gastric cancer in C57BL/6 J mice.Gastric Cancer. 2024 Sep;27(5):971-985. doi: 10.1007/s10120-024-01514-5. Epub 2024 May 28. Gastric Cancer. 2024. PMID: 38805119 Free PMC article.
-
Twenty-five years of experience with patient-reported outcome measures in soft-tissue sarcoma patients: a systematic review.Qual Life Res. 2024 Dec;33(12):3189-3211. doi: 10.1007/s11136-024-03755-4. Epub 2024 Sep 11. Qual Life Res. 2024. PMID: 39259455 Free PMC article. Review.
-
Transplantable Murine Tumors in the Studies of Peptide Antitumor Vaccines.Oncol Rev. 2024 Jan 8;17:12189. doi: 10.3389/or.2023.12189. eCollection 2023. Oncol Rev. 2024. PMID: 38260723 Free PMC article. Review.
References
-
- Fuchs C.S., Doi T., Jang R.W., Muro K., Satoh T., Machado M., Sun W., Jalal S.I., Shah M.A., Metges J.P., et al. Safety and Efficacy of Pembrolizumab Monotherapy in Patients With Previously Treated Advanced Gastric and Gastroesophageal Junction Cancer: Phase 2 Clinical KEYNOTE-059 Trial. JAMA Oncol. 2018;4:e180013. doi: 10.1001/jamaoncol.2018.0013. - DOI - PMC - PubMed
-
- Kang Y.K., Boku N., Satoh T., Ryu M.H., Chao Y., Kato K., Chung H.C., Chen J.S., Muro K., Kang W.K., et al. Nivolumab in patients with advanced gastric or gastro-oesophageal junction cancer refractory to, or intolerant of, at least two previous chemotherapy regimens (ONO-4538-12, ATTRACTION-2): A randomised, double-blind, placebo-controlled, phase 3 trial. Lancet. 2017;390:2461–2471. doi: 10.1016/S0140-6736(17)31827-5. - DOI - PubMed
-
- Janjigian Y.Y., Shitara K., Moehler M., Garrido M., Salman P., Shen L., Wyrwicz L., Yamaguchi K., Skoczylas T., Campos Bragagnoli A., et al. First-line nivolumab plus chemotherapy versus chemotherapy alone for advanced gastric, gastro-oesophageal junction, and oesophageal adenocarcinoma (CheckMate 649): A randomised, open-label, phase 3 trial. Lancet. 2021;398:27–40. doi: 10.1016/S0140-6736(21)00797-2. - DOI - PMC - PubMed
Grants and funding
LinkOut - more resources
Full Text Sources
Molecular Biology Databases
Research Materials
