. 2022 Jan 7;5(4):e202101342.
doi: 10.26508/lsa.202101342. Print 2022 Apr.

Rbfox1 is required for myofibril development and maintaining fiber type-specific isoform expression in Drosophila muscles

Affiliations

Rbfox1 is required for myofibril development and maintaining fiber type-specific isoform expression in Drosophila muscles

Elena Nikonova et al. Life Sci Alliance. .

Abstract

Protein isoform transitions confer muscle fibers with distinct properties and are regulated by differential transcription and alternative splicing. RNA-binding Fox protein 1 (Rbfox1) can affect both transcript levels and splicing, and is known to contribute to normal muscle development and physiology in vertebrates, although the detailed mechanisms remain obscure. In this study, we report that Rbfox1 contributes to the generation of adult muscle diversity in Drosophila Rbfox1 is differentially expressed among muscle fiber types, and RNAi knockdown causes a hypercontraction phenotype that leads to behavioral and eclosion defects. Misregulation of fiber type-specific gene and splice isoform expression, notably loss of an indirect flight muscle-specific isoform of Troponin-I that is critical for regulating myosin activity, leads to structural defects. We further show that Rbfox1 directly binds the 3'-UTR of target transcripts, regulates the expression level of myogenic transcription factors myocyte enhancer factor 2 and Salm, and both modulates expression of and genetically interacts with the CELF family RNA-binding protein Bruno1 (Bru1). Rbfox1 and Bru1 co-regulate fiber type-specific alternative splicing of structural genes, indicating that regulatory interactions between FOX and CELF family RNA-binding proteins are conserved in fly muscle. Rbfox1 thus affects muscle development by regulating fiber type-specific splicing and expression dynamics of identity genes and structural proteins.


Figures

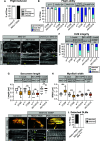
Figure 1.
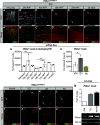
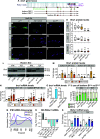
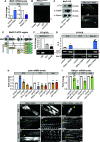
Figure 1.. Rbfox1 is differentially expressed between fibrillar and tubular muscle.
(A, B, C, D, E, F) The Rbfox1CC00511 (Rbfox1-GFP) protein trap line was used to study expression of Rbfox1. (A, A′) Wing discs of L3 larvae (propidium iodide, red). (B, B′) Indirect flight muscles (IFMs) at 24 h after puparium formation (APF) show Rbfox1 expression in completely split templates. (C, C) IFMs at 40 h APF with Rbfox1 expression during initiation of assembly of sarcomere structure. (D, D, E, E) IFMs at 58 and 72 h APF during sarcomere maturation. (F, F) Rbfox1 is expressed in 2-d-old adult IFMs. (Arrows indicate GFP positive nuclei. GFP, green; phalloidin-stained actin, red; Scale bars = 10 μm.). (G, H) mRNA-Seq data from w1118 reported as normalized counts show differential expression of Rbfox1 across IFM development (G) and between 1 d adult fiber types (H). Significance calculated with DESeq2 (*P < 0.01, **P < 0.001, ***P < 0.0001). (I, J, K, L) Confocal microscopy of the Rbfox1–GFP (Rbfox1CC00511) line shows Rbfox1 expression in adult tubular muscles including abdominal muscles, tergal depressor of the trochanter, gut and leg. (I′, J′, K′, L′) Merged channel images in I′, J′, K′ and L′ show GFP in green and phalloidin-stained actin in red. Scale bars = 2 μm. (M) qPCR and representative semi-quantitative gel images showing relative expression of Rbfox1 at the mRNA level in adult Canton-S across muscle fiber types. RpL32, also known as RP49, was used as a normalizing control. Source data are available online for this figure.
Figure S1.
Figure S1.. Rbfox1 is differentially expressed between myofiber types and necessary for tubular muscle development.
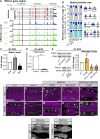
(A) Scheme of Rbfox1 gene region illustrating different isoforms (exons, red; UTR, black) and sequences targeted by the hairpins used in this manuscript (Rbfox1-RNAi, yellow; Rbfox1-IR27286, light orange; Rbfox1-IRKK110518, dark orange). Not drawn to scale. Normalized read counts from mRNA-Seq data show Rbfox1 expression levels in indirect flight muscles (IFMs) from w1118 (blue), bru1-IR (light blue), and salm mutants (green), as well as tubular jump muscle (tergal depressor of the trochanter [TDT], light green) and whole legs (dark green). (A, B) Splice junction reads from mRNA-Seq data in (A) show preferential use of Rbfox1 exons in fibrillar and tubular muscle. Data presented as percent of junction reads supporting a given splice event as diagrammed on the right for exons 7, 12, 14/15 and 17/18. (C) Fold change in Rbfox1 expression between IFM and tubular muscle from semi-quantitative RT–PCR of w1118. Data normalized to RpL32 expression levels. (D, E) Knockdown efficiency in IFMs with Rbfox1-RNAi (D) from RT-qPCR and Rbfox1-IR27286 and Rbfox1-IRKK110518 (E) from semi-quantitative RT–PCR. (C, D, E) Significance in (C, E) determined by ANOVA and post-hoc Tukey and in (D) by paired t test (ns, not significant; *P < 0.05, **P < 0.01, ***P < 0.001). Error bars indicate SD. (F, G, H, I, J, K, L, M, N, O) Single-plane confocal images in the center of tubular TDT (F, G, H, I, J) and abdominal muscle (K, L, M, N, O) muscles showing myofibril (phalloidin-stained actin, magenta) and nuclear (DAPI, green) arrangement in w1118, bru1M2, Rbfox1-IR27286, Dcr2-enhanced Rbfox1-IR27286, and Rbfox1-IRKK110518 genotypes. Myofibrils invade the space between nuclei after Rbfox1 knockdown (white arrows). (P, Q) Examples of severe phenotypes with complete loss of myofibril structure in TDT (P) and abdominal muscle (Q) with Rbfox1-IRKK110518. Scale bars = 5 μm. Source data are available online for this figure.
Figure 2.
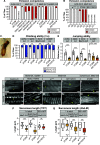
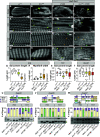
Figure 2.. Rbfox1 is necessary for tubular tergal depressor of the trochanter (TDT) and abdominal muscle (Abd-M) development.
(A) Quantification of the percent of pupae that eclose for controls and Rbfox1 knockdown flies. Genotypes as labeled. (B) Quantification of the percent of pupae that eclose for UAS-Dcr2, Mef2-Gal4–driven Rbfox1-IR27286 and Rbfox1-IRKK110518 knockdown at 22°C, 25°C, and 27°C. (C) Representative image of the eclosion defect in Rbfox1-RNAi. (D) Quantification of climbing ability measured by how many flies are able to climb 5 cm in 3 s. (E) Quantification of jumping ability measured as the distance in cm a startled fly can jump. (D, E) Error bars in (D, E) show SD. (F, G, H, I, J, K, L, M, N, O) Single-plane confocal images showing myofibril and sarcomere morphology of the TDT (F, G, H, I, J) and Abd-M (K, L, M, N, O). (G, I, J, L, N, O) Myofibril structure is altered in Rbfox1 knockdown conditions, including disorganized myofibril structure (arrow in G, I), frayed myofibrils (arrow in J, O), and loss of sarcomere architecture (arrow in L, N). “Z” indicates z-discs. Scale bars = 5 μm. (P, Q) Quantification of sarcomere length in TDT (P) and Abd-M (Q). Boxplots are shown with Tukey whiskers, with outlier data points marked as dots. (D, E, P, Q) Significance in (D, E, P, Q) determined by ANOVA and post-hoc Tukey (ns, not significant; *P < 0.05; **P < 0.01; ***P < 0.001). Source data are available online for this figure.
Figure S2.
Figure S2.. Rbfox1 is necessary for development of fibrillar indirect flight muscles (IFMs).
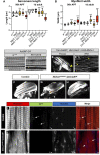
(A, B) Quantification of sarcomere length (A) and myofibril width (B) in IFMs at 90 h after puparium formation and 1 d adult with Rbfox1 knockdown and in bru1M2 mutants. Significance determined by ANOVA and post-hoc Tukey (ns, not significant; ***P < 0.001). (C, D) Single-plane confocal images showing normal sarcomere structure (phalloidin-stained actin, greyscale) in both control (C) and Act88F-Gal4 driven Rbfox1-IRKK110518 (D). Scale bars = 5 μm. z-disc, “z.” (E) Polarized light microscopy (E) of hemithoraxes with UH3-Gal4 driven overexpression of Rbfox1 reveals torn IFM myofibers (yellow arrowhead). (E′) A single-plane confocal micrograph (E′) showing thin and torn myofibrils (yellow arrows) with short sarcomeres in Rbfox1 OE IFMs. (F, G, H) Confocal projections of hemithoraces showing IFM myofiber structure in control (F) and Rbfox1 knockdown using the deGradFP system (G, H). Rbfox1CC00511-deGradFP flies have torn (orange arrow) and fewer intact myofibers (asterisks). (I, J) Confocal images of Rbfox1CC00511-deGradFP flies (J) show actin accumulation (arrow in J) and loss of sarcomere structure (arrowhead in J) as compared to the control (I), and confirm deGradFP efficiency (GFP expression in I marked by arrows). Full genotypes: control, (pUASP1-deGradFP/CyO; Rbfox1CC00511/TM6, Tb) and knockdown, Rbfox1CC00511-deGradFP, (pUASP1-deGradFP/CyO; Rbfox1CC00511/Mef2-Gal4). Scale bars = 2 μm. Source data are available online for this figure.
Figure 3.
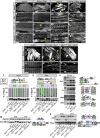
Figure 3.. Rbfox1 knockdown results in indirect flight muscle (IFM) myofibril defects and hypercontraction-mediated myofiber loss.
(A, B) Quantification of flight ability after Rbfox1 knockdown. Genotypes as noted. (C, C′, D, D′, E, E′) Confocal Z-stack images (C, D, E) of IFM myofiber structure (Scale bars = 5 μm) and single-plane images (C′, D′, E′) of myofibril and sarcomere structure after Rbfox1 knockdown. Arrows mark examples of frayed or torn myofibrils (arrow in D′, E′). (C, D, E, F) Quantification of myofiber ripping and detachment phenotypes in (C, D, E). (C′, D′, E′, G, H) Quantification of IFM sarcomere length and myofibril width in (C′, D′, E′). Boxplots are shown with Tukey whiskers, with outlier data points marked as dots. Significance determined by ANOVA and post hoc Tukey (ns, not significant; *P < 0.05; **P < 0.01; ***P < 0.001). (I, I′, J, J′, K, K′) Polarized microscopy images (I, J, K) and single-plane confocal images (I′, J′, K′) of hemithorax from wild-type (I, I′), Rbfox1-RNAi (J, J′) and Rbfox1-RNAi, MhcP401S (K, K′) flies. The MhcP401S allele suppresses myofiber loss and sarcomere phenotypes. (J′) Arrows in (J′) indicate zebra bodies. (J, K, L) Quantification of myofiber detachment in (J, K). Source data are available online for this figure.
Figure S3.
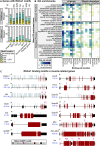
Figure S3.. Bioinformatic identification of muscle genes with putative Rbfox1 binding motifs.
(A) Summary plot of the percent of genes in a category with an Rbfox1 motif in a UTR region (yellow), CDS (cyan), or both regions (gold). Genes with additional motifs in introns are denoted by vertical lines. Rbfox1 motif instances were identified in the transcriptome using the oRNAment database (Bouvrette et al, 2020) or genome-wide using PWMScan (Ambrosini et al, 2018). Categories include RNA-binding proteins, transmembrane proteins, transcription factors, sarcomeric proteins, genes identified to have an RNAi phenotype in muscle (Schnorrer et al, 2010) (Muscle phenotype), and genes identified to be fibrillar muscle specific (Spletter et al, 2015) (Fibrillar genes). Category membership from (Spletter et al, 2018). N denotes the total number of genes in each category. Expected values are simulated assuming random groupings of 100–3,000 genes. (B) Select molecular function and biological process Gene Ontology term enrichments in all genes or muscle phenotype genes with an Rbfox1 binding motif (full analysis available in Table S1). (C) Schematic of Rbfox1 motif instances in muscle genes including RNA-binding proteins Rbfox1, bru1, and mbl, transcription factors Mef2, exd, and salm, and structural proteins Act88F, wupA, Fhos, Zasp52, Zasp66, Zasp67, Mhc, Strn-Mlck, and sls. Rbfox1 binding motifs from PWMScan are marked with vertical blue lines, and magenta arrowheads denote sites identified in the more conservative oRNAment dataset. Exon, red box; UTR, black box; locus size, blue text. Source data are available online for this figure.
Figure 4.
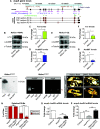
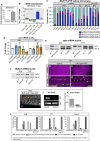
Figure 4.. Rbfox1 regulates expression of structural proteins in indirect flight muscles (IFMs).
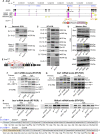
(A) Scheme of the wupA genomic locus. IFMs, tergal depressor of the trochanter and other tubular muscles express different wupA isoforms. The location of Rbfox1 motifs (light blue), RT–PCR primer pairs (greens) and lesions in the wupAfliH and wupAhdp-3 mutants (brown) are noted. Both classic (magenta) (Barbas et al, 1993) and currently annotated (FB2021_05, purple) exon numbers are provided. Exons with an asterisk have multiple, consecutive numbers. (B) Western blot for TnI, Act88F, and Tubulin protein levels in Rbfox1-RNAi IFMs. (B, C, D) Quantification of TnI (C) and Act88F (D) expression levels from (B), normalized against Tubulin signal. (E) Western blot for TnI, Act88F, and Tubulin protein levels in IFMs with UH3-Gal4 driven Rbfox1 overexpression (Rbfox1 OE). (E, F, G) Quantification of TnI (F) and Act88F (G) expression levels from (E), normalized against Tubulin signal. (C, D, F, G) Error bars in (C, D, F, G) show SD; data from three biological replicates. Significance is from paired t test (ns, not significant; *P < 0.05; **P < 0.01). (H) Western blot confirming Rbfox1-GFP (Rbfox1CC00511) is selectively immunoprecipitated with anti-GFP antibody. (I, I′) Gels showing RNA immunoprecipitation (RIP) followed by RT–PCR from Rbfox1-GFP thoraces. (I, I′) mRNA from Act88F (I), which does not have an Rbfox1 motif in the UTR region, is not detected via RIP, whereas wupA (TnI) mRNA can be detected via RIP (red arrowhead, I′), indicating direct Rbfox1 binding. (J, K, L, M) Polarized microscopy images of hemithoraxes from wupAfliH hemizygous males (J), wupAfliH, Rbfox1-RNAi males (K), wupAhdp-3/+ heterozygous females (L), and wupAhdp-3/+, Rbfox1-RNAi females (M) with detached IFM myofibers (cyan arrow). Scale bars = 100 μm. (I, J, K, L, N) Quantification of myofiber attachment in (I, J, K, L) reveals a partial rescue in wupAhdp-3/+, Rbfox1-RNAi females. Significance is from paired t test, **P < 0.01. (O) RT-qPCR for wupA mRNA transcript levels in IFMs from Canton-S, wupAfliH, and wupAfliH, Rbfox1-RNAi males. (P) RT-qPCR for wupA-6b1 mRNA transcript levels in IFMs from Canton-S, wupAhdp-3/+, and wupAhdp-3/+, Rbfox1-RNAi females. Significance is from paired t test (ns, not significant; ***P < 0.001).
Figure S4.
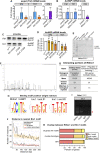
Figure S4.. Rbfox1 regulates mRNA levels of target genes and interacts with translation and nonsense-mediate decay factors.
(A, B) Quantification of fold change in mRNA expression levels of wupA (A) and Act88F (B) in indirect flight muscles (IFMs) and tergal depressor of the trochanter (TDT) from Rbfox1-RNAi and Rbfox1 OE by RT-qPCR and wupA levels (A) in IFMs and TDT from Rbfox1-IRKK110518 by semi-quantitative RT–PCR. Data is normalized against RpL32 signal. Significance is from paired t test (ns, not significant; **P < 0.01). (C, D) Semi-quantitative RT–PCR gel images (C) and quantification (D) for Act88F transcript levels in IFMs and TDT from Rbfox1-IR27286 and Rbfox1-IRKK110518. Significance determined by ANOVA and post hoc Tukey (ns, not significant; *P < 0.05), error bars show SD. (E) SDS gel showing bands from input, pre-cleared lysate, proteins immunoprecipitated using IgG isotype antibody (control), and proteins immunoprecipitated using anti-GFP antibody from the thoraces of the Rbfox1-GFP (Rbfox1CC00511) line. Numbers 1 and 2 indicate immunoprecipitation from two biological repeats. Unique bands in the IP sample were cut and processed for mass spectrometric analysis. (F) Peaks showing m/z ratios using MALDI-TOF. (G) Possible interacting partners of Rbfox1 with a high Protein score include eIF4a and Rent1. *Protein score is −10*log(P), where P is the probability that the observed match is a random event. Scores > 50 are significant (P < 0.05). (H) Position weight matrices for Rbfox1 and Bru1 obtained from oRNAment and used to search motif instances genome-wide in PWMScan. (I) Gel showing RT–PCR amplification of bru1 (red arrowhead) from RNA immunoprecipitation using the Rbfox1CC00511 line. (J) Plot of the distance from an Rbfox1 motif to the nearest Bru1 motif in the oRNAment dataset. Distances were determined genome-wide or in the subset of muscle phenotype genes. Expected distributions were calculated assuming random distribution of Bru1 motifs. (K) Plot of the percent of genes with both Rbfox1 and Bru1 motif instances in the oRNAment dataset. Source data are available online for this figure.
Figure 5.
Figure 5.. A cross-regulatory interaction exists between Rbfox1 and Bru1.
(A) Diagram of the bruno1 (bru1) locus. Representative isoforms including bru1-RA and bru1-RB (bru1-RBlong, annotated full length), as well as a novel bru1-RBshort isoform which splices over exon 7 resulting in a frame shift and early truncation (see also Fig S5J), are illustrated. Exons, red; UTR, black. In the bru1M2 allele (purple), the modification cassette containing a strong splice acceptor followed by a triple frame stop inserted upstream of exon 12, resulting in a strong hypomorphic allele (see also Fig S5A–E). Rbfox1 binding motif instances (light blue lines) and the target region of the rabbit anti-Bru1 antibody (magenta) are indicated. RT–PCR primers, green. Not drawn to scale. (B, C, D, E, F, G, H, I, J) Confocal images of immunostaining with rabbit anti-Bru1 in indirect flight muscles (IFMs) (B, C, D), tergal depressor of the trochanter (TDT) (E, F, G), and abdominal muscle (H, I, J). (C, D, F, G, I, J) Bru1 signal is reduced in IFMs with Rbfox1-IRKK110518 (C, F, I) and undetectable via immunofluorescence in bru1M2 mutant muscle (D, G, J). Bru1, green; DAPI, magenta; Scale bars = 5 μm. (B, C, D, E, F, G, H, I, J, K) Quantification of Bru1 fluorescence levels in (B, C, D, E, F, G, H, I, J). Boxplots are shown with Tukey whiskers. Significance determined by ANOVA and post hoc Tukey in comparison to both wild-type (w1118) and Gal4 alone (Mef2-Gal4 x w1118) controls (ns, not significant; *P < 0.05; ***P < 0.001). (L) Western blot of Bru1 protein levels in IFMs and TDT from Rbfox1-IR27286 (left) and Rbfox1-IRKK110518 (right) knockdown flies. Levels of isoform Bru1-PA (at 64 kD) do not change, whereas levels of the Bru1-PB isoform (at 88 kD) decrease in Rbfox1-IRKK110518 muscle. H2AZ was used as a loading control. (L, M) Quantification of fold change in band intensity in (L), normalized to H2AZ and control IFM expression levels. w1118, white; Rbfox1-IR27286, light orange; Rbfox1-IRKK110518, dark orange. (N) Quantification of fold change in band intensity from semi-quantitative RT–PCR with primers specific to bru1-RB (primers 5 + 8) or common to all bru1 isoforms (primers 14 + 17) (representative gel images in Fig S5F–H). Intensity was normalized to RpL32 (RP49) and control IFM expression levels. Error bars represent SD. Significance determined by ANOVA and post-hoc Tukey (ns, not significant; *P < 0.05; **P < 0.01, ***P < 0.001). (O) Quantification of RT-qPCR data for bru1 transcript levels in IFMs from Rbfox1-RNAi (left) or Rbfox1 OE (right). Significance is from paired t test (**P < 0.01; ***P < 0.001). (N, P) Quantification of relative expression level of bru1-RBlong versus bru1-RBshort in the indicated genotypes. (N) Significance as in (N). (Q) Standard normal count values for Rbfox1 (magenta) and bru1 (blue) from an mRNA-Seq developmental timecourse of wildtype IFMs (Spletter et al, 2018). Rbfox1 and bru1 have opposite temporal expression profiles until 72 h after puparium formation (APF). (R) Differential expression of Rbfox1 in mRNA-Seq data based on DESeq2 comparison of IFMs versus TDT (1 d adult), IFMs versus salm−/− IFMs (1 d adult), IFMs versus bru1-IR IFMs (30 h APF, 72 h APF, 1 d adult), and IFMs versus bru1M3 IFMs (ns, not significant; *P < 0.05). (S) RT–PCR quantification of fold change in Rbfox1 transcript level from IFMs and TDT with altered levels of Bru1 expression including bru1-IR (light blue), bru1M2 (dark blue) and UAS-Bru1 overexpression (purple) with UH3-Gal4, Mef2-Gal4 and Act79B-Gal4 (representative gel images Fig S5I). (N) Errors bars represent SD, significance as in (N). Source data are available online for this figure.
Figure S5.
Figure S5.. Nature of the hypomorphic bru1M2 allele and cross-regulation of Bru1 and Rbfox1 expression levels.
(A) Scheme of the C-terminal region of the Bru1 locus denoting the location of the RNA recognition motif domains (blue), the sgRNAs used for CRISPR (light orange), target region of anti-Bru1 antibody (dark orange), the homology arms (tan) and the location of construct insertion upstream of exon 12. The transgenesis construct contains a strong splice acceptor (SA, light blue) followed by a triple frame stop (stop, red) and SV40 polyadenylation signal (white) and a selectable 3xP3-dsRed marker flanked by homology arms. Note that the right homology arm of the construct contains exon 21. Exon numbering according to the annotation FB2021-05. (B, C) Representative gel image of PCR from genomic DNA (B) and RT–PCR from total RNA (C) of w1118 control and bru1M2 whole thorax samples. Primer locations are denoted on the left (forward-reverse) and band length is noted on the right with a black arrowhead. (D) Representative Western blot images for Bru1 in indirect flight muscles (IFMs) of Rbfox1-IR27286 and bru1-IR (top) and bru1M2 (middle) flies. Bru1 in the middle panel is full-length Bru1-PA expressed and purified from Escherichia coli. Endogenous Bru1 expression is shown for different tissues including whole abdomen, ovaries, testis, and IFMs (bottom). H2AZ was used as a loading control. (E) Scheme of alternative splice events detected in the hypomorphic bru1M2 allele. Splicing from exon 9 is redirected into the SA-stop cassette. We detect splicing over the SA into exon 21 contained in the right homology arm of the insertion cassette as well as a reduced level of the normal splice event from exon 9 into exon 12. These “normal” transcripts, however, do not contain any of the 3′-UTR exons 19, 20, or 21. (F, G, H) Representative gel images of semi-quantitative RT–PCR of IFMs and tergal depressor of the trochanter from w1118 control, Rbfox1-IR27286 (F), Dcr2-enhanced Rbfox1-IR27286 (G), or Rbfox1-IRKK110518 (G, H) flies. RT–PCR was performed with bru1-RB specific (5 + 8), N-terminal (7 + 8), or C-terminal (14 + 17) primers with RpL32 as a control. (I) Representative gel images of Rbfox1 mRNA expression levels from semi-quantitative RT–PCR of IFM and tergal depressor of the trochanter from bru1-IR, bru1M2, or Bru1 OE flies. (F, G, J) Sequencing results confirming the identity of the bru1-RBlong and bru1-RBshort bands in (F, G). bru1-RBshort is the result of an unannotated splice event from exon 5 directly into exon 8, resulting in a frame shift and early stop that terminates the Bru1 protein and produces an isoform lacking all RNA recognition motif domains. Codons in open reading frame and corresponding amino acids as noted. Exon 5, orange; exon 7, light blue; exon 8 light grey. Source data are available online for this figure.
Figure 6.
Figure 6.. Rbfox1 and Bru1 genetically interact in indirect flight muscle (IFM) myogenesis and regulate the alternative splicing of sarcomere genes.
(A, B, C, D) Confocal projections of hemithoraces showing IFMs (A, B, C, D) from w1118, bru1M2, Rbfox1-IR27286 and bru1M2, Rbfox1-IR27286 flies. Arrowheads indicate aberrant, torn myofibers. Scale bars = 100 μm. (E, F, G, H) Single-plane confocal images from IFMs, showing torn myofibrils (yellow arrows) with short sarcomeres and actin inclusions (cyan arrows) in bru1M2 (F) and Rbfox1-IR27286 (G). (H) bru1M2, Rbfox1-IR27286 demonstrates genetic interaction and loss of myofibril structure (H). (I, J, K, L, M, N, O, P) Single-plane confocal images from tergal depressor of the trochanter (I, J, K, L) and abdominal muscle (M, N, O, P) from w1118, bru1M2, Rbfox1-IR27286 and bru1M2, Rbfox1-IR27286 flies. Myofibrils in Rbfox1 knockdown muscles are disorganized (orange arrows), have actin inclusions (cyan arrows) and are often torn (yellow arrows). Scale bars = 5 μm. (Q, R) Quantification of sarcomere length (Q) and myofibril width (R) in IFMs. (S, T) Quantification of sarcomere length in tergal depressor of the trochanter (S) and abdominal muscle (T). Boxplots are shown with Tukey whiskers, with outliers denoted by dots. Significance determined in comparison to w1118 by ANOVA and post hoc Tukey (ns, not significant; *P < 0.05; ***P < 0.001). (U, V, W) RT–PCR for select alternative splice events in Zasp52 (U), Zasp66 (V) and Zasp67 (W). Top: Diagram of alternative isoforms and primer locations. The location of predicted motifs for Rbfox1 (magenta) and Bru1 (blue) are indicated. Diagrams are oriented according to transcript 5′ to 3′. Exon numbers according to annotation FB2021_05. 3′-UTR regions, tan; color coding of select isoforms consistent across top, middle and bottom panels. Middle: Quantification of relative expression level of detectable events. Bottom: RT–PCR gel image. Genotypes as labeled. Ladder in the far-left lane. Source data are available online for this figure.
Figure S6.
Figure S6.. Rbfox1 and Bru1 genetically interact to regulate alternative splicing and muscle contractility.
(A, B, C, D) Confocal projections of hemithoraces showing phalloidin-stained indirect flight muscles (IFMs) of Canton-S, Rbfox1-RNAi, bru1-IR, and double Rbfox1-RNAi, bru1-IR knockdown. Scale bars = 100 μm. (E, F, G, H, I, J, K, L, M, N, O, P) Single-plane confocal images of myofibril and sarcomere structure of the IFMs (E, F, G, H), tergal depressor of the trochanter (I, J, K, L), and abdominal muscle (M, N, O, P) of Canton-S, Rbfox1-RNAi, bru1-IR, and double Rbfox1-RNAi, bru1-IR knockdown. Torn myofibers or myofibrils, arrowheads; abnormal actin accumulations, arrows. Scale bars = 10 μm. (Q, Q′, R, R′, S, S′) Polarized microscopy images (Q, R, S) and single-plane confocal images (Q′, R′, S′) showing IFM myofiber and myofibril structure in control (Q, Q′), in Mhc-Gal4 driven Bru1-PA overexpression (R, R′) or with Bru1 overexpression in an MhcP401S mutant background (S, S′). Myofiber tearing (yellow arrowheads in R) and myofibril rupture (yellow arrows in R′) observed with Bru1 OE are partially rescued by using the MhcP401S allele. “Z” marks the Z-disc. Scale bars = 2 μm. (T, U) RT–PCR for select fiber type–specific alternative splice events in wupA (T) and Mhc (U). Top: Diagram of alternative isoforms and primer locations. The location of motifs for Rbfox1 (magenta) and Bru1 (blue) are indicated. Diagrams are oriented according to transcript 5′ to 3′. Exon numbers according to annotation FB2021_05. UTR regions, tan; color coding of select isoforms consistent across top, middle and bottom panels. Middle: Quantification of relative expression level of detectable events. Bottom: representative RT–PCR gel image. Genotypes as labeled. Ladder in the far-left lane. (V, W, X) Representative RT–PCR gels for alternative splice events in Tm1, tn, rhea and sals in whole thorax (V), Strn-Mlck (W), sls, and Fhos in IFMs and tergal depressor of the trochanter (X), and an example of RpL32 expression included as a control in all RT–PCR experiments (W). Diagrams of alternative exons, primer locations and Rbfox1/Bru1 binding motifs are displayed on the right. Source data are available online for this figure.
Figure 7.
Figure 7.. Rbfox1 regulates expression of myogenic transcription factors and genetically interacts with salm in indirect flight muscle (IFM) development.
(A) RT-qPCR quantification of the fold change in Mef2 mRNA expression in IFMs with Rbfox1-RNAi (blue) or Rbfox1 OE (purple). Significance is from paired t test (*P < 0.05). (B) RNA immunoprecipitation using the Rbfox1CC00511 line followed by RT–PCR indicates Rbfox1 binds to Mef2 mRNA (red arrowhead). (C) Western blot demonstrating increased expression levels of Actin88F and TnI in IFMs with Mef2 OE. (C′, D, D′) Confocal images of thorax hemisection (D) and IFM myofibrils (C′) with overexpression of Mef2 driven by Mhc-Gal4. Myofibrils show actin accumulations (yellow arrow), but no hypercontraction. “*” indicates IFM myofibers. (E) Diagram of Mef2 5′-UTR region and annotated isoforms. Predicted Rbfox1 motifs marked by magenta arrowheads. UTR regions, tan; primers, black. (F) Semi-quantitative RT–PCR demonstrating that Mef2 isoforms containing exon 17 and thus a short 5′-UTR (see also Fig S7C) are preferentially expressed in wildtype IFMs. Red arrow marks PCR band at 885 base pairs. (G) RT–PCR detects increased use of Mef2-Ex17 in Rbfox1-RNAi IFMs and abdominal muscle. Quantification, top; RT–PCR gel, bottom; arbitrary units (A.U.). (H) Fold change in salm transcript levels in IFMs, tergal depressor of the trochanter (TDT) and Abd after Rbfox1 knockdown as determined by RT-qPCR (Rbfox1-RNAi) and semi-quantitative RT–PCR (Rbfox1-IR27286, Rbfox1-IRKK110518). Data were normalized by RpL32 levels. (I) Fold change in Rbfox1 transcript levels in IFMs, TDT and Abd normalized to RpL32 after salm-IR at 27°C or 29°C, as determined by RT-qPCR (29°C) and semi-quantitative RT–PCR (27°C). Significance determined by ANOVA and post hoc Tukey (ns, not significant; *P < 0.05, **P < 0.01, ***P < 0.001), error bars indicate SD. (J, K, L, M, N, O, P, Q, R) Polarized microscopy images of hemithoraces showing a reduction in myofiber number (stars) with Rbfox1-RNAi (J) and salm-IR (K), and a complete loss of IFMs with double Rbfox1-RNAi, salm-IR knockdown (L). TDT, yellow arrowhead. Scale bars = 100 μm. (M, N, O, P, Q, R) Single-plane confocal images of tubular TDT (M, N, O) and abdominal muscle (P, Q, R) showing abnormal myofibril structure and tearing (arrows) in Rbfox1-RNAi, salm-IR, and Rbfox1-RNAi, salm-IR knockdown. Scale bars = 5 μm. (J, K, L, M, N, O, P, Q, R) Phenotypes from (J, K, L, M, N, O, P, Q, R) are quantified in Fig S7K. Source data are available online for this figure.
Figure S7.
Figure S7.. Rbfox1 regulates myogenic transcription factors including Mef2 and Salm.
(A) RT–PCR confirmation of Mef2 overexpression with Mhc-Gal4. Significance is from paired t test (***P < 0.001). (B) Differential expression of Mef2 in mRNA-Seq data from control indirect flight muscles (IFMs) versus tergal depressor of the trochanter (TDT) (dark green), leg (light green), tubular-converted salm−/ IFMs (green), bru1M3 mutant IFMs (blue), or bru1-IR IFMs (light blue). log2(fold change) and significance P-values (grey values above bars) are from DESeq2 (***P < 0.001), where positive values show preference in wild-type IFMs, whereas negative values show preference in tubular muscle or mutant IFMs. (C) Temporal and fiber type–selective mRNA-Seq splice junction use in the Mef2 5′-UTR region. Data presented as the percentage of junctions that use Mef2-Ex17 (blue), Mef2-Ex20 (magenta), or Mef2-Ex21 (cyan) as the splice donor, reflecting the percent of transcripts that use the short 5′-UTR encoded by exon 17 versus the longer 5′-UTRs encoded by exons 20 and 21. Total junction reads for these events ranged from 22 to 1,453, with an average of 334 ± 124 events per timepoint. (D) RT-qPCR (Rbfox1-RNAi) and semi-quantitative RT–PCR (Rbfox1-IR27286 and Rbfox1-IRKK110518) quantification of the fold change in exd transcript levels in IFMs and TDT. Data were normalized by RpL32 levels. (E) Representative RT–PCR gel image of salm mRNA levels in IFMs (left) and TDT (right) of w1118 control, Rbfox1-IRKK110518, and Rbfox1-IR27286 flies. (F) Representative RT–PCR gel image of Rbfox1 mRNA levels in IFMs or TDT of w1118 control and salm-IR flies. (G, H, H′) Single-plane confocal images from the surface (G, H) or center (G′, H′) of TDT from control (G) or salm/ mutant (H) flies. Mild myofibril organization defects (yellow arrows) are observed in mutant TDT (phalloidin-stained actin, magenta; DAPI-stained nuclei, green). Scale bar = 5 μm. (I) Confocal image of salm-IR IFMs showing a tubular morphology. Scale bar = 2 μm. (J) Confirmation of salm knockdown by semi-quantitative RT–PCR. (K) RT-qPCR showing bru1 levels are down-regulated in salm-IR IFMs. (L) Plots showing quantification of the phenotypes shown in Fig 7J–R (N ≤ 28; three biological repeats). Source data are available online for this figure.
Figure 8.
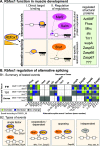
Figure 8.. Model of Rbfox1 function in Drosophila muscle development and alternative splicing.
(A) Rbfox1 regulates transcript levels and alternative splicing of muscle genes. Some transcripts are regulated directly through intronic or UTR binding. Other transcripts are regulated indirectly, as Rbfox1 regulates expression of transcriptional activators Mef2 and Salm as well as the RNA-binding protein Bru1. Ultimately, this defines muscle fiber type–specific expression levels and splice isoform usage of sarcomeric genes. RNA-binding proteins, orange; Rbfox1, blue outline; transcription factors, magenta; structural proteins, green. (B) Rbfox1 regulates alternative splicing of sarcomere genes. All events tested by RT–PCR in this study (see Figs 6 and S6) and their muscle type specificity are summarized in heatmap form (B1). Events are classified as increased (yellow), decreased (blue) or unchanged (grey) after knockdown of Rbfox1 or Bru1. Exons are numbered according to the FB2021_05 annotation. Schematics in B2 illustrate four types of identified events: single factor events regulated by either Rbfox1 or Bru1, cooperative events regulated by both Rbfox1 and Bru1 (or indirect events affected by changes in Bru1 expression in the Rbfox1 knockdown background), opposing events where Rbfox1 and Bru1 have an opposite regulatory effect, and events that are not regulated by either Rbfox1 or Bru1.

Similar articles

Cited by

References

    1. Ambrosini G, Groux R, Bucher P (2018) PWMScan: A fast tool for scanning entire genomes with a position-specific weight matrix. Bioinformatics 34: 2483–2484. 10.1093/bioinformatics/bty127 - DOI - PMC - PubMed
    1. Amir-Zilberstein L, Blechman J, Sztainberg Y, Norton WH, Reuveny A, Borodovsky N, Tahor M, Bonkowsky JL, Bally-Cuif L, Chen A, et al. (2012) Homeodomain protein otp and activity-dependent splicing modulate neuronal adaptation to stress. Neuron 73: 279–291. 10.1016/j.neuron.2011.11.019 - DOI - PMC - PubMed
    1. Anthony JC, Lang CH, Crozier SJ, Anthony TG, MacLean DA, Kimball SR, Jefferson LS (2002) Contribution of insulin to the translational control of protein synthesis in skeletal muscle by leucine. Am J Physiol Endocrinol Metab 282: E1092–E1101. 10.1152/ajpendo.00208.2001 - DOI - PubMed
    1. Aquilina B, Cauchi RJ (2018) Modelling motor neuron disease in fruit flies: Lessons from spinal muscular atrophy. J Neurosci Methods 310: 3–11. 10.1016/j.jneumeth.2018.04.003 - DOI - PubMed
    1. Armstrong RB, Phelps RO (1984) Muscle fiber type composition of the rat hindlimb. Am J Anat 171: 259–272. 10.1002/aja.1001710303 - DOI - PubMed

Publication types