Balancing the length of the distal tip by septins is key for stability and signalling function of primary cilia
- PMID: 34981518
- PMCID: PMC8724769
- DOI: 10.15252/embj.2021108843
Balancing the length of the distal tip by septins is key for stability and signalling function of primary cilia
Abstract
Primary cilia are antenna-like organelles required for signalling transduction. How cilia structure is mechanistically maintained at steady-state to promote signalling is largely unknown. Here, we define that mammalian primary cilia axonemes are formed by proximal segment (PS) and distal segment (DS) delineated by tubulin polyglutamylation-rich and -poor regions, respectively. The analysis of proximal/distal segmentation indicated that perturbations leading to cilia over-elongation influenced PS or DS length with a different impact on cilia behaviour. We identified septins as novel repressors of DS growth. We show that septins control the localisation of MKS3 and CEP290 required for a functional transition zone (TZ), and the cilia tip accumulation of the microtubule-capping kinesin KIF7, a cilia-growth inhibitor. Live-cell imaging and analysis of sonic-hedgehog (SHH) signalling activation established that DS over-extension increased cilia ectocytosis events and decreased SHH activation. Our data underlines the importance of understanding cilia segmentation for length control and cilia-dependent signalling.
Keywords: KIF7; cilia length/segmentation; septins; sonic hedgehog signalling; transition zone.
© 2021 The Authors Published under the terms of the CC BY NC ND 4.0 license.
Conflict of interest statement
The authors declare that they have no conflict of interest.
Figures
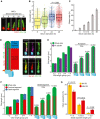
- A, B
Representative images of cilia (A) and dot plots (B) showing primary cilia length variation at different time points after serum‐starvation (SS). Markers in (A) show ARL13B (cilia) and PCNT (Basal body). The graph shows individual length of cilia from three biological replicates (n > 150 cilia per sample and experiment). Scale bar: 1 µm.
- C
Percentage of ciliated RPE1 cells after SS from (A). Three biological replicates, n > 100 cells per sample and experiment repetition.
- D
Representative images show cilia segmentation based on acetylated tubulin (Ac tub), polyglutamylated tubulin (Glu tub), ARL13B and PCNT. The cartoon on the left indicates proximal segments (PS, Glu tub rich‐region) and distal segments (DS). DS were determined by calculating the difference between PS and total cilia length based on ARL13B staining as depicted by the dashed lines on the images. Scale bar: 1.5 µm.
- E
Quantification of (D). Comparative analysis of average cilia length based on Ac tubulin and ARL13B (cilia) staining shown for specified cilia length groups (2 <, 2–3, 3–4 and > 4 µm). Three biological replicates, n = 400 cilia per sample and repetition. The numbers above the cartoons show the ratio of the calculated Ac tub/whole cilia length.
- F
Average length of PS and DS for the cilia length groups depicted. Representative images (D) and quantifications of PS (Glu tub) and whole cilia (ARL13B) length are shown. The numbers above the cartoons show the ratio of the calculated DS/whole cilia length. Three biological replicates, n > 650 cilia per sample and repetition.
- G
Percentage of cilia with depicted DS length after 8 and 48 h SS. Three biological replicates, n > 150 cilia per sample and repetition.
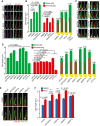
- A
Representative images of 48 h serum‐starved RPE1 cells treated with solvent control (DMSO), cytochalasin D (CytoD) and/or nocodazole (Noco) for 3 h before immunostaining with the indicated antibodies. Scale bar: 3 µm.
- B
Quantification of (A) showing average length of proximal segment (PS, Glu tub) and whole cilia (ARL13B). The numbers above the cartoons show the ratio of the calculated distal segment (DS)/whole cilia length. Three biological replicates, n = 100 cilia per sample and repetition.
- C, D
RPE1 cells were treated with the indicated siRNAs before serum‐starvation for 48 h. Representative immunostained images with indicated antibodies (C) and quantifications of PS (Glu tub) and whole cilia (ARL13B) length (D) are shown. The numbers above the cartoons in (D) show the ratio of the calculated DS/whole cilia length. Scale bar: 2 µm. Three biological replicates, n = 100 cilia per sample and repetition.
- E, F
Cells were treated with the indicated siRNAs before serum‐starvation for 48 h and treatment with DMSO or Noco for 3 h before immunostaining with the indicated antibodies. Representative images (E) and quantification of cilia length based on ARL13B (F) are shown. Scale bar: 2 µm. Three biological replicates, n = 100 cilia per sample and repetition.

Images show the localisation of endogeneous SEPT2 and SEPT7 in RPE1 ARLB13B‐mRuby2 cells with basal body staining. The insets to the right show enlargements of the cilium. Scale bar: 4 µm (large) and 2 µm (small).
STED microscopy images showing ciliated RPE1 cells expressing EGFP‐SEPT2 or SEPT7‐EGFP and stained for ARL13B. Scale bar: 1 µm.
Relative signal intensities were determined along the cilium for the indicated proteins at the ciliary tip (T), middle (M) and base (B) regions as specified in (B) (white lines).
Representative images showing co‐localisation of MKS3 or CEP290 in ciliated RPE1 ARLB13B‐mRuby2 and GFP‐SEPT2 cells. The white arrows point to the specific MKS3 or CEP290 signals. Scale bar: 1 µm.
Line scan measurements show the normalised signal intensities along the cilium for the indicated proteins as specified in (D) (dashed lines).
Effect of nocodazole (Noco) treatment (3 h) on the localisation of endogenous SEPT2 and SEPT7 at cilia in RPE1 cells. The insets show magnifications of the cilium. Scale bar: 5 µm (large) and 2.5 µm (small).
Relative signal intensity of endogenous SEPT2 or SEPT7 along the cilium from (F). SEPT2 or SEPT7 signals at cilia were normalised to the total cilia length. Three biological replicates, n > 90 cilia per sample and repetition.

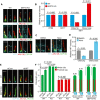
- A, B
Cilia length changes in RPE1 cells treated with the indicated siRNAs and 48 h SS stained with indicated antibodies. Representative images of cilia (A) and quantifications (B) are shown. Dot plots in (B) represent individual cilia. Scale bar: 1.5 µm. Three biological replicates, n = 100 cilia per sample and repetition.
- C, D
Cilia length changes in RPE1 SEPT2‐KO single clones after 48 h SS stained with indicated antibodies. Representative images of cilia (C) and quantifications (D) are shown. Dot plots in (D) represent individual cilia. The parental cells (WT) and four KO clones (C7, C16, C10, C13) derived from two independent gRNAs (g1 and g2, as depicted in Appendix Fig 3E) were analysed. Three biological replicates, n > 80 cilia per sample and repetition. Scale bar: 2 µm.
- E, F
Cilia segmentation in SEPT2‐KO‐ciliated cells serum‐starved for 48 h. Cells were immunostained with the indicated antibodies. Representative images (E) and quantifications of proximal segment (PS, Glu tub) and whole cilia (ARL13B) length (F) are shown. The numbers above the cartoons in (F) show the ratio of the calculated distal segment (DS)/whole cilia length. Scale bar: 2 µm. Three biological replicates, n = 100 cilia per sample and repetition.
- G
Electron microscopy of RPE1 WT and SEPT2‐KO cilia. Black arrows point to the axoneme and basal body (BB). Scale bar: 400 nm.
- H
Quantification of (G). Only cilia detected from bottom (BB) to tip in serial sections were quantified. N > 15 cilia from two independent experiments.
- I, J
RPE1 WT and SEPT2‐KO cells after 48 h SS were treated with solvent control (DMSO), cytochalasin D (CytoD) and/or nocodazole (Noco) for 3 h before immunostaining with the indicated antibodies. Representative images (I) and quantifications of PS (Glu tub) and whole cilia (ARL13B) length (J) are shown. The numbers above the cartoons in (J) show the ratio of the calculated DS/whole cilia length. Scale bar: 3 µm. Three biological replicates, n = 100 cilia per sample and repetition.
- A, B
Representative images show the localisation of IFT88, KIF17 and KIF7 in RPE1 WT and SEPT2‐KO cells after 48 h serum‐starvation (SS) stained with indicated antibodies (A) and quantification of the relative signal intensities for the indicated proteins (B). White arrows point to the base and tip localisation of KIF7. Scale bar: 3 µm. IFT88 and KIF17 signal intensities were normalised to the whole cilia length. KIF7 signal intensity was quantified at ciliary tip or base as indicated in (A) (white arrows). Three biological replicates, n > 80 cilia per sample and repetition.
- C, D
KIF7 localisation at the tip and base of cilia (indicated by arrows) in RPE1 cells after 48 h SS treated for 3 h with solvent control (DMSO) or nocodazole (Noco) and quantification of the relative signal intensities for the ciliary base and tip of KIF7 (D). Scale bar: 2 µm. KIF7 signal intensity was quantified at the ciliary tip or base as indicated in (C) (white arrows). Three biological replicates, at least 80 cilia per sample and repetition.
- E, F
RPE1 WT and SEPT2‐KO cells were treated with control or KIF7 siRNA after 48 h SS and immunostained with the indicated antibodies. Representative images (E) and quantifications of proximal segment (Glu tub) and whole cilia (ARL13B) length (F) are shown. The numbers above the cartoons in (F) show the ratio of the calculated distal segments /whole cilia length. Three biological replicates, n = 100 cilia per sample and repetition. Scale bar: 2 µm.

- A
Localisation of MKS3, CEP290 and NPHP1 in RPE1 WT and SEPT2‐KO after 48 h serum‐starvation (SS) and immunostained with CEP164 (distal appendages), ODF2 (sub‐distal appendages), and ARL13B (cilia) antibodies. White arrows point to the specific signals for MKS3 or CEP290. The white star points to the unspecific MKS3 signal around the centrosome. Low and high exposure times for MKS3, CEP290 and NPHP1 are shown as indicated in the upper panel. Scale bar: 1 µm.
- B, C
Quantification of (A). The length obtained for MKS3 along the cilia (B) and the relative signal intensity of the indicated proteins at the ciliary base (C) are shown. Three biological replicates, n = 100 cilia per sample and repetition.
- D
FRAP experiment of SSTR3‐GFP in RPE1 WT and SEPT2‐KO cells. Cells were serum‐starved for 48 h before the beginning of inspection and imaged every 30 s for 10 min after bleaching. Scale bar: 5 µm. For videos, see Movie EV1 and EV2.
- E
Percentage of normalised SSTR3‐GFP signal recovery at whole cilia after photobleaching from (D). n = 20 cilia are quantified from three biological replicates.
- F, G
Influence of MKS3 depletion on cilia length of RPE WT and SEPT2‐KO cells. Cells were treated with the indicated siRNA and serum‐starved (SS) for 48 h before immunostaining with the indicated antibodies. Representative images (F) and quantifications of proximal segment (Glu tub) and whole cilia (ARL13B) length (G) are shown. The numbers above the cartoons in (G) show the ratio of the calculated distal segments/whole cilia length. Scale bar: 2 µm. Three biological replicates, n = 100 cilia per sample and repetition.
- H, I
A functional TZ is required for KIF7 cilia tip localisation in RPE1 cells. KIF7 signal intensities were measured in ciliated RPE1 cells treated with control or MKS3 siRNA and 48 h SS. Representative images (H) and quantification of KIF7 signal intensity at the base and tip of cilia (H) are shown. Scale bar: 2 µm. Three biological replicates, at least 60 cilia per sample and repetition.
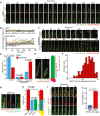
- A
Time‐lapse images of RPE1 WT and SEPT2‐KO cells stably expressing ARL13B‐GFP and γ‐tubulin‐mRuby2. Cells were starved for 32 h before the beginning of inspection and imaged every 15 min for 9.5 h. Scale bar: 5 µm. For videos, see Movie EV3 and EV4.
- B
Quantification of (A) showing changes in cilia length during time‐lapse imaging. Three biological replicates, 10 cilia per sample and repetition.
- C
Time‐lapse images show ectocytosis events observed in RPE1 SEPT2‐KO cells. Experiments were done as in (A) with exception that cells were imaged every 15 min. Scale bar: 2.5 µm. For videos, see Movie EV9 and EV10.
- D
Percentage of cilia that remained intact or underwent ectocytosis during live‐cell imaging from (A) and (C). Three biological replicates, n > 100 cilia per sample and repetition.
- E, F
Determination of the cilia breakage point during live‐cell imaging of RPE1 SEPT2‐KO‐ciliated cells. The ectocytosis point was calculated by dividing the cilia length at the time of breakage (b, t0) by the length of the cilium one time‐point prior to t0 (a, t‐1), as depicted in (E). The graph in (F) shows that breaking points (b/a) higher than 0.5 (i.e. breakage towards the cilia tip) are more frequent. Three biological replicates, n = 50 cilia per sample and repetition.
- G, H
RPE1 SEPT2‐KO cells expressing ARL13B‐mRuby2 and Neongreen‐EFHC1 after 48 h SS and immunostained with Glu‐tub antibody. Representative images (G) and quantifications of proximal segment (Glu tub), EFHC1 and whole cilia (ARL13B) length (H) are shown. Three biological replicates, n = 100 cilia per sample and repetition. Scale bar: 2 µm.
- I
Time‐lapse images of RPE1 SEPT2‐KO cells stably expressing ARL13B‐mRuby2 and Neongreen‐EFHC1. Cells were serum‐starved for 32 h before the beginning of inspection and imaged every 15 min for 9.5 h. The point of ectocytosis and the fragmented cilia are indicated by the white arrow and star, respectively. Scale bar: 5 µm. For videos, see Movie EV13.
- J
Quantification of (I) showing that (f)‐ectocytosis mainly occurs at EFHC1‐poor region of cilia during time‐lapse imaging. Three biological replicates, 50 cilia per sample and repetition.
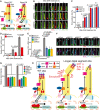
- A
Schematic representation showing the localisation of SHH components at the cilium in the OFF and ON state (Wheway et al, 2018). See text for details.
- B, C
Smo translocation to the cilium changes in the presence or absence of septins. NIH3T3 cells with control, SEPT2 or SEPT7 siRNAs and 48 h serum‐starvation (SS) were treated with SHH‐ligands for 0, 1, 2 and 4 h. Smo translocation into the cilium was followed over time using the indicated antibodies. Representative images (B) and quantifications (C) are shown. Scale bar: 2 µm. Three biological replicates, n > 100 cilia per sample and repetition.
- D
Relative Gli1 mRNA level changes in control and SEPT2 siRNA‐treated NIH3T3 cells. Changes in mRNA level were determined by RT‐PCR after 0, 4 and 6 h of SHH‐ligand addition to ciliated NIH3T3 cells. Three biological replicates.
- E
Relative Gli1 mRNA level changes in indicated siRNA‐treated NIH3T3 cells. Changes in mRNA level were determined by RT‐PCR after 6 h of SHH‐ligand or water addition to ciliated NIH3T3 cells Three biological replicates.
- F, G
Effect of septins, KIF7 or MKS3 depletion on the localisation of Gli3 and Sufu at the cilia tip. NIH3T3 cells were treated with the indicated siRNAs and 48 h SS. Representative images (F) and quantifications of Gli3 and Sufu at the cilia tip (G) are shown. White arrows in (F) point to the specific signal of the indicated proteins at the cilia tip. Scale bar: 2 µm. Three biological replicates, n = 100 cilia per sample and repetition.
- H
Model depicting the role of longer distal segments on cilia stability and signalling. See text for details.
Similar articles
-
The kinesin-4 protein Kif7 regulates mammalian Hedgehog signalling by organizing the cilium tip compartment.Nat Cell Biol. 2014 Jul;16(7):663-72. doi: 10.1038/ncb2988. Epub 2014 Jun 22. Nat Cell Biol. 2014. PMID: 24952464 Free PMC article.
-
A ciliopathy complex at the transition zone protects the cilia as a privileged membrane domain.Nat Cell Biol. 2011 Dec 18;14(1):61-72. doi: 10.1038/ncb2410. Nat Cell Biol. 2011. PMID: 22179047
-
Hedgehog-induced ciliary trafficking of kinesin-4 motor KIF7 requires intraflagellar transport but not KIF7's microtubule binding.Mol Biol Cell. 2022 Jan 1;33(1):br1. doi: 10.1091/mbc.E21-04-0215. Epub 2021 Oct 27. Mol Biol Cell. 2022. PMID: 34705483 Free PMC article.
-
Microtubule Motors Drive Hedgehog Signaling in Primary Cilia.Trends Cell Biol. 2017 Feb;27(2):110-125. doi: 10.1016/j.tcb.2016.09.010. Epub 2016 Oct 17. Trends Cell Biol. 2017. PMID: 27765513 Free PMC article. Review.
-
Primary cilia biogenesis and associated retinal ciliopathies.Semin Cell Dev Biol. 2021 Feb;110:70-88. doi: 10.1016/j.semcdb.2020.07.013. Epub 2020 Jul 31. Semin Cell Dev Biol. 2021. PMID: 32747192 Free PMC article. Review.
Cited by
-
Identification of new ciliary signaling pathways in the brain and insights into neurological disorders.bioRxiv [Preprint]. 2023 Dec 21:2023.12.20.572700. doi: 10.1101/2023.12.20.572700. bioRxiv. 2023. PMID: 38187761 Free PMC article. Preprint.
-
Septins as membrane influencers: direct play or in association with other cytoskeleton partners.Front Cell Dev Biol. 2023 Feb 17;11:1112319. doi: 10.3389/fcell.2023.1112319. eCollection 2023. Front Cell Dev Biol. 2023. PMID: 36875762 Free PMC article. Review.
-
Role of lipids in the control of autophagy and primary cilium signaling in neurons.Neural Regen Res. 2024 Feb;19(2):264-271. doi: 10.4103/1673-5374.377414. Neural Regen Res. 2024. PMID: 37488876 Free PMC article. Review.
-
TAOK2 Drives Opposing Cilia Length Deficits in 16p11.2 Deletion and Duplication Carriers.bioRxiv [Preprint]. 2024 Oct 7:2024.10.07.617069. doi: 10.1101/2024.10.07.617069. bioRxiv. 2024. PMID: 39416068 Free PMC article. Preprint.
-
Cilia and Extracellular Vesicles in Brain Development and Disease.Biol Psychiatry. 2024 Jun 1;95(11):1020-1029. doi: 10.1016/j.biopsych.2023.11.004. Epub 2023 Nov 11. Biol Psychiatry. 2024. PMID: 37956781 Review.
References
Publication types
MeSH terms
Substances
LinkOut - more resources
Full Text Sources

