

The effect of age on CD4+ T-cell recovery in HIV-suppressed adult participants: a sub-study from AIDS Clinical Trial Group (ACTG) A5321 and the Bone Loss and Immune Reconstitution (BLIR) study
- PMID: 34980186
- PMCID: PMC8722153
- DOI: 10.1186/s12979-021-00260-x
The effect of age on CD4+ T-cell recovery in HIV-suppressed adult participants: a sub-study from AIDS Clinical Trial Group (ACTG) A5321 and the Bone Loss and Immune Reconstitution (BLIR) study
Abstract
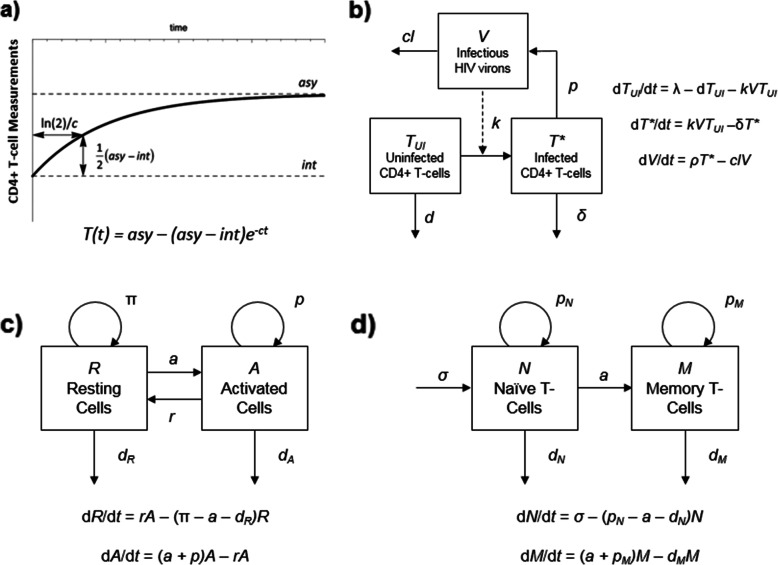
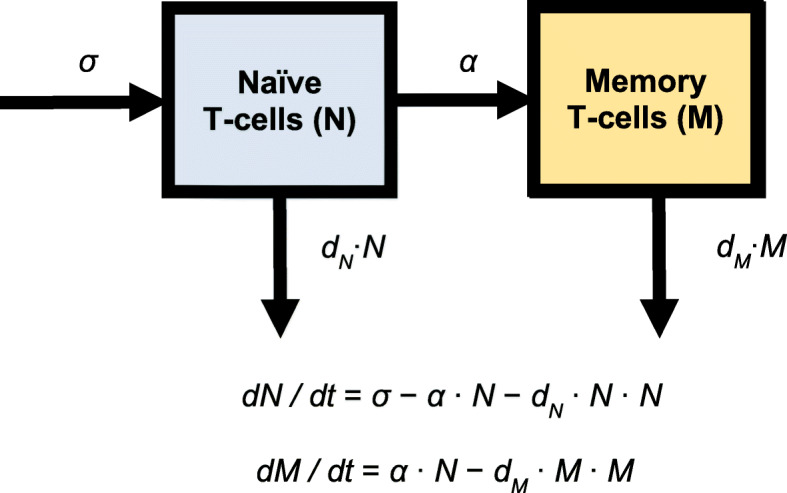
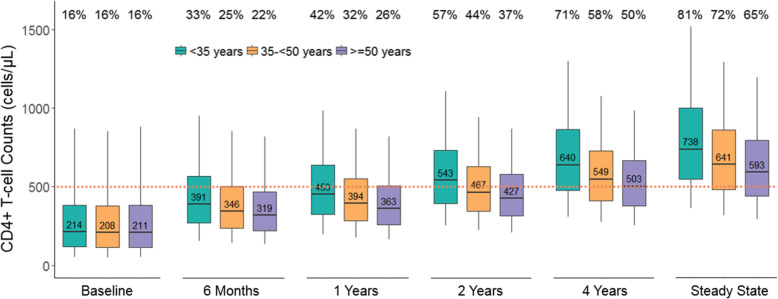
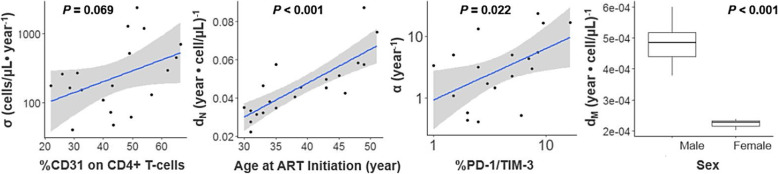
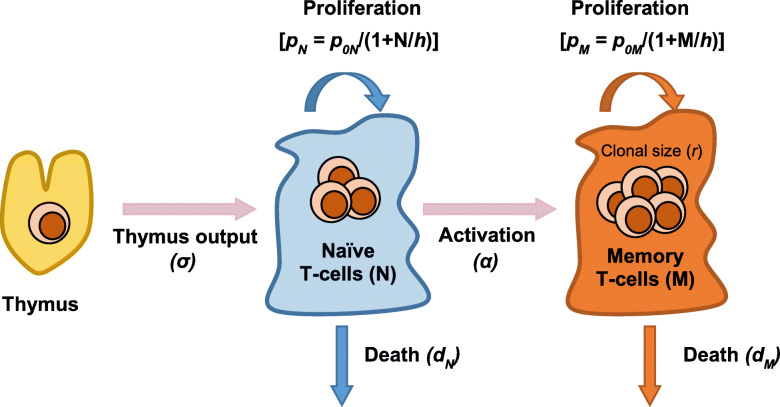
Older age could be a risk factor for suboptimal CD4+ T-cell recovery in HIV-infected patients despite successful viral suppression. However, evaluation of this effect could be confounded by age-related immune processes such as decreased thymus output, increased immune activation and exhaustion. Here, we established a semi-mechanistic population model simultaneously describing naïve and memory CD4+ T-cell trajectories in 122 participants. Covariate analysis accounting for immune activation showed that older age was significantly associated with faster apparent elimination rate of the naïve T-cells. In addition, female sex predicted slower apparent elimination rate of memory T-cells. Simulations showed that the median maximal CD4+ T-cell count on ART treatment was 593 cells/μL (IQR 442-794) in patients aged 50 years or above and 738 cells/μL (IQR 548-1002) in patients aged 18-35 years. The differences in the percentage of subjects achieving sufficient immune reconstitution (CD4+ T-cell count> 500 cells/μL) between the two age groups were 15, 21 and 26% at year 1, 4 years and steady state, respectively, suggesting that advanced age may have a greater impact on long-term CD4+ T-cell recovery.
Keywords: Aging; HIV; Immune recovery; Nonlinear mixed effects modeling; Pharmacodynamic modeling.
© 2021. The Author(s).
Conflict of interest statement
JC is a current employee of Merck. RTG has served on scientific advisory boards for Merck and 460 Gilead. The other authors do not declare any competing interests.
Figures
Similar articles
-
Suboptimal immune recovery during antiretroviral therapy with sustained HIV suppression in sub-Saharan Africa.AIDS. 2018 May 15;32(8):1043-1051. doi: 10.1097/QAD.0000000000001801. AIDS. 2018. PMID: 29547445
-
Thymic function in HIV-infection.Dan Med J. 2013 Apr;60(4):B4622. Dan Med J. 2013. PMID: 23651726 Review.
-
Rapid CD4 decline prior to antiretroviral therapy predicts subsequent failure to reconstitute despite HIV viral suppression.J Infect Public Health. 2018 Mar-Apr;11(2):265-269. doi: 10.1016/j.jiph.2017.08.001. Epub 2017 Aug 18. J Infect Public Health. 2018. PMID: 28826735
-
The Factors Related to CD4+ T-Cell Recovery and Viral Suppression in Patients Who Have Low CD4+ T Cell Counts at the Initiation of HAART: A Retrospective Study of the National HIV Treatment Sub-Database of Zhejiang Province, China, 2014.PLoS One. 2016 Feb 22;11(2):e0148915. doi: 10.1371/journal.pone.0148915. eCollection 2016. PLoS One. 2016. PMID: 26900702 Free PMC article.
-
Baseline Naive CD4+ T-cell Level Predicting Immune Reconstitution in Treated HIV-infected Late Presenters.Chin Med J (Engl). 2016 Nov 20;129(22):2683-2690. doi: 10.4103/0366-6999.193460. Chin Med J (Engl). 2016. PMID: 27824000 Free PMC article.
Cited by
-
High baseline body mass index predicts recovery of CD4+ T lymphocytes for HIV/AIDS patients receiving long-term antiviral therapy.PLoS One. 2022 Dec 30;17(12):e0279731. doi: 10.1371/journal.pone.0279731. eCollection 2022. PLoS One. 2022. PMID: 36584083 Free PMC article.
-
A retrospective clinical study of dolutegravir- versus efavirenz-based regimen in treatment-naïve patients with advanced HIV infection in Nanjing, China.Front Immunol. 2023 Jan 9;13:1033098. doi: 10.3389/fimmu.2022.1033098. eCollection 2022. Front Immunol. 2023. PMID: 36700216 Free PMC article.
-
Evaluation of Clinical Biomarkers Related to CD4 Recovery in HIV-Infected Patients-5-Year Observation.Viruses. 2022 Oct 18;14(10):2287. doi: 10.3390/v14102287. Viruses. 2022. PMID: 36298842 Free PMC article.
-
Recent advances in poor HIV immune reconstitution: what will the future look like?Front Microbiol. 2023 Aug 7;14:1236460. doi: 10.3389/fmicb.2023.1236460. eCollection 2023. Front Microbiol. 2023. PMID: 37608956 Free PMC article. Review.
-
HIV immunological non-responders are characterized by extensive immunosenescence and impaired lymphocyte cytokine production capacity.Front Immunol. 2024 May 8;15:1350065. doi: 10.3389/fimmu.2024.1350065. eCollection 2024. Front Immunol. 2024. PMID: 38779686 Free PMC article.
References
Grants and funding
- U54 AG062334/AG/NIA NIH HHS/United States
- K01 HL131333/HL/NHLBI NIH HHS/United States
- K23AI11440/National Institute of Allergy and Infectious Diseases
- K23 AI114407/AI/NIAID NIH HHS/United States
- R01 AR059364/AR/NIAMS NIH HHS/United States
- R01 AR070091/AR/NIAMS NIH HHS/United States
- K01HL131333/HL/NHLBI NIH HHS/United States
- 5I01BX000105/Biomedical Laboratory Research and Development, VA Office of Research and Development
- I01 BX000105/BX/BLRD VA/United States
- R01 AG040013/AG/NIA NIH HHS/United States
- P30 AI050410/AI/NIAID NIH HHS/United States
- R01AR059364, R01AR070091 and R01AR06815/AR/NIAMS NIH HHS/United States
- R01AG040013, U54AG062334/AG/NIA NIH HHS/United States
LinkOut - more resources
Full Text Sources
Research Materials
