Observational Study
. 2021 Dec 16:12:778329.
doi: 10.3389/fimmu.2021.778329. eCollection 2021.

Colorectal Cancer-Associated Immune Exhaustion Involves T and B Lymphocytes and Conventional NK Cells and Correlates With a Shorter Overall Survival

Affiliations
Observational Study

Colorectal Cancer-Associated Immune Exhaustion Involves T and B Lymphocytes and Conventional NK Cells and Correlates With a Shorter Overall Survival

Carlo Sorrentino et al. Front Immunol. .

Abstract

Colorectal cancer (CRC) is one of the most common cancer worldwide, with a growing impact on public health and clinical management. Immunotherapy has shown promise in the treatment of advanced cancers, but needs to be improved for CRC, since only a limited fraction of patients is eligible for treatment, and most of them develop resistance due to progressive immune exhaustion. Here, we identify the transcriptional, molecular, and cellular traits of the immune exhaustion associated with CRC and determine their relationships with the patient's clinic-pathological profile. Bioinformatic analyses of RNA-sequencing data of 594 CRCs from TCGA PanCancer collection, revealed that, in the wide range of immune exhaustion genes, those coding for PD-L1, LAG3 and T-bet were associated (Cramér's V=0.3) with MSI/dMMR tumors and with a shorter overall survival (log-rank test: p=0.0004, p=0.0014 and p=0.0043, respectively), whereas high levels of expression of EOMES, TRAF1, PD-L1, FCRL4, BTLA and SIGLEC6 were associated with a shorter overall survival (log-rank test: p=0.0003, p=0.0188, p=0.0004, p=0.0303, p=0.0052 and p=0.0033, respectively), independently from the molecular subtype of CRC. Expression levels of PD-L1, PD-1, LAG3, EOMES, T-bet, and TIGIT were significantly correlated with each other and associated with genes coding for CD4+ and CD8+CD3+ T cell markers and NKp46+CD94+EOMES+T-bet+ cell markers, (OR >1.5, p<0.05), which identify a subset of group 1 innate lymphoid cells, namely conventional (c)NK cells. Expression of TRAF1 and BTLA co-occurred with both T cell markers, CD3γ, CD3δ, CD3ε, CD4, and B cell markers, CD19, CD20 and CD79a (OR >2, p<0.05). Expression of TGFβ1 was associated only with CD4+ and CD8+CD3ε+ T cell markers (odds ratio >2, p<0.05). Expression of PD-L2 and IDO1 was associated (OR >1.5, p<0.05) only with cNK cell markers, whereas expression of FCRL4, SIGLEC2 and SIGLEC6 was associated (OR >2.5; p<0.05) with CD19+CD20+CD79a+ B cell markers. Morphometric examination of immunostained CRC tissue sections, obtained from a validation cohort of 53 CRC patients, substantiated the biostatistical findings, showing that the highest percentage of immune exhaustion gene expressing cells were found in tumors from short-term survivors and that functional exhaustion is not confined to T lymphocytes, but also involves B cells, and cNK cells. This concept was strengthened by CYBERSORTx analysis, which revealed the expression of additional immune exhaustion genes, in particular FOXP1, SIRT1, BATF, NR4A1 and TOX, by subpopulations of T, B and NK cells. This study provides novel insight into the immune exhaustion landscape of CRC and emphasizes the need for a customized multi-targeted therapeutic approach to overcome resistance to current immunotherapy.

Keywords: B cell exhaustion; T cell exhaustion; colorectal cancer; conventional NK cells; immune checkpoints; immune exhaustion genes; innate lymphoid cells.


Conflict of interest statement

The authors declare that the research was conducted in the absence of any commercial or financial relationships that could be construed as a potential conflict of interest.

Figures
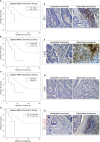
Figure 1
Figure 1
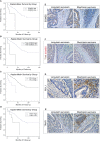
Survival curves and immunopathological features of PD-1, LAG3 and T-bet expression in CRC patients from the PanCancer collection and from the validation cohort. (A) Kaplan-Meier curves representing, for each time point, the fraction of surviving CRC patients classified, based on mRNA expression levels in tumor samples, as PD-1 mRNAhigh (n. 15) and PD-1 mRNAlow (n. 573). (B) Kaplan-Meier curves representing, for each time point, the fraction of surviving CRC patients classified, based on mRNA expression levels in tumor samples, as LAG3 mRNAhigh (n. 19) and LAG3 mRNAlow (n. 569). (C) Kaplan-Meier curves representing, for each time point, the fraction of surviving CRC patients classified, based on mRNA expression levels in tumor samples, as T-bet mRNAhigh (n. 18) and T-bet mRNAlow (n. 570). (D) Kaplan-Meier curves representing, for each time point, the fraction of surviving CRC patients classified, based on mRNA expression levels in tumor samples, as PD-1 mRNAhigh + LAG3 mRNAhigh (n. 10) and PD-1 mRNAlow + LAG3 mRNAlow (n. 578). (E) Expression of PD-1 in CRC tissue sections obtained from patients with long- and short-term survival. Magnification: X400. Scale bars: 20 μm. (F) Expression of LAG3 in CRC tissue sections obtained from patients with long- and short-term survival. Magnification: X400. Scale bars: 20 μm. (G) Expression of T-bet in CRC tissue sections obtained from patients with long- and short-term survival. Magnification: X400. Scale bars: 20 μm. (H) Co-expression of PD-1 (brown) and LAG3 (red) in CRC tissue sections obtained from patients with long- and short-term survival. Magnification: X200. Scale bars: 30 μm.
Figure 2
Figure 2
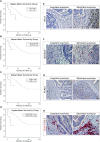
Survival curves and immunopathological features of EOMES/T-bet, PD-L1 and TRAF1 expression in CRC patients from the PanCancer collection and from the validation cohort. (A) Kaplan-Meier curves representing, for each time point, the fraction of surviving CRC patients classified, based on mRNA expression levels in tumor samples, as EOMES mRNAhigh (n. 14) and EOMES mRNAlow (n. 574). (B) Kaplan-Meier curves representing, for each time point, the fraction of surviving CRC patients classified, based on mRNA expression levels in tumor samples, as T-bet mRNAhigh + EOMES mRNAhigh (n. 6) and T-bet mRNAlow + EOMES mRNAlow (n. 582). (C) Kaplan-Meier curves representing, for each time point, the fraction of surviving CRC patients classified, based on mRNA expression levels in tumor samples, as PD-L1 mRNAhigh (n. 18) and PD-L1 mRNAlow (n. 570). (D) Kaplan-Meier curves representing, for each time point, the fraction of surviving CRC patients classified, based on mRNA expression levels in tumor samples, as TRAF1 mRNAhigh (n. 11) and TRAF1 mRNAlow (n. 577). (E) Expression of EOMES in CRC tissue sections obtained from patients with long- and short-term survival. Magnification: X200. Scale bars: 30 μm. (F) Co-expression of T-bet (brown) and EOMES (red) in CRC tissue sections obtained from patients with long- and short-term survival. Magnification: X200. Scale bars: 30 μm. (G) Expression of PD-L1 in CRC tissue sections obtained from patients with long- and short-term survival. Magnification: X400. Scale bars: 20 μm. (H) Expression of TRAF1 in CRC tissue sections obtained from patients with long- and short-term survival. Magnification: X200. Scale bars: 30 μm.
Figure 3
Figure 3
Survival curves and immunopathological features of BTLA, SIGLEC6, and CD20/FCRL4 expression in CRC patients from the PanCancer collection and from the validation cohort. (A) Kaplan-Meier curves representing, for each time point, the fraction of surviving CRC patients classified, based on mRNA expression levels in tumor samples, as BTLA mRNAhigh (n. 15) and BTLA mRNAlow (n. 573). (B) Kaplan-Meier curves representing, for each time point, the fraction of surviving CRC patients classified, based on mRNA expression levels in tumor samples, as FCRL4 mRNAhigh (n. 11) and FCRL4 mRNAlow (n. 351). (C) Kaplan-Meier curves representing, for each time point, the fraction of surviving CRC patients classified, based on mRNA expression levels in tumor samples, as SIGLEC6 mRNAhigh (n. 18) and SIGLEC6 mRNAlow (n. 570). (D) Kaplan-Meier curves representing, for each time point, the fraction of surviving CRC patients classified, based on mRNA expression levels in tumor samples, as CD20 mRNAhigh + FCRL4 mRNAhigh (n. 8) andCD20 mRNAlow + FCRL4 mRNAlow (n. 354). (E) Expression of BTLA in CRC tissue sections obtained from patients with long- and short-term survival. Magnification: X400. Scale bars: 20 μm. (F) Expression of SIGLEC6 in CRC tissue sections obtained from patients with long- and short-term survival. Magnification: X400. Scale bars: 20 μm. (G) Expression of FCRL4 in CRC tissue sections obtained from patients with long- and short-term survival. Magnification: X200. Scale bars: 30 μm. (H) Co-expression of CD20 (red) and FCRL4 (brown) in CRC tissue sections obtained from patients with long- and short-term survival. Magnification: X400. Scale bars: 20 μm.
Figure 4
Figure 4
The Heatmap shows the associations between the expression of immune exhaustion genes and the expression of immune cell markers. Red squares indicate co-occurrence (OR >1.5, p<0.05), while black squares indicate lack of association.
Figure 5
Figure 5
Immunohistochemical features of CD3+ T lymphocyte co-localization with different immune exhaustion molecules in CRC. (A) Immunohistochemical staining of CRC tissue sections, from short-term survivors, showing CD3+ T cells in the stroma, among neoplastic glands. Magnification: X400. Scale bars: 20 μm. (B) Immunohistochemical staining of consecutive serial CRC tissue sections, from short-term survivors, showing TRAF1+ cells localized in the areas infiltrated by CD3+ T cells, among neoplastic glands. Magnification: X400. Scale bars: 20 μm. (C, D). Double immunohistochemical staining of CRC tissue sections from short-term survivors shows a frequent co-localization of EOMES (brown) with CD3 (red). Images C and D represent two different areas of the same sample. Magnification: C, X200; D, X400. Scale bars: C, 30 μm; D, 20 μm. (E) Double immunohistochemical staining of CRC tissue sections from short-term survivors shows a frequent co-localization of T-bet (brown) with CD3 (red). Magnification: X400. Scale bars: 20 μm. (F) Double immunohistochemical staining of CRC tissue sections from short-term survivors shows that the vast majority of CD3+ cells (red) express PD-L1 (brown). Magnification: X400. Scale bars: 20 μm. (G) Double immunohistochemical staining of CRC tissue sections from short-term survivors shows that the vast majority of CD3+ cells (red) express PD-1 (brown). Magnification: X400. Scale bars: 20 μm. (H) Double immunohistochemical staining of CRC tissue sections from short-term survivors shows that most of CD3+ cells (red) express LAG3 (brown). Magnification: X400. Scale bars: 20 μm. (I) Double immunohistochemical staining of CRC tissue sections from short-term survivors shows a frequent co-localization of TGFβ1 (red) with CD3+ cells (brown). Magnification of CD3+TGFβ1+ inflammatory infiltrate in the inset. Magnification: X200; Inset, X400. Scale bars: 30 μm; Inset, 20 μm.
Figure 6
Figure 6
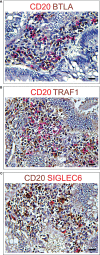
Immunohistochemical features of CD20+ B lymphocyte co-localization with different immune exhaustion molecules in CRC. (A) Double immunohistochemical staining of CRC tissue sections from short-term survivors shows a frequent co-localization of BTLA (brown) with CD20 (red). Magnification: X400. Scale bars: 20 μm. (B) Double immunohistochemical staining of CRC tissue sections from short-term survivors shows a frequent co-localization of TRAF1 (brown) with CD20 (red). Magnification: X400. Scale bars: 20 μm. (C) Double immunohistochemical staining of CRC tissue sections from short-term survivors shows a frequent co-localization of SIGLEC6 (red) with CD20 (brown). Magnification: X400. Scale bars: 20 μm.
Figure 7
Figure 7
Immunohistochemical features NKp46 co-localization with different immune exhaustion molecules in CRC. (A) Immunohistochemical staining of CRC tissue sections, from short-term survivors, showing NKp46+ cells in the stroma, among neoplastic glands. Magnification: X400. Scale bars: 20 μm. (B) Double immunohistochemistry of consecutive serial CRC tissue sections, showing that EOMES (red) frequently co-localized with T-bet (brown). EOMES+T-bet+ cells (brick red) localized in the stroma, among neoplastic glands, in the same area showing NKp46+ cell infiltrate (A). Magnification: X400. Scale bars: 20 μm. (C) Immunohistochemical staining of consecutive serial CRC tissue sections, showing TIGIT+ cells localized in the stroma, among neoplastic glands. Magnification: X400. Scale bars: 20 μm. (D) Double immunohistochemistry of consecutive serial CRC tissue sections, showing that TIGIT (red) frequently co-localizes with NKp46 cells (brown), as revealed by the brick red stained NKp46+TIGIT+ cells. Magnification: X400. Scale bars: 20 μm. (E) Immunohistochemical staining of consecutive serial CRC tissue sections showing expression of IDO1 in the stroma, among neoplastic glands. Magnification: X400. Scale bars: 20 μm. (F) Double immunohistochemistry of consecutive serial CRC tissue sections, showing that IDO1 (brown) frequently co-localizes with NKp46 cells (red), as revealed by the brick red stained NKp46+IDO1+ cells. Magnification: X400. Scale bars: 20 μm. (G) Immunohistochemical staining of consecutive serial CRC tissue sections showing PD-L2 expression in stromal infiltrating cells and colon cancer cells. Magnification: X400. Scale bars: 20 μm. (H) Double immunohistochemistry of consecutive serial CRC tissue sections, showing that PD-L2 (red) frequently co-localizes with NKp46 cells (brown), as revealed by the brick red stained NKp46+PD-L2+ cells. Magnification: X400. Scale bars: 20 μm.

Similar articles

Cited by

References

    1. World Health Organization . Cancer Today (2020). Available at: https://gco.iarc.fr/today/home (Accessed September 02, 2021).
    1. Leporrier J, Maurel J, Chiche L, Bara S, Segol P, Launoy G. A Population-Based Study of the Incidence, Management and Prognosis of Hepatic Metastases From Colorectal Cancer. Br J Surg (2006) 93:465–74. doi: 10.1002/bjs.5278 - DOI - PubMed
    1. Smetana K, Jr, Lacina L, Szabo P, Dvořánková B, Brož P, Šedo A. Ageing as an Important Risk Factor for Cancer. Anticancer Res (2016) 36:5009–17. doi: 10.21873/anticanres.11069 - DOI - PubMed
    1. Wang W, Kandimalla R, Huang H, Zhu L, Li Y, Gao F, et al. . Molecular Subtyping of Colorectal Cancer: Recent Progress, New Challenges and Emerging Opportunities. Semin Cancer Biol (2019) 55:37–52. doi: 10.1016/j.semcancer.2018.05.002 - DOI - PMC - PubMed
    1. Lin A, Zhang J, Luo P. Crosstalk Between the MSI Status and Tumor Microenvironment in Colorectal Cancer. Front Immunol (2020) 11:2039. doi: 10.3389/fimmu.2020.02039 - DOI - PMC - PubMed

Publication types

MeSH terms

Substances