

Disruption of Hars2 in Cochlear Hair Cells Causes Progressive Mitochondrial Dysfunction and Hearing Loss in Mice
- PMID: 34975414
- PMCID: PMC8715924
- DOI: 10.3389/fncel.2021.804345
Disruption of Hars2 in Cochlear Hair Cells Causes Progressive Mitochondrial Dysfunction and Hearing Loss in Mice
Abstract
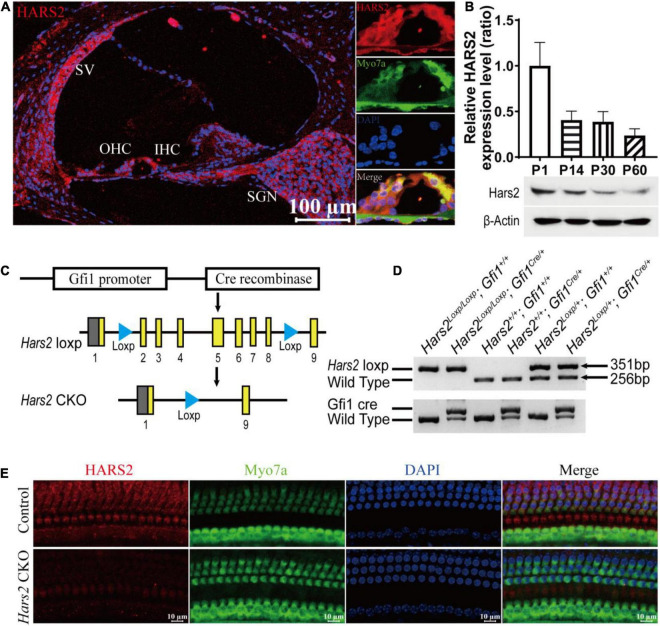
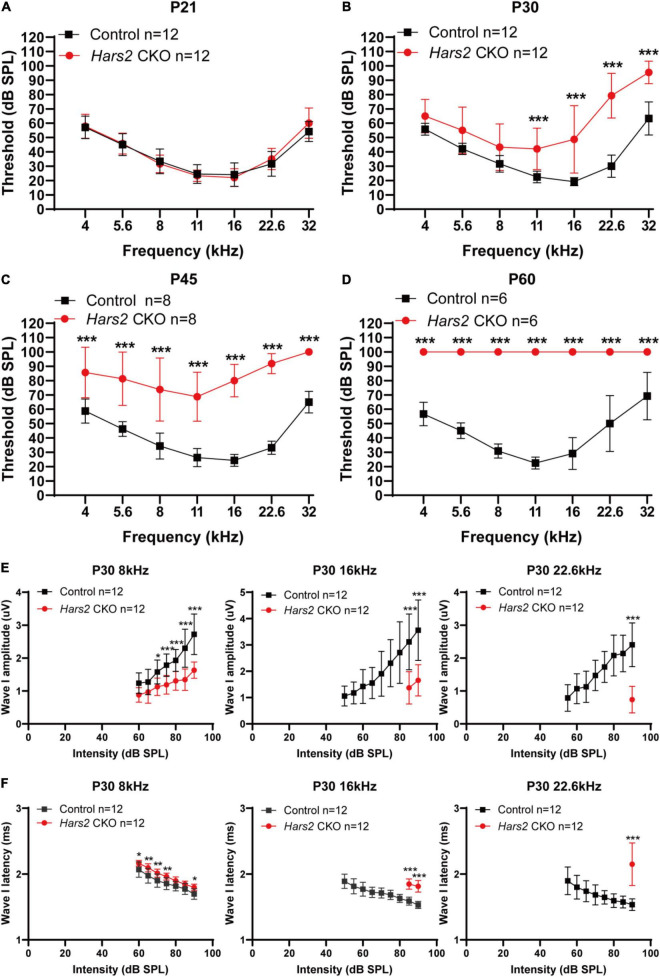
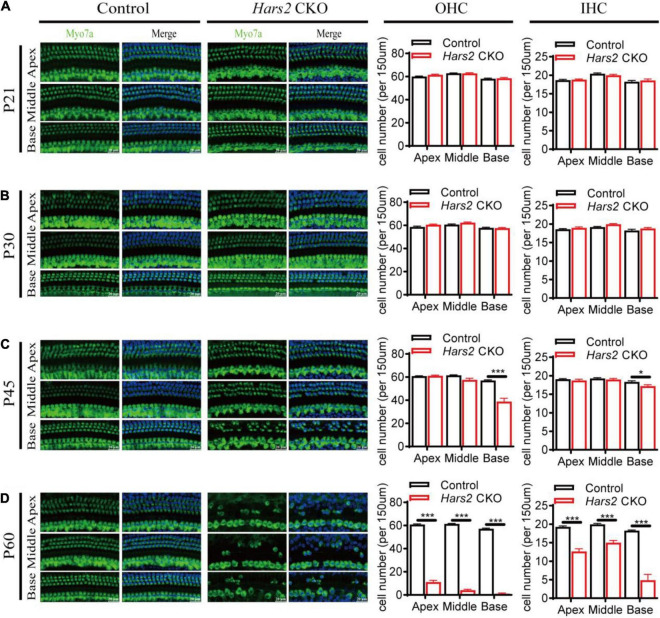
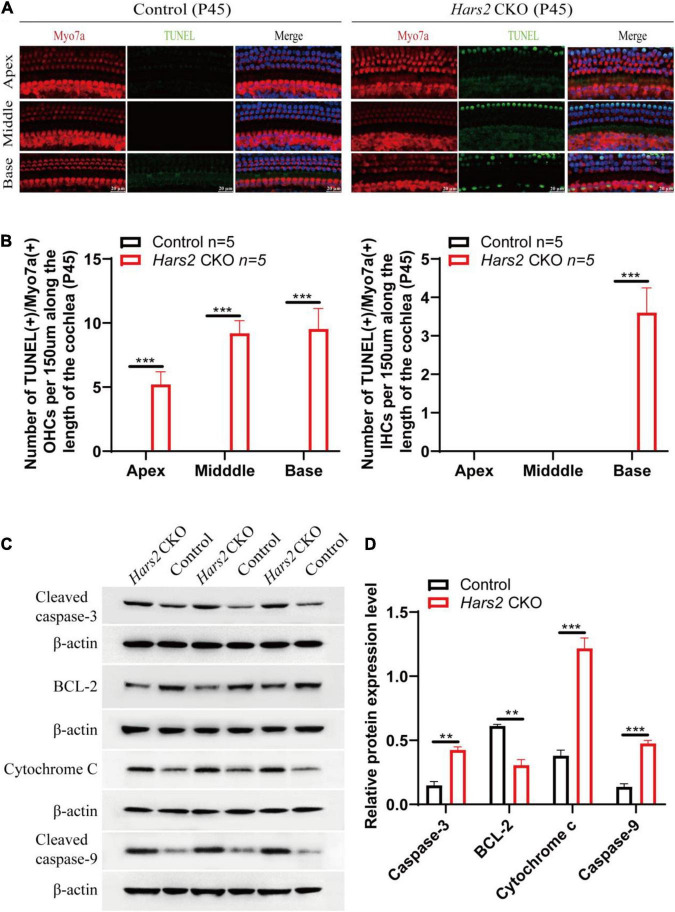
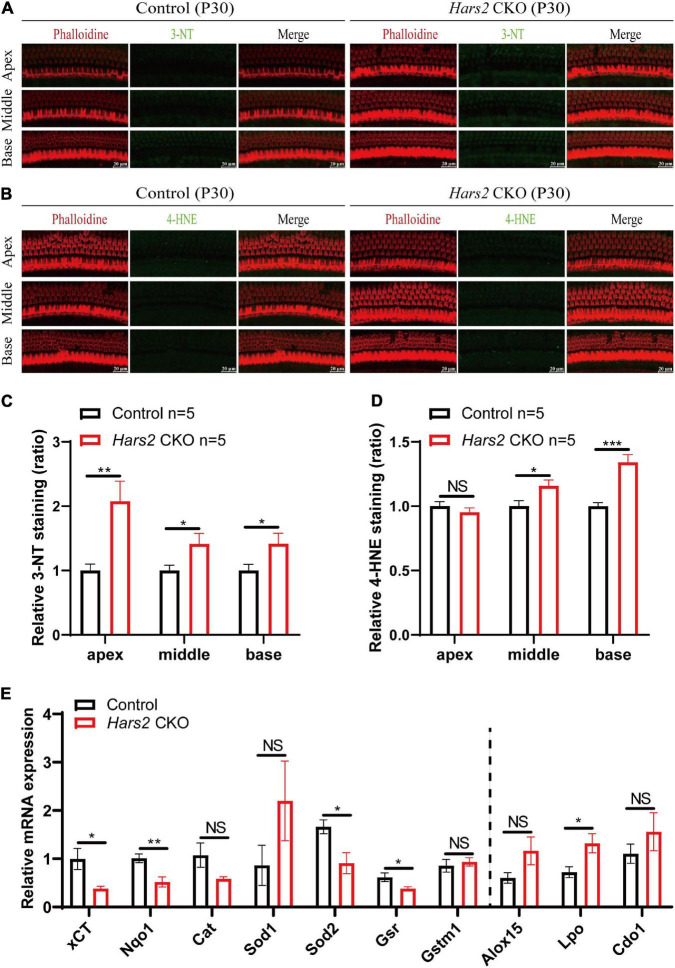
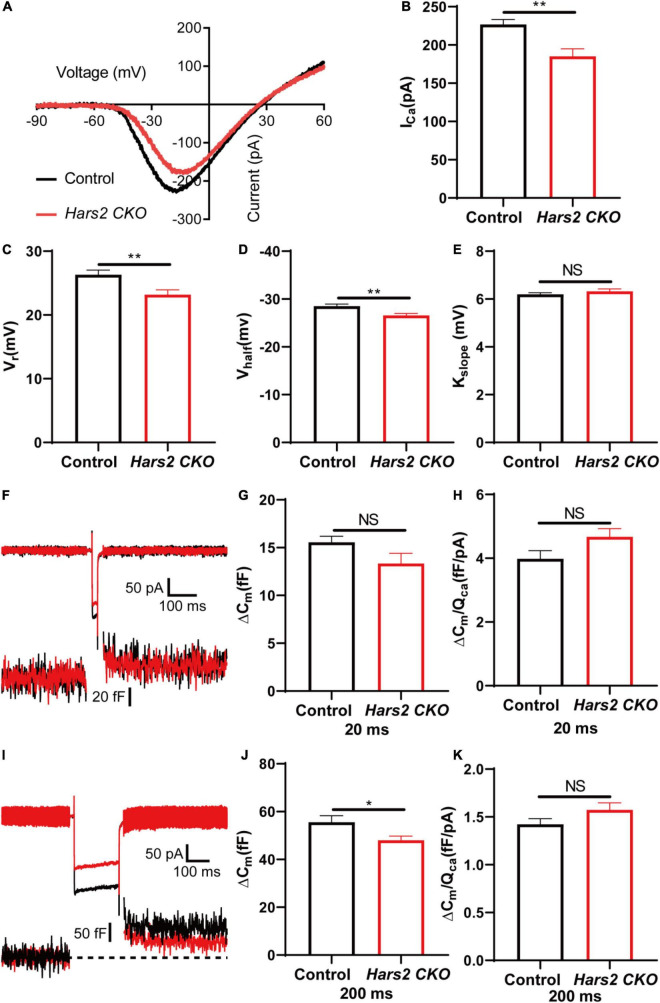
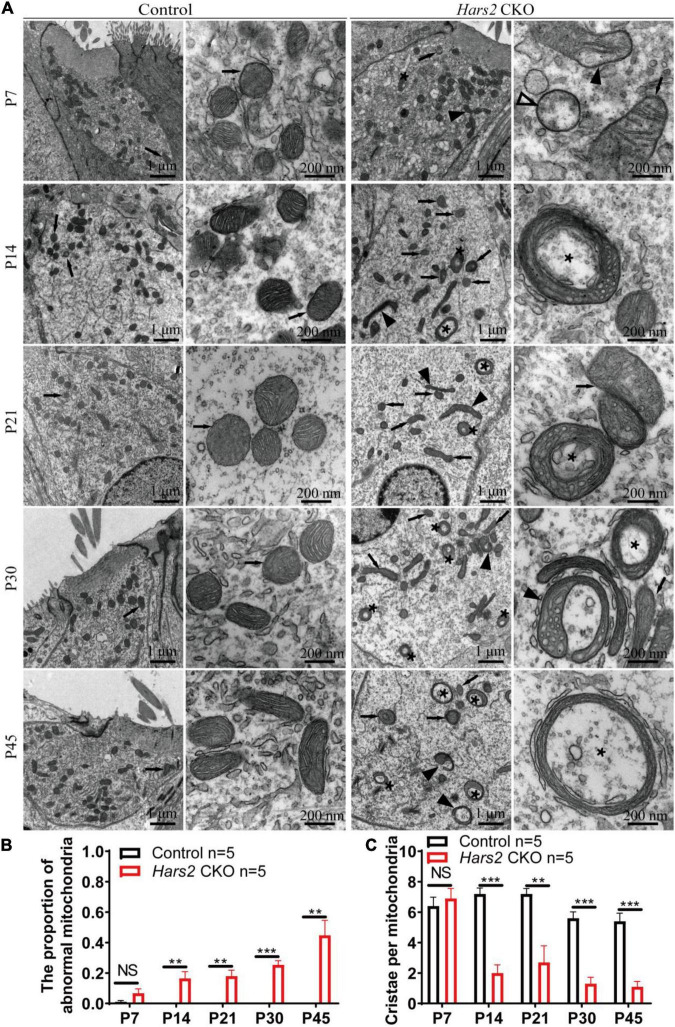
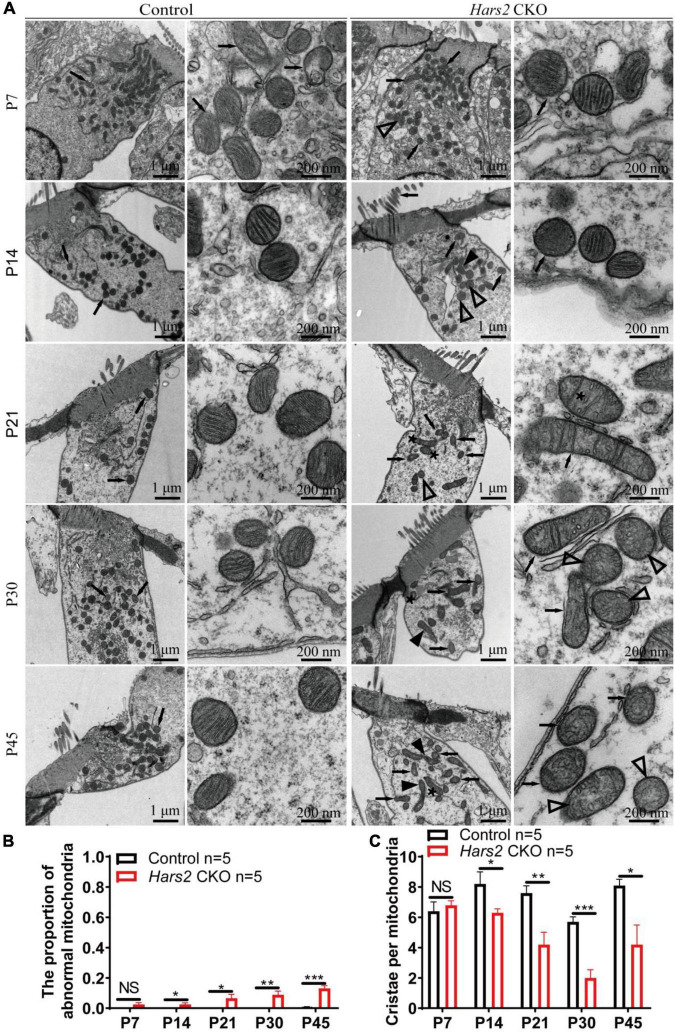
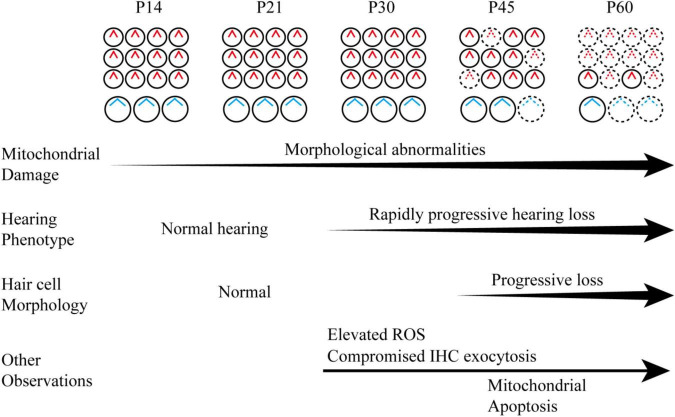
Mutations in a number of genes encoding mitochondrial aminoacyl-tRNA synthetases lead to non-syndromic and/or syndromic sensorineural hearing loss in humans, while their cellular and physiological pathology in cochlea has rarely been investigated in vivo. In this study, we showed that histidyl-tRNA synthetase HARS2, whose deficiency is associated with Perrault syndrome 2 (PRLTS2), is robustly expressed in postnatal mouse cochlea including the outer and inner hair cells. Targeted knockout of Hars2 in mouse hair cells resulted in delayed onset (P30), rapidly progressive hearing loss similar to the PRLTS2 hearing phenotype. Significant hair cell loss was observed starting from P45 following elevated reactive oxygen species (ROS) level and activated mitochondrial apoptotic pathway. Despite of normal ribbon synapse formation, whole-cell patch clamp of the inner hair cells revealed reduced calcium influx and compromised sustained synaptic exocytosis prior to the hair cell loss at P30, consistent with the decreased supra-threshold wave I amplitudes of the auditory brainstem response. Starting from P14, increasing proportion of morphologically abnormal mitochondria was observed by transmission electron microscope, exhibiting swelling, deformation, loss of cristae and emergence of large intrinsic vacuoles that are associated with mitochondrial dysfunction. Though the mitochondrial abnormalities are more prominent in inner hair cells, it is the outer hair cells suffering more severe cell loss. Taken together, our results suggest that conditional knockout of Hars2 in mouse cochlear hair cells leads to accumulating mitochondrial dysfunction and ROS stress, triggers progressive hearing loss highlighted by hair cell synaptopathy and apoptosis, and is differentially perceived by inner and outer hair cells.
Keywords: HARS2; apoptosis; hair cells; hearing loss; mitochondrial.
Copyright © 2021 Xu, Wang, Peng, Liu, Liu, Yuan, Lin, Xu, Pang, Wu and Yang.
Conflict of interest statement
The authors declare that the research was conducted in the absence of any commercial or financial relationships that could be construed as a potential conflict of interest.
Figures
Similar articles
-
Mutations in mitochondrial histidyl tRNA synthetase HARS2 cause ovarian dysgenesis and sensorineural hearing loss of Perrault syndrome.Proc Natl Acad Sci U S A. 2011 Apr 19;108(16):6543-8. doi: 10.1073/pnas.1103471108. Epub 2011 Apr 4. Proc Natl Acad Sci U S A. 2011. PMID: 21464306 Free PMC article.
-
Loss of inner hair cell ribbon synapses and auditory nerve fiber regression in Cldn14 knockout mice.Hear Res. 2020 Jun;391:107950. doi: 10.1016/j.heares.2020.107950. Epub 2020 Mar 16. Hear Res. 2020. PMID: 32251970
-
Therapeutic potential of the mitochondria-targeted antioxidant MitoQ in mitochondrial-ROS induced sensorineural hearing loss caused by Idh2 deficiency.Redox Biol. 2019 Jan;20:544-555. doi: 10.1016/j.redox.2018.11.013. Epub 2018 Nov 20. Redox Biol. 2019. PMID: 30508699 Free PMC article.
-
Audibility, speech perception and processing of temporal cues in ribbon synaptic disorders due to OTOF mutations.Hear Res. 2015 Dec;330(Pt B):200-12. doi: 10.1016/j.heares.2015.07.007. Epub 2015 Jul 15. Hear Res. 2015. PMID: 26188103 Review.
-
Auditory neuropathy--neural and synaptic mechanisms.Nat Rev Neurol. 2016 Mar;12(3):135-49. doi: 10.1038/nrneurol.2016.10. Epub 2016 Feb 19. Nat Rev Neurol. 2016. PMID: 26891769 Review.
Cited by
-
Recessive aminoacyl-tRNA synthetase disorders: lessons learned from in vivo disease models.Front Neurosci. 2023 May 9;17:1182874. doi: 10.3389/fnins.2023.1182874. eCollection 2023. Front Neurosci. 2023. PMID: 37274208 Free PMC article. Review.
-
The Bacterial ClpXP-ClpB Family Is Enriched with RNA-Binding Protein Complexes.Cells. 2022 Aug 2;11(15):2370. doi: 10.3390/cells11152370. Cells. 2022. PMID: 35954215 Free PMC article. Review.
-
Genetic insights into the complexity of premature ovarian insufficiency.Reprod Biol Endocrinol. 2024 Aug 2;22(1):94. doi: 10.1186/s12958-024-01254-2. Reprod Biol Endocrinol. 2024. PMID: 39095891 Free PMC article. Review.
-
Knockout Mouse Studies Show That Mitochondrial CLPP Peptidase and CLPX Unfoldase Act in Matrix Condensates near IMM, as Fast Stress Response in Protein Assemblies for Transcript Processing, Translation, and Heme Production.Genes (Basel). 2024 May 27;15(6):694. doi: 10.3390/genes15060694. Genes (Basel). 2024. PMID: 38927630 Free PMC article. Review.
-
Illuminating mitochondrial translation through mouse models.Hum Mol Genet. 2024 May 22;33(R1):R61-R79. doi: 10.1093/hmg/ddae020. Hum Mol Genet. 2024. PMID: 38779771 Free PMC article. Review.
References
LinkOut - more resources
Full Text Sources
Other Literature Sources
Molecular Biology Databases
Research Materials