. 2021 Dec 31;16(12):e0257972.
doi: 10.1371/journal.pone.0257972. eCollection 2021.

Structural basis of HLX10 PD-1 receptor recognition, a promising anti-PD-1 antibody clinical candidate for cancer immunotherapy

Affiliations

Structural basis of HLX10 PD-1 receptor recognition, a promising anti-PD-1 antibody clinical candidate for cancer immunotherapy

Hassan Issafras et al. PLoS One. .

Abstract

Cancer immunotherapies, such as checkpoint blockade of programmed cell death protein-1 (PD-1), represents a breakthrough in cancer treatment, resulting in unprecedented results in terms of overall and progression-free survival. Discovery and development of novel anti PD-1 inhibitors remains a field of intense investigation, where novel monoclonal antibodies (mAbs) and novel antibody formats (e.g., novel isotype, bispecific mAb and low-molecular-weight compounds) are major source of future therapeutic candidates. HLX10, a fully humanized IgG4 monoclonal antibody against PD-1 receptor, increased functional activities of human T-cells and showed in vitro, and anti-tumor activity in several tumor models. The combined inhibition of PD-1/PDL-1 and angiogenesis pathways using anti-VEGF antibody may enhance a sustained suppression of cancer-related angiogenesis and tumor elimination. To elucidate HLX10's mode of action, we solved the structure of HLX10 in complex with PD-1 receptor. Detailed epitope analysis showed that HLX10 has a unique mode of recognition compared to the clinically approved PD1 antibodies Pembrolizumab and Nivolumab. Notably, HLX10's epitope was closer to Pembrolizumab's epitope than Nivolumab's epitope. However, HLX10 and Pembrolizumab showed an opposite heavy chain (HC) and light chain (LC) usage, which recognizes several overlapping amino acid residues on PD-1. We compared HLX10 to Nivolumab and Pembrolizumab and it showed similar or better bioactivity in vitro and in vivo, providing a rationale for clinical evaluation in cancer immunotherapy.


Conflict of interest statement

The study is about HLX10; a clinical lead currently in development in China and US. Henlius filled patent in US (US2021277122A1). There are no additional patents, products in development or marketed products associated with this research to declare. This work does not alter PLOS’s adherence policies on sharing data and materials.

Figures

Fig 1
Fig 1. Binding and PD-L1 ligand blocking of clG4 and Nivolumab antibodies.
ELISA assay comparing the binding of clG4 and Nivolumab reference to human PD-1 (a). ELISA assay comparing the ability of clG4 and Nivolumab reference to block binding of human PD-Ll to human PD-1 (b). Data points are means ± SD.
Fig 2
Fig 2. ELISA binding of HLX10 to PD-1 ECD from different species.
The cross-reactivity of HLX10 binding to PD-1 extracellular domains (ECDs) of (a) human, (b) cynomolgus monkey, (c) mouse and (d) rat were determined using ELISA. HLX04, an unrelated human antibody mAb, was used as a negative control. All data points represent the mean man antibody human.
Fig 3
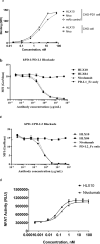
Fig 3. Binding and PD-L1/2 ligand blocking of HLX10.
(a) The binding of HLX10 antibody to either CHO-S or PD-1 transfected CHO-S cells was assessed by flow cytometry. The reference anti PD-1 antibody (Nivolumab) and anti-PD-L1 were used as the positive control and negative control (mAb control), respectively. Binding is determined as the mean fluorescent intensity (MFI) of staining. (b) The binding of HLX10 to PHA activated human T-cells was tested by flow cytometry. The ability of HLX10 to inhibit either PD-L1 (c) or PD-L2 (d) binding to cell surface PD-1 was assessed using flow cytometry. Anti-VEGF humanized antibody was used as the negative control (mAb control). All data points represent the means ± SD of triplicate. (e) PD-L1 blocking reporter assay. PDL-1 blocking activity is presented as increase in luciferase signal upon blocking by either HLX10 or Nivolumab reference antibody. Each datapoint represents mean ± SD of duplicate (n = 2).
Fig 4
Fig 4. IL-2 and IFN-γ dose–response curve of HLX10 in a mixed DC/CD4+ T-cell MLR assay.
(a, b) IL-2 and IFN-γ levels in the supernatants were determined by ELISA after 48 h and 5 days of culture, respectively. Data are presented as increase in cytokine levels relative to untreated cell (no Ab). Each datapoint represents mean ± SD (n = 3). (c, d) Effect of increasing doses of HLX10 and Nivolumab on CD4+ proliferation, as measured by CFSE staining by flow cytometry of two independent donor pairs. Data are presented (horizontal bar) as percent increase in CFSE stained population relative to untreated, no antibody and T-cell only controls. Each bar represents the mean ± SD. Nivolumab and HLX04 (anti-VEGF) were used as the positive control and negative controls, respectively. (e, f) Same MLR samples were assessed for IL-2 secretion by ELISA. Data are presented as increase in IL-2 levels relative to untreated, no antibody and T-cell only controls. Each graph represents a donor pair, and the horizontal bar is the mean ± SD.
Fig 5
Fig 5. Tumor growth inhibition of HLX10 in HT-29- and NCI-H292 -hPBMC co-mixture xenograft mice models.
The mice (n = 4/group) were engrafted subcutaneously with the mixture of human colon cancer cell lines HT29 (a, b), NCI-H292 (c, d), and freshly isolated human PBMC (cancer cells: PBMC = 2:1 and PBMC = 3:1, respectively). HLX10 (3, 10 and 30 mg/kg) antibody and vehicles were intraperitoneally injected into mice twice a week from day 1 as indicated (gray area). As controls, tumor cells only and HLX10 without hPBMC (30 mg/kg) were included. TGI are represented as the means ± SEM.
Fig 6
Fig 6. Growth of EMT breast cancer syngeneic tumors was measured in PD-1 knock-in mice following 6 injections (gray area) of either vehicle buffer (10 mL/Kg),or HLX10 (15 mg/kg), and 2 weeks after the last dose (day 25); n = 10 mice/group.
Average tumor size of vehicle control (plotted as dashed line) and individual growth curves (solid lines) of HLX10 are shown.
Fig 7
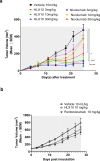
Fig 7. HLX10 in vivo antitumor activity compared to that of Nivolumab and Pembrolizumab.
(a) NOD/SCID mice engrafted with NCI-H292/hPBMC co-mixture (same as Fig 5C and 5D), and treated with vehicle, HLX10 or Nivolumab at the indicated doses; n = 8 mice/group. (b) CD34+ humanized NSG mice engrafted with MDA-MB-231-HM model and treated with vehicle, HLX10 or pembrolizumab (Keytruda®), intraperitoneally. Antibodies were administered at a dose level of 10 mg/kg on day 0 and the remaining doses were maintained at 5 mg/kg for a Q7D × 5 schedule (gray area). The mice in vehicle group were intraperitoneally injected with PBS following the same Q7D × 5 schedule. TGI are represented as the means ± SEM.
Fig 8
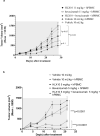
Fig 8. Anti-tumor activity of HLX10 and Bevacizumab in HT-29 and NCI-H292 hPBMC co-mixture xenograft models.
NOD/SCID mice engrafted with either HT-29/hPBMC or NCI-H292/hPBMC co-mixture models and treated with vehicle, HLX10, Bevacizumab or HLX10 + Bevacizumab combination at the indicated doses; n = 8 mice/group. Antibodies and vehicle controls were administered intraperitoneally twice per week until the end of the study. TGI are the means ± SEM.
Fig 9
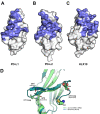
Fig 9. Interaction between HLX10 and hPD-1.
(a) HLX10 Fab adopts a typical immunoglobulin fold structure. Heavy chain and light chain are colored in lime and deep teal, respectively. Intra-molecular disulfide bonds are shown in magenta sticks. (b) Side view of binding interface between HLX10 and hPD-1. hPD-1 is represented as surface in white, with BC loop, C’D loop and FG loop in light orange, light blue and light green, respectively. HCDR1, HCDR2 and HCDR3 loops are colored in yellow, orange, and red, respectively, while LCDR1, LCDR2 and LCDR3 loops are colored in blue, green, and magenta, respectively. (c, d) Interaction within interface of CDRs loop of heavy chain and hPD-1. Arg86 of hPD-1 is involved in several hydrogen bonds and salt bridges with HLX10.
Fig 10
Fig 10. Binding epitope of HLX10 overlaps with PD-L1 and PD-L2.
(a-c) Comparison of binding interface of PD-L1, PD-L2 and HLX10. hPD-1 is represented as white surface with binding interface of binders (PD-L1, PD-L2 and HLX10) colored in slate. The C’D loop of hPD-1 is missing in hPD-1/hPD-L1 (PDB: 4ZQK) and hPD-1/hPD-L2 structures (PDB: 6UMT) because of structure flexibility. (d) rearrangement of CC’ loop of hPD-1 for HLX10 binding. Cα atom of Gln75 displays an 8 Å movement. Except C’C loop of hPD-1, there is no significant conformational change between apo and bound form of hPD-1 structures (overall backbone RMSD = 0.351Å). The C’D loop is missing (D85-D92) in apo form hPD-1 structure (PDB: 3RRQ) because of structure flexibility.
Fig 11
Fig 11. Comparison of binding epitope of HLX10 with Pembrolizumab and Nivolumab.
(a) Binding of Nivolumab is mainly located on the top (N-terminal extension, BC loop, and FG loop) of h-PD-1, whereas Pembrolizumab and HLX10 is located on CC’FG sheets of h-PD-1. hPD-1 is represented as surface in grey. PD-L1, Pembrolizumab, Nivolumab, and HLX10 are colored in slate, deep teal, lime and magenta ribbon, respectively (b) Residues of hPD-1 contribute to the interactions with different binders. hPD-1 is represented as white surface with binding epitope colored in slate. The residues which are involved in hydrogen bond, salt bridge and hydrophobic interaction are colored in blue, red and black, respectively.
Fig 12
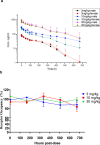
Fig 12. PD-1 receptor occupancy and PK profiles.
(a) Mean Serum drug concentration-time curves of HLX10 following a single IV-infusion at 3, 10 and 30 mg/kg (N = 3). (b) Receptor occupancy rate of HLX10 on PD-1 on the surface of T cells following a single IV-infusion at 3, 10 and 30 mg/kg, which was assessed by flow cytometry.
Fig 13
Fig 13. Human PD-1 receptor occupancy.
In vitro receptor occupancy rate of HLX10 on PD-1 on the surface of human activated T cells, which was assessed by flow cytometry.

Similar articles

Cited by

References

    1. Ai L., Xu A., and Xu J., Roles of PD-1/PD-L1 Pathway: Signaling, Cancer, and Beyond. Adv Exp Med Biol, 2020. 1248: p. 33–59. doi: 10.1007/978-981-15-3266-5_3 - DOI - PubMed
    1. Latchman Y., et al.., PD-L2 is a second ligand for PD-1 and inhibits T cell activation. Nat Immunol, 2001. 2(3): p. 261–8. doi: 10.1038/85330 - DOI - PubMed
    1. Dong H., et al.., Tumor-associated B7-H1 promotes T-cell apoptosis: a potential mechanism of immune evasion. Nat Med, 2002. 8(8): p. 793–800. doi: 10.1038/nm730 - DOI - PubMed
    1. Curiel T.J., et al.., Blockade of B7-H1 improves myeloid dendritic cell-mediated antitumor immunity. Nat Med, 2003. 9(5): p. 562–7. doi: 10.1038/nm863 - DOI - PubMed
    1. Arasanz H., et al.., PD1 signal transduction pathways in T cells. Oncotarget, 2017. 8(31): p. 51936–51945. doi: 10.18632/oncotarget.17232 - DOI - PMC - PubMed

Publication types

MeSH terms

Grants and funding

The authors received funding in the form of salary for this work from Shanghai Henlius Biotech, Inc. Hassan Issafras, Chi-Ling Tseng, Yunchih Cheng, Peihua Lin, Lisa Xiao, Yun-Ju Huang, Chih-Hsiang Tu, Ya-Chin Hsiao, Yen-Hsiao Chen, Chien-Hsin Ho, Ou Li, Yanling Wang, Sandra Chen, Zhenyu Ji, Eric Zhang, Yi-Ting Mao, Eugen Liu, Shumin Yang and Weidong Jiang were employees of Shanghai Henlius Biotech, Inc., P. R. China and its US subsidiary Hengenix Inc. Fremont, CA, US. Shilong Fan and Min Li received funding from Shanghai Henlius Biotech, Inc. but were not salaried employees. The funders had no role in study design, data collection and analysis, decision to publish, or preparation of the manuscript. No additional external funding was received for this study. The role of the authors as articulated in the ‘author contributions’ section.