. 2022 Mar 1;21(3):471-480.
doi: 10.1158/1535-7163.MCT-21-0565.

Local Treatment of a Pediatric Osteosarcoma Model with a 4-1BBL Armed Oncolytic Adenovirus Results in an Antitumor Effect and Leads to Immune Memory

Affiliations

Local Treatment of a Pediatric Osteosarcoma Model with a 4-1BBL Armed Oncolytic Adenovirus Results in an Antitumor Effect and Leads to Immune Memory

Naiara Martinez-Velez et al. Mol Cancer Ther. .

Abstract

Osteosarcoma is an aggressive bone tumor occurring primarily in pediatric patients. Despite years of intensive research, the outcomes of patients with metastatic disease or those who do not respond to therapy have remained poor and have not changed in the last 30 years. Oncolytic virotherapy is becoming a reality to treat local and metastatic tumors while maintaining a favorable safety profile. Delta-24-ACT is a replicative oncolytic adenovirus engineered to selectively target cancer cells and to potentiate immune responses through expression of the immune costimulatory ligand 4-1BB. This work aimed to assess the antisarcoma effect of Delta-24-ACT. MTS and replication assays were used to quantify the antitumor effects of Delta-24-ACT in vitro in osteosarcoma human and murine cell lines. Evaluation of the in vivo antitumor effect and immune response to Delta-24-ACT was performed in immunocompetent mice bearing the orthotopic K7M2 cell line. Immunophenotyping of the tumor microenvironment was characterized by immunohistochemistry and flow cytometry. In vitro, Delta-24-ACT killed osteosarcoma cells and triggered the production of danger signals. In vivo, local treatment with Delta-24-ACT led to antitumor effects against both the primary tumor and spontaneous metastases in a murine osteosarcoma model. Viral treatment was safe, with no noted toxicity. Delta-24-ACT significantly increased the median survival time of treated mice. Collectively, our data identify Delta-24-ACT administration as an effective and safe therapeutic strategy for patients with local and metastatic osteosarcoma. These results support clinical translation of this viral immunotherapy approach.


Figures

Figure 1. Characterization of Delta-24-ACT in osteosarcoma cell lines. A, Expression of 4-1BBL mRNA after infection with Delta-24-ACT at the indicated MOIs in K7M2 and 531MII cells (N = 3). B, Assessment of 4-1BBL protein expression by Western blot analysis. Cells were infected with Delta-24-ACT at the indicated MOIs, and 48 hours later, whole-cell lysates were collected. Grb2 was used as the protein loading control, and recombinant 4-1BBL protein was used as the positive control. C, Flow cytometric quantification of 4-1BBL expression in the membrane of murine (K7M2) and human (531MII) osteosarcoma cells infected with Delta-24-ACT at the indicated MOIs. D, Representative fluorescence micrographs of K7M2 cells 24 hours after infection with Delta-24-ACT or mock infection. 4-1BBL at the cell surface was detected by immunofluorescence (green). Samples were counterstained with DAPI (blue). E, Replication of Delta-24-ACT in murine K7M2 and human 531MII osteosarcoma cells. Cells were infected, and Delta-24-ACT replication was determined after 72 hours. The results are expressed as the mean viral titers ± SDs (N = 3). F, Oncolytic effect of Delta-24-ACT and Delta-24-RGD on murine and human osteosarcoma cells. To quantify the oncolytic effect of the viruses, cells were infected at the indicated MOIs, and five days later, viability was evaluated by MTS assays. The values indicate the percentages of viable cells in infected cultures compared with those in noninfected cultures (mean ± SD). G, In vivo evaluation of 4-1BBL mRNA expression in orthotopic human osteosarcoma tumors. H, Assessment of 4-1BBL, E1A, and fiber expression in vivo in orthotopic human osteosarcoma tumors by Western blot analysis. A representative blot is shown.
Figure 1.
Characterization of Delta-24-ACT in osteosarcoma cell lines. A, Expression of 4-1BBL mRNA after infection with Delta-24-ACT at the indicated MOIs in K7M2 and 531MII cells (N = 3). B, Assessment of 4-1BBL protein expression by Western blot analysis. Cells were infected with Delta-24-ACT at the indicated MOIs, and 48 hours later, whole-cell lysates were collected. Grb2 was used as the protein loading control, and recombinant 4-1BBL protein was used as the positive control. C, Flow cytometric quantification of 4-1BBL expression in the membrane of murine (K7M2) and human (531MII) osteosarcoma cells infected with Delta-24-ACT at the indicated MOIs. D, Representative fluorescence micrographs of K7M2 cells 24 hours after infection with Delta-24-ACT or mock infection. 4-1BBL at the cell surface was detected by immunofluorescence (green). Samples were counterstained with DAPI (blue). E, Replication of Delta-24-ACT in murine K7M2 and human 531MII osteosarcoma cells. Cells were infected, and Delta-24-ACT replication was determined after 72 hours. The results are expressed as the mean viral titers ± SDs (N = 3). F, Oncolytic effect of Delta-24-ACT and Delta-24-RGD on murine and human osteosarcoma cells. To quantify the oncolytic effect of the viruses, cells were infected at the indicated MOIs, and five days later, viability was evaluated by MTS assays. The values indicate the percentages of viable cells in infected cultures compared with those in noninfected cultures (mean ± SD). G,In vivo evaluation of 4-1BBL mRNA expression in orthotopic human osteosarcoma tumors. H, Assessment of 4-1BBL, E1A, and fiber expression in vivo in orthotopic human osteosarcoma tumors by Western blot analysis. A representative blot is shown.
Figure 2. Delta-24-ACT mediates DAMP release in vitro. A and B, Concentrations of the DAMPs ATP and Hsp90α in supernatants obtained from osteosarcoma cell cultures 72 hours after infection with Delta-24-ACT at the corresponding IC50 values for each virus or mock infection. The bar graphs show the mean ± SD values (n = 3; ordinary one-way ANOVA with Tukey multiple comparison test). C, Representative fluorescence micrographs of K7M2 cells 4 hours after infection with Delta-24-ACT or mock infection. Calreticulin at the cell surface was detected by immunofluorescence (red). Cell membranes (green) and nuclei (blue) were counterstained with wheat germ agglutinin (WGA) and DAPI, respectively. D, Flow cytometric quantification of membrane calreticulin + cells after Delta-24-ACT or Delta-24-RGD infection. The bar graphs show the mean ± SD values (n = 3; ordinary one-way ANOVA with Tukey multiple comparison test).
Figure 2.
Delta-24-ACT mediates DAMP release in vitro. A and B, Concentrations of the DAMPs ATP and Hsp90α in supernatants obtained from osteosarcoma cell cultures 72 hours after infection with Delta-24-ACT at the corresponding IC50 values for each virus or mock infection. The bar graphs show the mean ± SD values (n = 3; ordinary one-way ANOVA with Tukey multiple comparison test). C, Representative fluorescence micrographs of K7M2 cells 4 hours after infection with Delta-24-ACT or mock infection. Calreticulin at the cell surface was detected by immunofluorescence (red). Cell membranes (green) and nuclei (blue) were counterstained with wheat germ agglutinin (WGA) and DAPI, respectively. D, Flow cytometric quantification of membrane calreticulin + cells after Delta-24-ACT or Delta-24-RGD infection. The bar graphs show the mean ± SD values (n = 3; ordinary one-way ANOVA with Tukey multiple comparison test).
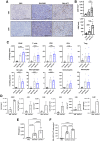
Figure 3. Administration of Delta-24-ACT results in immune cell infiltration and the production of proinflammatory cytokines. Osteosarcoma tumors were generated by intratibial injection of K7M2 cells, and PBS, Delta-24-RGD, or Delta-24-ACT was administered intratumorally 10 days after cell implantation. Animals were sacrificed on day 17 after cell implantation. A, Representative images (scale bar, 100 μm) of CD3 and CD8 immunostaining in osteosarcoma tumors from control mice or virus-treated mice. B, Quantification of CD3+ and CD8+ cell infiltration per mm2 in osteosarcoma tumors (n = 6–8). P values were calculated using two-tailed Student t test. C, Flow cytometric analysis of immune cell populations within the TIL population in the tibias of mice bearing intratibial K7M2 tumors and treated with Delta-24-RGD or Delta-24-ACT. The bars indicate the mean ± SD values (N = 4/5). D, Flow cytometric analysis of immune cell populations within the TIL population in the tibias of mice bearing intratibial K7M2 tumors and treated with Delta-24-ACT. The bars indicate the mean ± SD values (N = 3); Mann–Whitney test. E, Quantification of IFNγ production by ELISA after 72 hours of coculture of K7M2 cells with splenocytes isolated from mice treated with PBS or the different viruses. The data are presented as the median ± SD values (n = 5). One-way ANOVA test was used for comparison between control and treated mice. F, Quantification of IFNγ spot-forming cells per 4 × 10⁴ splenocytes isolated from control and Delta-ACT–treated animals and cocultured with tumor cells. P values were calculated using one-way ANOVA.
Figure 3.
Administration of Delta-24-ACT results in immune cell infiltration and the production of proinflammatory cytokines. Osteosarcoma tumors were generated by intratibial injection of K7M2 cells, and PBS, Delta-24-RGD, or Delta-24-ACT was administered intratumorally 10 days after cell implantation. Animals were sacrificed on day 17 after cell implantation. A, Representative images (scale bar, 100 μm) of CD3 and CD8 immunostaining in osteosarcoma tumors from control mice or virus-treated mice. B, Quantification of CD3+ and CD8+ cell infiltration per mm2 in osteosarcoma tumors (n = 6–8). P values were calculated using two-tailed Student t test. C, Flow cytometric analysis of immune cell populations within the TIL population in the tibias of mice bearing intratibial K7M2 tumors and treated with Delta-24-RGD or Delta-24-ACT. The bars indicate the mean ± SD values (N = 4/5). D, Flow cytometric analysis of immune cell populations within the TIL population in the tibias of mice bearing intratibial K7M2 tumors and treated with Delta-24-ACT. The bars indicate the mean ± SD values (N = 3); Mann–Whitney test. E, Quantification of IFNγ production by ELISA after 72 hours of coculture of K7M2 cells with splenocytes isolated from mice treated with PBS or the different viruses. The data are presented as the median ± SD values (n = 5). One-way ANOVA test was used for comparison between control and treated mice. F, Quantification of IFNγ spot-forming cells per 4 × 10⁴ splenocytes isolated from control and Delta-ACT–treated animals and cocultured with tumor cells. P values were calculated using one-way ANOVA.
Figure 4. Administration of Delta-24-ACT presents a safe toxicity profile. A, Mice were treated intratibially with mock (PBS) or Delta-24-ACT one or three times at the indicated doses. Mice from the different groups were weighed every 3 to 4 days until the end of the treatment period (25 days). The data are shown as the median ± SD for each group at each time point. B, Evaluation of biochemical parameters related to hepatic toxicity after intratumoral injection of Delta-24-ACT. Mice were treated with mock or virus, and serum samples were collected 3 days later. Several parameters, including ALT (U/L) and AST (U/L) levels, were measured to monitor hepatic injury. C, Histologic analysis of the livers of mice bearing orthotopic murine osteosarcoma tumors and treated locally with 108 PFU Delta-24-ACT one or three times. Representative micrographs of H&E–stained (magnification, 100 μm) livers of mice from the indicated groups are shown. The images show no viral presence in mouse livers and no signs of hepatotoxicity.
Figure 4.
Administration of Delta-24-ACT presents a safe toxicity profile. A, Mice were treated intratibially with mock (PBS) or Delta-24-ACT one or three times at the indicated doses. Mice from the different groups were weighed every 3 to 4 days until the end of the treatment period (25 days). The data are shown as the median ± SD for each group at each time point. B, Evaluation of biochemical parameters related to hepatic toxicity after intratumoral injection of Delta-24-ACT. Mice were treated with mock or virus, and serum samples were collected 3 days later. Several parameters, including ALT (U/L) and AST (U/L) levels, were measured to monitor hepatic injury. C, Histologic analysis of the livers of mice bearing orthotopic murine osteosarcoma tumors and treated locally with 108 PFU Delta-24-ACT one or three times. Representative micrographs of H&E–stained (magnification, 100 μm) livers of mice from the indicated groups are shown. The images show no viral presence in mouse livers and no signs of hepatotoxicity.
Figure 5. Administration of Delta-24-ACT results in local and metastatic efficacy effect in a murine osteosarcoma model. A, Analyses of tumor burden development in the PBS-treated (control group) and Delta-24-ACT–treated groups. Tumor volume in mouse tibias was measured on different days until the end of the experiment. B, Survival curves. The graphs show the overall survival of mice treated with Delta-24-ACT (blue line) or PBS (black line). C, Evaluation of lung metastasis using micro-CT. Quantification of the normal lung parenchyma using micro-CT. D, The long-term survivors from the Delta-24-ACT–treated group were subjected to rechallenge with K7M2 cells in the contralateral tibia and compared with control untreated mice (naïve). Analyses of tumor burden development in the naïve-treated (control group) and Delta-24-ACT–treated groups. Tumor volume in mouse tibias was measured on different days until the end of the experiment. E, Kaplan–Meier survival curves of the long-term survivors from the Delta-24-ACT–treated group subjected to a rechallenge with K7M2 cells in the contralateral tibia and compared with control untreated mice. F, Representative macroscopic images and H&E-stained sections of tibias from PBS- or Delta-24-ACT–treated mice. G, Differences in tumor growth shown as percentages in comparison with the control groups. H, Evaluation of lung metastasis using micro-CT. Representative 3D image reconstruction of the normal lung parenchyma and corresponding histologic macroscopic images of tumors in PBS- and Delta-24-ACT–treated animals (left). Quantification of the normal lung parenchyma using micro-CT (right). I, Kaplan–Meier survival curves of Delta-24-ACT (107 pfu)-treated and control (PBS)-treated immunodeficient (athymic nude) mice (n = 11, both groups) bearing intratibial K7M2 tumors. The P value was calculated with the log-rank test.
Figure 5.
Administration of Delta-24-ACT results in local and metastatic efficacy effect in a murine osteosarcoma model. A, Analyses of tumor burden development in the PBS-treated (control group) and Delta-24-ACT–treated groups. Tumor volume in mouse tibias was measured on different days until the end of the experiment. B, Survival curves. The graphs show the overall survival of mice treated with Delta-24-ACT (blue line) or PBS (black line). C, Evaluation of lung metastasis using micro-CT. Quantification of the normal lung parenchyma using micro-CT. D, The long-term survivors from the Delta-24-ACT–treated group were subjected to rechallenge with K7M2 cells in the contralateral tibia and compared with control untreated mice (naïve). Analyses of tumor burden development in the naïve-treated (control group) and Delta-24-ACT–treated groups. Tumor volume in mouse tibias was measured on different days until the end of the experiment. E, Kaplan–Meier survival curves of the long-term survivors from the Delta-24-ACT–treated group subjected to a rechallenge with K7M2 cells in the contralateral tibia and compared with control untreated mice. F, Representative macroscopic images and H&E-stained sections of tibias from PBS- or Delta-24-ACT–treated mice. G, Differences in tumor growth shown as percentages in comparison with the control groups. H, Evaluation of lung metastasis using micro-CT. Representative 3D image reconstruction of the normal lung parenchyma and corresponding histologic macroscopic images of tumors in PBS- and Delta-24-ACT–treated animals (left). Quantification of the normal lung parenchyma using micro-CT (right). I, Kaplan–Meier survival curves of Delta-24-ACT (107 pfu)-treated and control (PBS)-treated immunodeficient (athymic nude) mice (n = 11, both groups) bearing intratibial K7M2 tumors. The P value was calculated with the log-rank test.

Comment in

  • Mol Cancer Ther. 21:395.
  • Mol Cancer Ther. 21:395.

Similar articles

Cited by

References

    1. Mirabello L, Troisi RJ, Savage SA. Osteosarcoma incidence and survival rates from 1973 to 2004: Data from the surveillance, epidemiology, and end results program. Cancer 2009;115:1531–43. - PMC - PubMed
    1. Morrow JJ, Khanna C. Osteosarcoma genetics and epigenetics: Emerging biology and candidate therapies. Crit Rev Oncog 2015;20:173–97. - PMC - PubMed
    1. Chou AJ, Gorlick R. Chemotherapy resistance in osteosarcoma: current challenges and future directions. Expert Rev Anticancer Ther 2006;6:1075–85. - PubMed
    1. Fueyo J, Alemany R, Gomez-Manzano C, Fuller GN, Khan A, Conrad CA, et al. . Preclinical characterization of the antiglioma activity of a tropism-enhanced adenovirus targeted to the retinoblastoma pathway. J Natl Cancer Inst 2003;95:652–60. - PubMed
    1. Suzuki K, Alemany R, Yamamoto M, Curie DT. The presence of the adenovirus E3 region improves the oncolytic potency of conditionally replicative adenoviruses. Clin Cancer Res 2002;8:3348–59. - PubMed

Publication types