. 2021 Dec 28;37(13):110182.
doi: 10.1016/j.celrep.2021.110182.

Alzheimer's vulnerable brain region relies on a distinct retromer core dedicated to endosomal recycling

Affiliations

Alzheimer's vulnerable brain region relies on a distinct retromer core dedicated to endosomal recycling

Sabrina Simoes et al. Cell Rep. .

Abstract

Whether and how the pathogenic disruptions in endosomal trafficking observed in Alzheimer's disease (AD) are linked to its anatomical vulnerability remain unknown. Here, we began addressing these questions by showing that neurons are enriched with a second retromer core, organized around VPS26b, differentially dedicated to endosomal recycling. Next, by imaging mouse models, we show that the trans-entorhinal cortex, a region most vulnerable to AD, is most susceptible to VPS26b depletion-a finding validated by electrophysiology, immunocytochemistry, and behavior. VPS26b was then found enriched in the trans-entorhinal cortex of human brains, where both VPS26b and the retromer-related receptor SORL1 were found deficient in AD. Finally, by regulating glutamate receptor and SORL1 recycling, we show that VPS26b can mediate regionally selective synaptic dysfunction and SORL1 deficiency. Together with the trans-entorhinal's unique network properties, hypothesized to impose a heavy demand on endosomal recycling, these results suggest a general mechanism that can explain AD's regional vulnerability.

Keywords: Alzheimer’s disease; VPS26b; endosomal trafficking; retromer; trans-entorhinal cortex.


Conflict of interest statement

Declaration of interests S.A.S. is a co-founder of Retromer Therapeutics, has equity in the company, and is a paid consultant to the company. In addition, S.A.S. has equity in Imij Technologies, an MRI-based company. G.D.P. is a full-time employee of Denali Therapeutics, Inc. O.M.A. has commercial interests in Retromer Therapeutics. Lastly, S.A.S., S.S., and Y.H.Q. are listed as co-inventors on Columbia University-owned patents that relate to retromer biomarkers and retromer drug discovery targets.

Figures
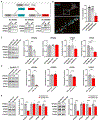
Figure 1.
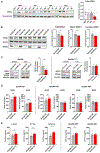
Figure 1.. VPS26b and VPS26a define distinct retromer cores
(A) An illustration of the proposed hypothesis for how the VPS26 paralogs form two separate retromer cores (top panel). Co-immunoprecipitation analysis of retromer proteins extracted from primary neuronal cultures using VPS35 (10 μg; left panel), VPS26a (10 μg; middle panel), and VPS26b (10μg; right panel) as baits (bottom panel) support this hypothesis. (B) A representative confocal image showing partial co-localization of both VPS26 paralogs (left panel), while quantitative colocalization studies, based on Pearson’s correlation, reveal that VPS35 shows a higher percentage of co-localization with each VPS26 paralog (n = 28–29 cells, from three independent experiments) (right panel). Scale bar, 10 μm. (C) Support for VPS26b forming a distinct retromer core is shown by how a primary depletion of VPS26b, in primary cultures derived from Vps26b heterozygous (HET) mice (n = 6) or Vps26b KO mice (n = 6) compared with Vps26b WT mice (n = 8), has no effect on VPS26a but causes a secondary reduction in VPS29 and VPS35, as summarized in the bar graphs and illustrated by representative immunoblots (in a one-way ANOVA with Tukey’s post hoc test’s two-sided analysis). (D) Support for VPS26a forming a distinct retromer core is shown by how a primary depletion of VPS26a, induced by infecting neurons from Vps26aflox/flox mice with a lentivirus-expressing Cre recombinase (Cre, n = 11), compared with neurons infected with a lentivirus expressing a catalytically dead Cre recombinase (ΔCre, n = 12), has no effect on VPS26b (p = 0.1480, in an unpaired t test with Welch’s correction) but causes a secondary reduction in VPS29 and VPS35, as summarized in the bar graphs and illustrated with representative immunoblots. Statistical analyses were performed using either unpaired two-sided Student’s t test, with Welch’s correction when required, or a non-parametric Mann-Whitney t test. (E) Western blots of hippocampus homogenates from Vps26a and Vps26b HET mice (Vps26a WT, n = 4; Vps26a HET, n = 11; Vps26b WT, n = 7; Vps26b HET, n = 7). Quantitative analysis of the western blots probed for retromer proteins shows that a primary deficiency in VPS26a (p = 0.0015) results in a secondary reduction VPS35 (p = 0.0037) and VPS29 (p = 0.0061) but not VPS26b (p = 0.8101), while a primary deficiency in VPS26b (p < 0.0001) results in a secondary reduction in VPS35 (p = 0.0004) and VPS29 (p = 0.0009) but not VPS26a (p = 0.6373), arguing in favor of separate retromer cores. All statistical analysis were performed using two-sided Student’s t test except for VPS26a in the Vps26a WT versus Vps26a HET analysis. Values denote mean ± SEM, where *p < 0.05, **p < 0.01, and ***p < 0.001. See also Figures S1 and S2.
Figure 2.
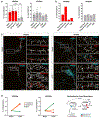
Figure 2.. VPS26b redistributes to recycling endosomes during neuronal stimulation
(A and B) Subcellular distribution of both VPS26 paralogs was performed using confocal and ultracryomicrotomy analyses. (A) Confocal microscopy quantifications based on Pearson’s correlation coefficient were obtained by analysis of 15–27 cells per group/condition. Kruskal-Wallis test with a Dunn’s post hoc test was used for the statistical analysis. Note that while VPS26a is broadly detected in all different compartments, VPS26b is highly enriched in early (EEA1) and recycling (Syntaxin13 and pulse-chase transferrin) endosomes, with less presence in the trans-Golgi network (Golgin97) and late endosomes (Rab7). Data expressed as mean ± SEM. *p < 0.05, **p < 0.01, and ***p < 0.001. (B) Immunogold labeling quantifications (percetange of gold particles) for VPS26b and VPS26a on ultrathin cryosections shown in Figure S3B. Localization of an equivalent number of gold particles in each sample was assessed relative to the indicated cell compartment. Note that whereas the bulk of VPS26b localizes to tubular-vesicular structures found at the vicinity of endosomes, VPS26a is broadly distributed among the different compartments. (C) Primary hippocampal neurons were stimulated with glycine for 5 min to induce cLTP, and the subcellular distribution of VPS26b and VPS26a was assessed by confocal microscopy using markers of early (EEA1) and recycling (Syntaxin13 and pulse-chase transferrin) endosomes. Compared to basal conditions, cLTP caused VPS26b to increase its co-localization with markers of the recycling endosomes (in an ANOVA analysis; pulse-chase transferrin: F[1,33] = 20.7, p = 6.9E−5; Syntaxin13: F[1,36] = 38.8, p = 3.5E−7) and caused VPS26a to increase its co-localization with a marker of early endosomes (EEA1: F[1,33] = 24.5, p = 2.1E−5), as illustrated in the representative confocal images of dendritic segments. Arrows indicate sites of co-localization. Scale bar, 10μm (top panel). (D) Co-localization studies based on Pearson’s correlation coefficient were used to generate the line graphs (n = 31–41 cells per condition, from four independent experiments) (left panels). An illustration of the changes in distribution observed post-stimulation for both VPS26 paralogs is shown (right panel). See also Figures S3 and S4.
Figure 3.
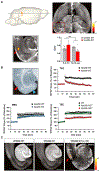
Figure 3.. The trans-entorhinal cortex differentially depends on VPS26b
(A) Functional MRI. Cerebral blood volume (CBV) fMRI maps were generated from the whole brain of 3- to 4-month-old Vps26b KO and their control littermates (n = 10 per group) and 12- to 14-month-old Vps26b KO mice and their control littermates (n = 9–10 per group) (top left panel). A voxel-based analysis across the whole brain revealed a significant genotype X age focal defect (voxel-wise p < 0.005; cluster-wise p < 0.05; cluster size >25 voxels) (top right panel), which upon magnification is found to localize to the TEC (bottom left panel) (color bar represents t values of the interaction; PRC, perirhinal cortex; EC, entorhinal cortex, HIP, hippocampus; red arrow indicates the TEC). A region of interest (ROI) analysis of the relative CBV (rCBV) at the TEC between Vps26b WT and Vps26b KO revealed a significant age-dependent worsening of rCBV in the TEC region (in an ANOVA analysis of the genotype × age interaction: F[3,38] = 16.08, p = 0.0003; n = 9–10 animals/genotype) (top right panel). (B) Electrophysiology. An example of an acute ex vivo brain slice whose precise anatomical coordinates were matched to the neuroimaging defects, illustrating electrode placement (top left panel) (TEC, red arrow; MEC, blue arrow). Mean fEPSP slopes, expressed as the percentage of baseline measured before and after high-frequency stimulation in the TEC (top right panel) and in the MEC (bottom left panel), showed that 12- to 14-month-old Vps26b KO mice, compared with control littermates (n = 6 per group), have LTP defects in the TEC (F(1,14) = 69.2; p < 0.001) but normal LTP in the MEC (F(1,14) = 0.93; p = 0.365) in a repeated-measures ANOVA post hoc Tukey test. Abnormal LTP was also found in the TEC of 18-month-old Vps26b HET mice but not in 18-month-old Vps26a HET mice (Vps26b HET versus WT: F(2,11) = 3.27; p = 0.005; Vps26a HET versus WT: p = 0.42) (post hoc Tukey) (bottom right panel). (C) By comparing co-registered brain slices of GluA1 immunostainings from 14-month-old Vps26b WT mice (n = 5) (left panel) and Vps26b KO mice (n = 5) (middle panel), a pixel-based analysis (“Vps26b WT versus KO”) showed that Vps26b KO mice have focal TEC reductions in GluA1 immunostaining levels (indicated by the red arrow) (right panel) in a two-sample t test; pixel-wise p < 0.001; color bar represents t values. Scale bar, 500 μm. See also Figure S5.
Figure 4.
Figure 4.. VPS26b mediates glutamate receptor trafficking from the recycling endosome
(A) Biotinylated cell-surface proteins were immunoprecipitated from total lysates of cortical neurons depleted for VPS26b (n = 11 biological replicates) or VPS26a (n = 5 biological replicates). Western blot analysis revealed that only VPS26b depletion results in a decrease in GluA1 cell-surface levels. (B) Representative confocal images of Vps26b KO neurons and Vps26b WT littermates subjected to pulse-chase transferrin uptake and stained for GluA1 and additional endosomal markers. Arrows indicate sites of co-localization. Scale bar, 10 μm (left panel). Quantitative colocalization analysis of GluA1 with early and recycling markers based on Pearson’s correlation coefficients revealed that VPS26b depletion results in an accumulation of GluA1 in recycling endosomes (transferrin: p < 0.0001; Syntaxin13: p < 0.0001) and to a lesser extent in early endosomes (EEA1: p = 0.032) in a non-parametric Kruskal-Wallis with Dunn’s post hoc test (n = 27–37 cells per group/condition, from three separate cultures) (right panel). (C) Cell-surface GluA1 levels were assessed by confocal microscopy in non-permeabilized cultured neurons incubated with an N-terminal GluA1 antibody in three conditions: Vps26b WT neurons infected with lentivirus expressing GFP alone (“Vps26b WT + GFP vector”), Vps26b KO neurons infected with lentivirus expressing GFP alone (“Vps26b KO + GFP vector”); and Vps26b KO neurons infected with lentivirus expressing VPS26b-GFP (“Vps26b KO + VPS26b-GFP”) (left panel). Scale bar, 10 μm (left panel). Mean fluorescence intensity values revealed that VPS26b repletion fully restored GluA1 surface localization in Vps26b KO neurons, as summarized in the bar graph (p < 0.0001), in a non-parametric Kruskal-Wallis with Dunn’s post hoc test (n = 25–26 neurons/condition, from four independent experiments) (right panel). Data expressed as mean ± SEM., *p < 0.05, **p < 0.01, and ***p < 0.001. See also Figure S6.
Figure 5.
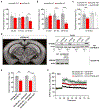
Figure 5.. Cognitive profiling supports VPS26b’s regional association
(A and B) Vps26b mice were tested in the novel object recognition (NOR) and object-context recognition (OCR) tasks at 3 time points, as described in STAR Methods. Data are expressed as mean ± SEM. A two-way ANOVA with Bonferroni’s post hoc test was used for the analysis. (A) In the NOR task targeting the perirhinal cortex (n = 10 animals for each of the 6 independent groups), a defect in memory performance was observed only in 12- to 14-month-old mice. (B) In the entorhinal-sensitive OCR task (n = 10–14 for each of the 6 independent groups), a two-way ANOVA with Bonferroni’s post hoc corrections revealed a significant genotype X age interaction that was driven by age-related worsening in the Vps26b KO mice: F(2,67) = 13.92, p < 0.001. (C) OCR defects were also found in 12- to 14-month-old Vps26b HET mice versus their WT littermates (n = 9–14 per independent group; p = 0.0016, in unpaired non-parametric Mann-Whitney t test) but not in 12- to 14-month-old Vps26a HET mice versus their WT littermates (n = 8 per group; p = 0.5077, in unpaired two-sided Student’s t test). (D) Schematic representation of the mouse brain showing the injection site in the lateral recess of the lateral ventricle (image 77, http://atlas.brain-map.org/atlas?atlas=602630314#atlas=602630314&structure=549&resolution=10.26&x=5700&y=4000&zoom=-3&plate=576989860) (left panel). VPS26b overexpression in the EC of WT mice (C57BL6/J): mice were injected at 3 months of age with AAV9-VPS26b at different doses and volume and harvested at 4 months of age (top right panel). VPS26b rescue in EC of Vps26b KO mice: mice were injected at ~3.7 months of age, and brains were harvested at ~7.7 months (bottom right panel). (E) Vps26b mice were tested in the OCR task. Data are expressed as mean ± SEM. As expected, a defect in memory performance was observed in the Vps26b KO mice compared with the Vps26b WT controls, both injected with AAV9-GFP (n = 4–6 per group, p = 0.0028, in unpaired two-sided Student’s t test). An OCR behavioral rescue was observed in Vps26b KO mice injected with AAV9-VPS26b compared with Vps26b KO mice injected with AAV9-GFP alone (n = 4–6 animals/group, p = 0.0044, in a one-way ANOVA with Tukey’s post hoc test [two-sided]). *p < 0.05, **p < 0.01, and ***p < 0.001. (F) Mean fEPSP slopes expressed as a percentage of baseline measured before and after high-frequency stimulation in the TEC region of Vps26b WT– AAV9-GFP (n = 5), Vps26b KO – AAV9-GFP (n = 6), and Vps26b KO – AAV9-VPS26b (n = 6) mice. In a two-way repeated measured ANOVA test with a Dunnett’s post hoc, a rescue of LTP defects is observed in Vps26b KO mice injected with AAV9-VPS26b-GFP compared with Vps26b KO mice injected with AAV9-GFP (Vps26b KO – AAV9-VPS26b-GFP: 151.6% ± 0.40% versus Vps26b KO – AAV9-GFP: 103.6% ± 0.95% versus Vps26b WT – AAV9-GFP: 178.3% ± 1.08%, F[2,14] = 6.427, p = 0.0105). See also Figure S7.
Figure 6.
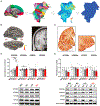
Figure 6.. VPS26b is the AD-targeted trans-entorhinal cortex
(A) 3D cortical surface. Cortical map. A 3D rendering of the cortical surface, parcellated into color-coded cortical regions, and shown in a medial view (first panel). Cortical flat map. The 3D surface of a unilateral cortical surface is shown flattened and rendered as a “flat-map” so that all cortical regions can be viewed in a single snapshot. Individual cortical regions are color-coded as labeled (second panel). Raw t value map comparing AD versus controls. A color-coded map of t values was generated comparing the cortical thickness of AD versus controls and co-varying for sex and age (color bar represents t values of the between-group comparisons; the dashed line indicates the threshold t = 12 to generate the thresholded t value map; see STAR Methods) (third panel). Thresholded t value map comparing AD versus controls. By thresholding the t value map, the most reliable cortical thinning in AD versus controls is localized to the vicinity of the TEC (fourth panel). (B) The Alzheimer’s-targeted TEC was isolated by performing a cortical thickness analysis of MRIs generated from 188 patients with AD and 169 healthy controls. Its longitudinal extent is indicated by the yellow arrows, where the entorhinal cortex abuts the amygdala (the highlighted blue region) (left panel). Pixels with the most reliable volumetric loss compared with controls are indicated in yellow/red (the color bar represents t values of the between-group comparisons), and the TEC defect is also shown on a coronal MRI slice (right panel). (C) A representative human postmortem brain slice matching the precise anatomical coordinates of the neuroimaging finding (left panel) with the subregions of the entorhinal cortex harvested for protein measurements shown in higher magnification (right panel): the TEC, the lateral EC (LEC), the intermediate EC (IEC), and the medial EC (MEC). (D) In healthy controls (n = 16), among the four retromer core proteins, the TEC was found differentially enriched in VPS26b (p < 0.0001) in a non-parametric Kruskal-Wallis with Dunn’s post hoc test, as summarized in the bar graph showing mean levels normalized to α-tubulin (top panel) and illustrated with representative immunoblots (bottom panel). (E) An ANOVA analysis revealed that, compared with age-matched healthy controls (n = 9), AD brains (n = 8) showed the most reliable reduction in the TEC’s VPS26b (F[1,16] = 12.96, p = 0.002), as summarized in the brain graphs showing normalized means (top graph) and illustrated with representative immunoblots (bottom panel) (stippled lines represent the mean of the healthy controls). Data expressed as mean ± SEM. *p < 0.05, **p < 0.01, and ***p < 0.001. See also Tables S1 and S2.
Figure 7.
Figure 7.. VPS26b mediates Alzheimer’s-related pathologies
(A) Western blotting analysis of different subregions of the entorhinal cortex from healthy controls and patients with AD immunoblotted for SORL1 protein is shown. TEC, trans-EC; LEC; lateral EC; IEC, intermediate EC; MEC, medial EC (left panel). An ANOVA analysis revealed that, compared with age-matched healthy controls (n = 9), AD brains (n = 8) showed a significant and reliable reduction of SORL1 in the TEC region compared with other EC subregions (F[1,16] = 12.32, p = 0.003, as summarized in the brain graphs showing normalized means). Stippled lines represent the mean of the healthy controls (right panel). (B) Quantitative analysis of SORL1 immunoblots from 7- to 9-month-old mice showing a reduction of SORL1 in the entorhinal cortex of Vps26b KO compared with Vps26b WT mice (total SORL1: p = 0.0160, in an unpaired two-sided Student’s t test; mature SORL1: p = 0.0185, in a on parametric Mann Whitney test; immature SORL1: p = 0.1167, in an unpaired two-sided Student’s t test). (C) Biotinylated cell-surface proteins were immunoprecipitated from total lysates of cortical neurons depleted for VPS26b (n = 8–9 biological replicates) or VPS26a (n = 7 biological replicates). Western blot analysis revealed that only VPS26b (p = 0.0274, in a two-tailed non-parametric Mann Whitney test), but not VPS26a (p = 0.9755, in a two-tailed non-parametric Mann Whitney test), depletion results in a decrease in SORL1 cell-surface levels. (D) Bar graph showing the levels of Aβ40 and Aβ42 levels measured by ELISA from entorhinal cortex homogenates harvested from Vps26b KO mice and control littermates at 6–7 months (Aβ40 measurements: Vps26b WT [n = 9] versus Vps26b KO [n = 9], p = 0.0002 in a two-tailed non-parametric Mann Whitney test; for Aβ42 measurements: Vps26b WT [n = 8] versus Vps26b KO [n = 10], p = 0.0013). Data expressed as mean ± SEM from 2–4 independent experiments (left panel). Bar graph showing the levels of entorhinal Aβ40 and Aβ42 measured by ELISA harvested from Vps26b mice (Aβ40 measurements: Vps26b WT [n = 12] versus Vps26b HET [n = 16], p = 0.0011; Aβ42 measurements: Vps26b WT [n = 16] versus Vps26b HET [n = 20], p = 0.1203). Vps26a mice (Aβ40 measurements: Vps26a WT [n = 20] versus Vps26a HET [n = 19], p = 0.8886; Aβ42 measurements: Vps26a WT [n = 15] versus Vps26a HET [n = 15], p = 0.8059). Two-tailed unpaired Student’s t test was used for the statistical analysis (right panel). (E) Bar graph showing tau CSF levels measured by Simoa technology from Vps26b KO mice and control littermates at 3–4 months: Vps26b WT (n = 10) versus Vps26b KO (n = 10), p = 0.0226, in a two-tailed unpaired Student’s t test; 6–7 months: Vps26b WT (n = 9) versus Vps26b KO (n = 9), in a two-tailed unpaired Student’s t test, p = 0.0056, in a non-parametric Mann Whitney test; and 12–14 months: Vps26b WT (n = 9) versus Vps26b KO (n = 9), **p = 0.0012, in a two-tailed unpaired Student’s t test (left panel). (F) Bar graph showing tau CSF levels measured by Simoa technology from Vps26 HET mice at 9–12 months. Vps26b mice (Vps26b WT[n = 7] versus Vps26b HET [n = 10], p = 0.0270) and Vps26a mice (Vps26a WT [n = 13] versus Vps26a HET [n = 10], p = 0.4169). Two-tailed unpaired Student’s t test was used for all statistical analysis (right panel). Data expressed as mean ± SEM. *p < 0.05, **p < 0.01, and ***p < 0.001.

Similar articles

Cited by

References

    1. Adams JN, Maass A, Harrison TM, Baker SL, and Jagust WJ (2019). Cortical tau deposition follows patterns of entorhinal functional connectivity in aging. Elife 8, e49132. - PMC - PubMed
    1. Alamed J, Wilcock DM, Diamond DM, Gordon MN, and Morgan D (2006). Two-day radial-arm water maze learning and memory task; robust resolution of amyloid-related memory deficits in transgenic mice. Nat. Protoc 1, 1671–1679. - PubMed
    1. Andersen OM, Bogh N, Landua AM, Ploen GG, Jensen AM, Monti G, Ulhon BP, Nyengaard JR, Jacobsen K, Jorgensen M, et al. (2021). In vivo evidence that SORL1, encoding the endosomal recycling receptor SORLA, can function as a casual gene in Alzheimer’s Disease. bioRxiv. 10.1101/2021.07.13.452149. - DOI
    1. Angulo SL, Henzi T, Neymotin SA, Suarez MD, Lytton WW, Schwaller B, and Moreno H (2020). Amyloid pathology-produced unexpected modifications of calcium homeostasis in hippocampal subicular dendrites 16, 251–261. - PubMed
    1. Attar N, and Cullen PJ (2010). The retromer complex. Adv. Enzyme Regul 50,216–236. - PubMed

Publication types

MeSH terms