. 2021 Dec 17;22(24):13576.
doi: 10.3390/ijms222413576.

CXCR4 and CXCR7 Inhibition Ameliorates the Formation of Platelet-Neutrophil Complexes and Neutrophil Extracellular Traps through Adora2b Signaling

Affiliations

CXCR4 and CXCR7 Inhibition Ameliorates the Formation of Platelet-Neutrophil Complexes and Neutrophil Extracellular Traps through Adora2b Signaling

Kristian-Christos Ngamsri et al. Int J Mol Sci. .

Abstract

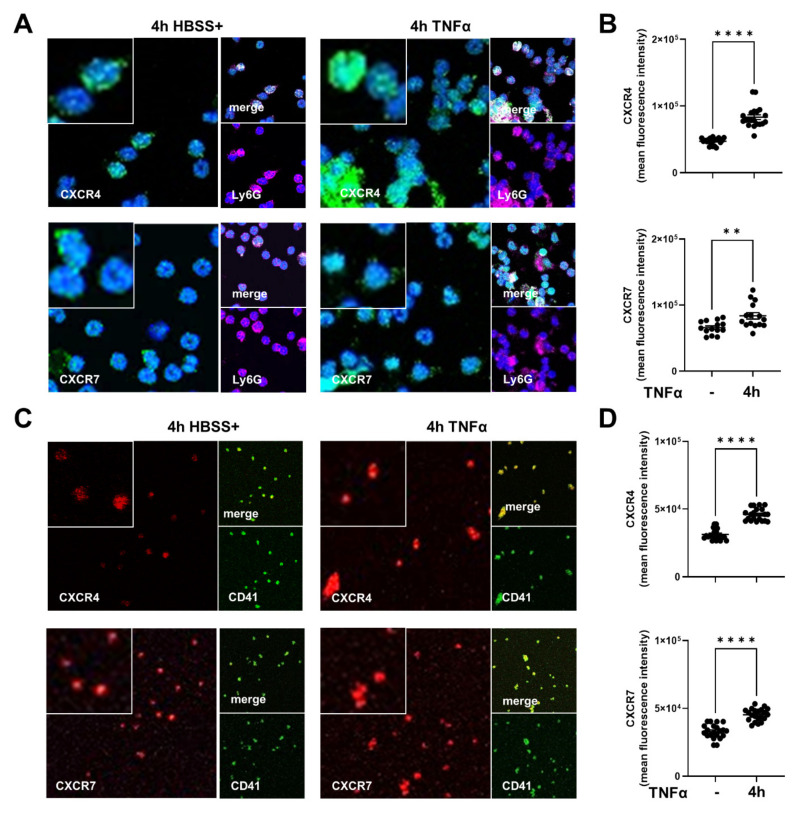
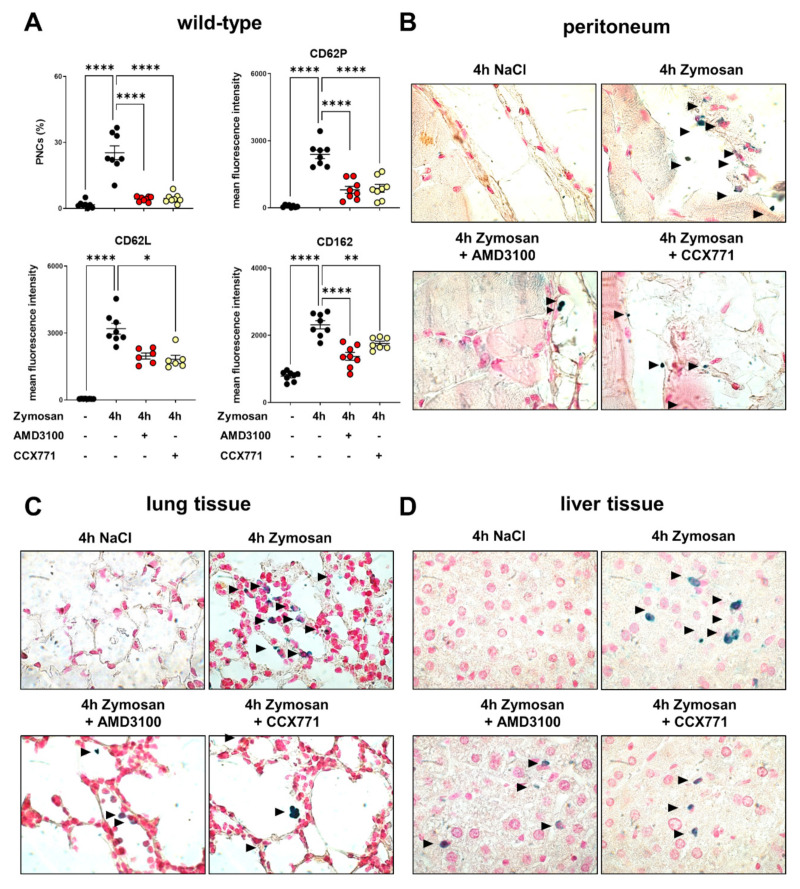
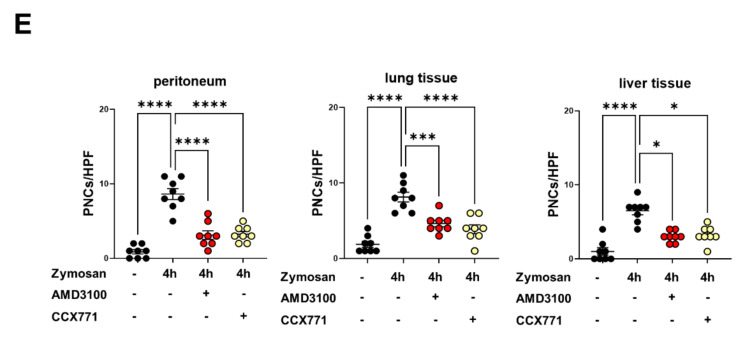
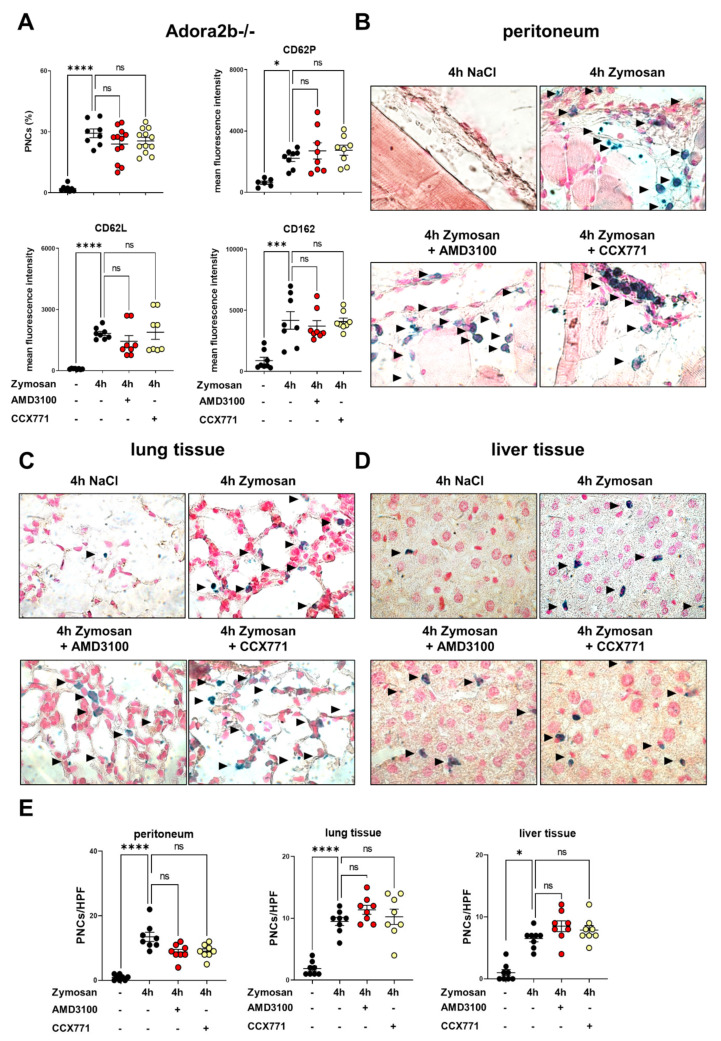
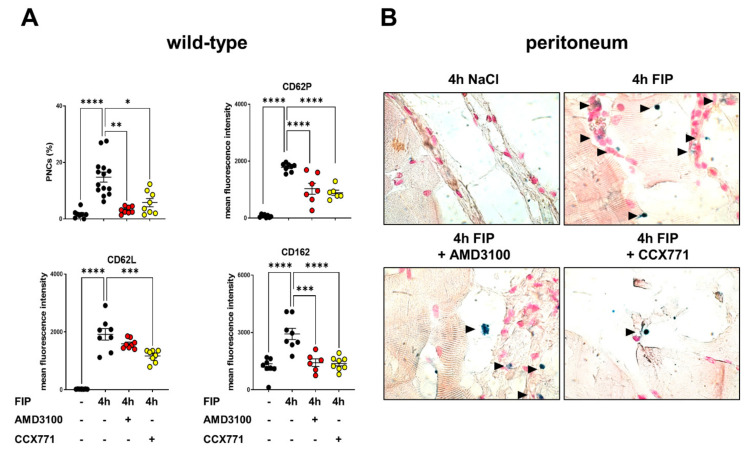
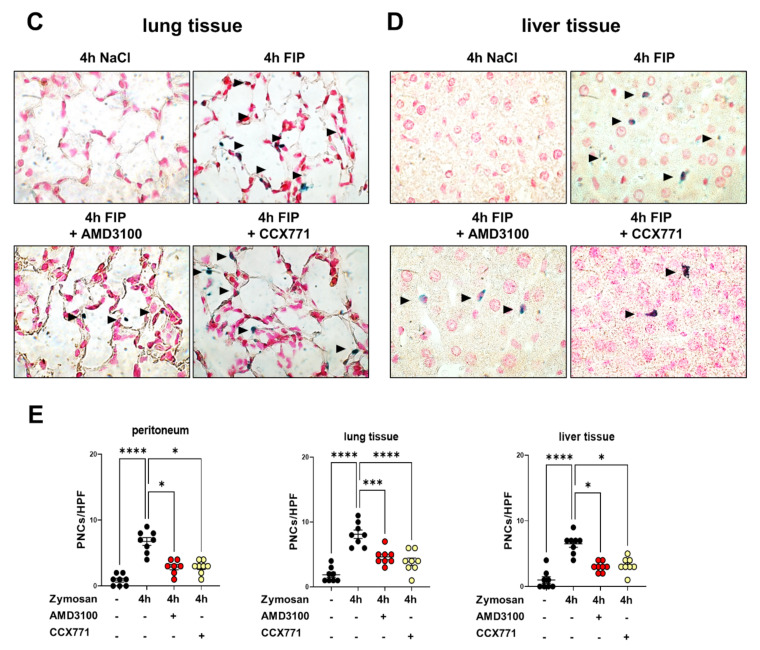
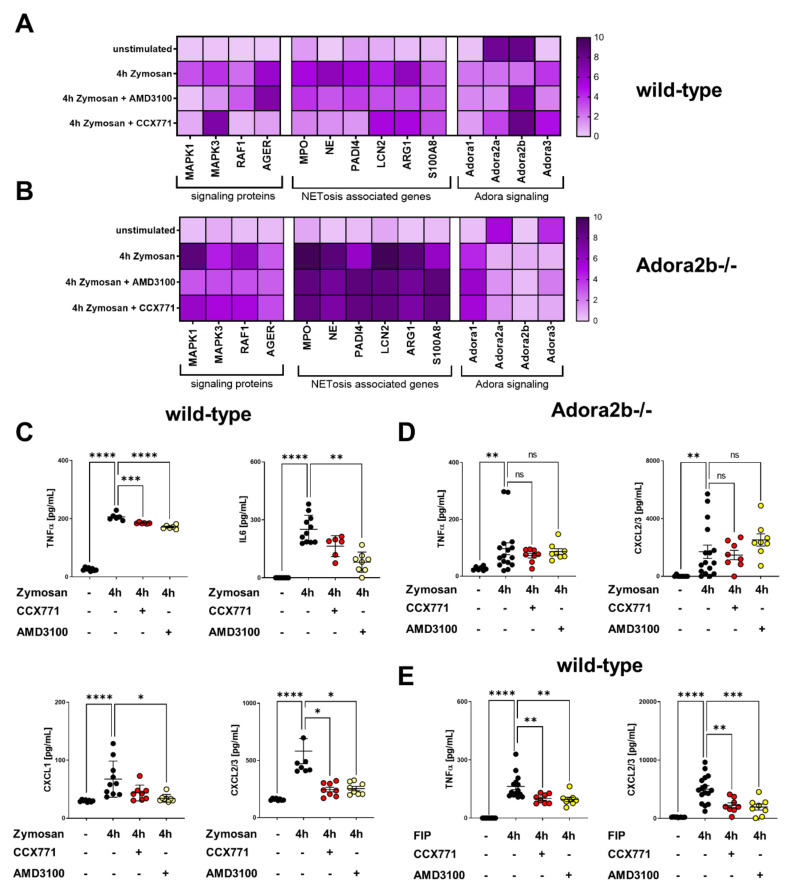
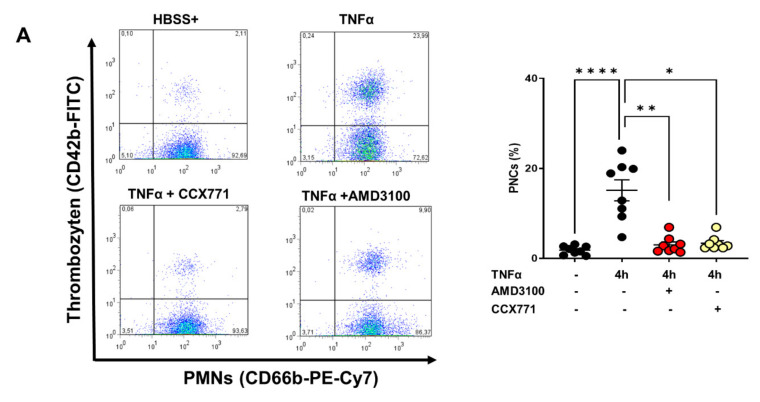
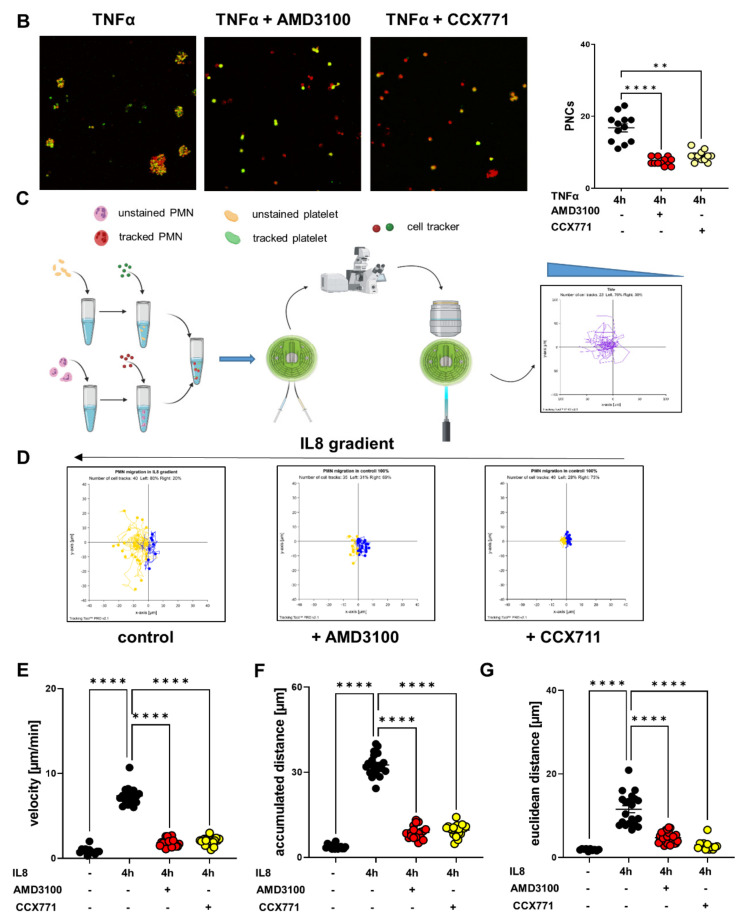
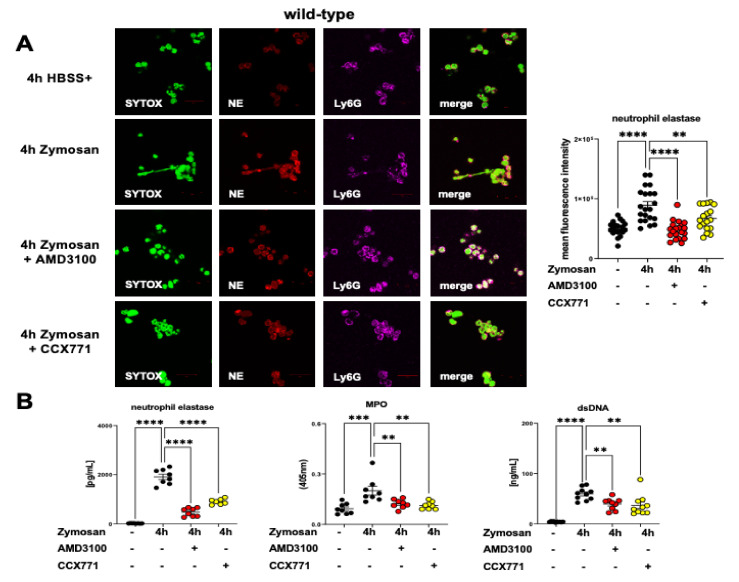
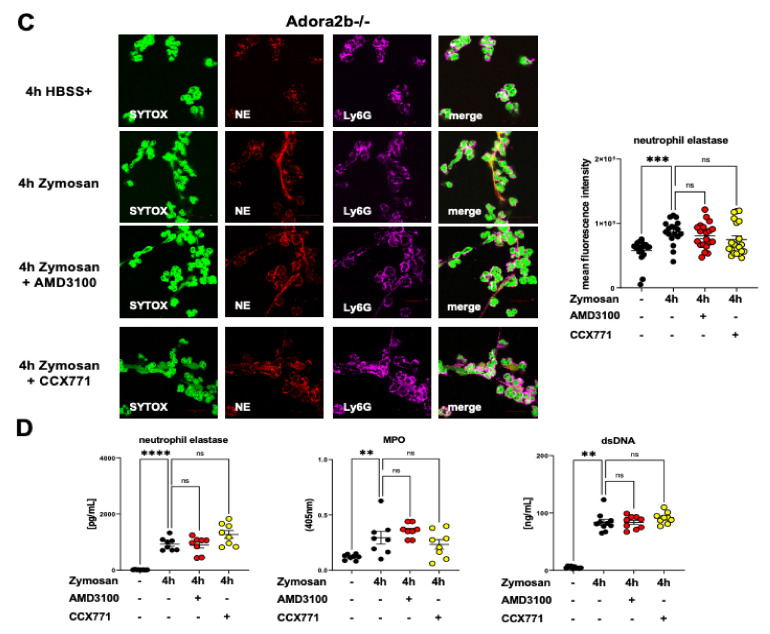
Peritonitis and peritonitis-associated sepsis are characterized by an increased formation of platelet-neutrophil complexes (PNCs), which contribute to an excessive migration of polymorphonuclear neutrophils (PMN) into the inflamed tissue. An important neutrophilic mechanism to capture and kill invading pathogens is the formation of neutrophil extracellular traps (NETs). Formation of PNCs and NETs are essential to eliminate pathogens, but also lead to aggravated tissue damage. The chemokine receptors CXCR4 and CXCR7 on platelets and PMNs have been shown to play a pivotal role in inflammation. Thereby, CXCR4 and CXCR7 were linked with functional adenosine A2B receptor (Adora2b) signaling. We evaluated the effects of selective CXCR4 and CXCR7 inhibition on PNCs and NETs in zymosan- and fecal-induced sepsis. We determined the formation of PNCs in the blood and, in addition, their infiltration into various organs in wild-type and Adora2b-/- mice by flow cytometry and histological methods. Further, we evaluated NET formation in both mouse lines and the impact of Adora2b signaling on it. We hypothesized that the protective effects of CXCR4 and CXCR7 antagonism on PNC and NET formation are linked with Adora2b signaling. We observed an elevated CXCR4 and CXCR7 expression in circulating platelets and PMNs during acute inflammation. Specific CXCR4 and CXCR7 inhibition reduced PNC formation in the blood, respectively, in the peritoneal, lung, and liver tissue in wild-type mice, while no protective anti-inflammatory effects were observed in Adora2b-/- animals. In vitro, CXCR4 and CXCR7 antagonism dampened PNC and NET formation with human platelets and PMNs, confirming our in vivo data. In conclusion, our study reveals new protective aspects of the pharmacological modulation of CXCR4 and CXCR7 on PNC and NET formation during acute inflammation.

Keywords: NETosis; PMNs; PNCs; SDF-1 receptors; acute inflammation; acute peritonitis; sepsis; thrombocytes.


Conflict of interest statement

The authors declare no conflict of interest. Chemocentryx provided the specific CXCR7 antagonist, CCX771, but was not involved in the study design or data evaluation.

Figures

Figure 1
Figure 1
CXCR4 and CXCR7 expression in platelets, neutrophils, and platelet–neutrophil complexes (PNCs) during acute inflammation. CXCR4 and CXCR7 positive platelets and polymorphonuclear neutrophils (PMNs) were detected and quantified using flow cytometry and immunofluorescence staining. (A) Identifying human CXCR4 and CXCR7 positive (green) neutrophils (Ly6G; magenta) without activation (Hank’s buffered salt solution with Ca2+/Mg2+; HBSS+) and four hours after TNFα stimulation by immunofluorescence (images are representative slides of n = three independent experiments; 63× magnification). Nuclei counterstaining was performed using DAPI and appears blue. (B) Mean fluorescence intensity (MFI) of CXCR4 and CXCR7 in PMNs was quantified using ImageJ (n = 15–20). (C) Visualization of the surface expression of CXCR4 and CXCR7 (red) in human platelets (CD41; green) without and with TNFα administration (four hours) was performed by immunofluorescence (images are representative slides of n = three independent experiments; 63× magnification). (D) Quantification of CXCR4 and CXCR7 fluorescence intensity in human platelets by ImageJ (n = 20). (E) Leukocytes and PMNs in blood samples were identified by a flow cytometry method. The leukocyte gate was defined by the typical appearance of leukocytes in the forward scatter/side scatter (FSC/SSC plot). Then, CD45 positive cells were identified as leukocytes and PMNs were marked by a Ly6G antibody. (F) Illustration of PNC gating in blood samples with or without zymosan stimulation. Ly6G positive cells were detected as PMNs and CD42b (platelet surface marker) positive PMNs were identified as PNCs. (G) Representative histograms and (H) mean fluorescence intensity (MFI) of CXCR4 and CXCR7 expression in PNC-related PMNs were evaluated four hours after saline injection (blue histogram) or four hours after zymosan administration (red histogram) (n = 8–16). (I) CXCR4 and CXCR7 expression in murine platelets four hours after saline (blue histogram) and four hours after zymosan exposure (red histogram), respectively, displayed as histograms. (J) MFI of CXCR4 and CXCR7 in PNC-related platelets was determined by flow cytometry (n = 8–16). Data are presented as mean ± SEM; ** p < 0.01; **** p < 0.0001. Statistical analyses were performed by unpaired t-tests or Mann–Whitney tests.
Figure 1
Figure 1
CXCR4 and CXCR7 expression in platelets, neutrophils, and platelet–neutrophil complexes (PNCs) during acute inflammation. CXCR4 and CXCR7 positive platelets and polymorphonuclear neutrophils (PMNs) were detected and quantified using flow cytometry and immunofluorescence staining. (A) Identifying human CXCR4 and CXCR7 positive (green) neutrophils (Ly6G; magenta) without activation (Hank’s buffered salt solution with Ca2+/Mg2+; HBSS+) and four hours after TNFα stimulation by immunofluorescence (images are representative slides of n = three independent experiments; 63× magnification). Nuclei counterstaining was performed using DAPI and appears blue. (B) Mean fluorescence intensity (MFI) of CXCR4 and CXCR7 in PMNs was quantified using ImageJ (n = 15–20). (C) Visualization of the surface expression of CXCR4 and CXCR7 (red) in human platelets (CD41; green) without and with TNFα administration (four hours) was performed by immunofluorescence (images are representative slides of n = three independent experiments; 63× magnification). (D) Quantification of CXCR4 and CXCR7 fluorescence intensity in human platelets by ImageJ (n = 20). (E) Leukocytes and PMNs in blood samples were identified by a flow cytometry method. The leukocyte gate was defined by the typical appearance of leukocytes in the forward scatter/side scatter (FSC/SSC plot). Then, CD45 positive cells were identified as leukocytes and PMNs were marked by a Ly6G antibody. (F) Illustration of PNC gating in blood samples with or without zymosan stimulation. Ly6G positive cells were detected as PMNs and CD42b (platelet surface marker) positive PMNs were identified as PNCs. (G) Representative histograms and (H) mean fluorescence intensity (MFI) of CXCR4 and CXCR7 expression in PNC-related PMNs were evaluated four hours after saline injection (blue histogram) or four hours after zymosan administration (red histogram) (n = 8–16). (I) CXCR4 and CXCR7 expression in murine platelets four hours after saline (blue histogram) and four hours after zymosan exposure (red histogram), respectively, displayed as histograms. (J) MFI of CXCR4 and CXCR7 in PNC-related platelets was determined by flow cytometry (n = 8–16). Data are presented as mean ± SEM; ** p < 0.01; **** p < 0.0001. Statistical analyses were performed by unpaired t-tests or Mann–Whitney tests.
Figure 2
Figure 2
Influence of CXCR4 and CXCR7 inhibition in platelet–neutrophil complex (PNC) formation and expression of PNC-related molecules in wild-type animals. (A) PNC formation and PNC−related adhesion molecules in the blood samples of wild-type mice (black circles) with and without zymosan administration (n = 8-12 mice per group). Effects of CXCR4 (AMD3100; red circles) and CXCR7 (CCX771; yellow circles) inhibition on PNC formation and on the surface expression of PNC-related selectins CD62P, CD162, and CD62L. (B) PNC sequestration into the peritoneal tissue, (C) lung, and (D) liver tissue was evaluated by immunohistochemical staining. Polymorphonuclear neutrophils (PMNs) and platelets were tackled with specific antibodies, so that PMNs appeared blue and PNCs appeared blue/black (black arrows) (images are representative slides of n = three slides from each animal; n = four mice per group; 63× magnification). (E) PNC counts were enumerated by light microscopy. PNCs from three representative high-power fields were counted from three different slides (n = four mice per group). Data are presented as mean ± SEM; * p < 0.05; ** p < 0.01; *** p < 0.001; **** p < 0.0001. Multiple group comparison was analyzed by one-way ANOVA and Bonferroni correction or Kruskal–Wallis test.
Figure 2
Figure 2
Influence of CXCR4 and CXCR7 inhibition in platelet–neutrophil complex (PNC) formation and expression of PNC-related molecules in wild-type animals. (A) PNC formation and PNC−related adhesion molecules in the blood samples of wild-type mice (black circles) with and without zymosan administration (n = 8-12 mice per group). Effects of CXCR4 (AMD3100; red circles) and CXCR7 (CCX771; yellow circles) inhibition on PNC formation and on the surface expression of PNC-related selectins CD62P, CD162, and CD62L. (B) PNC sequestration into the peritoneal tissue, (C) lung, and (D) liver tissue was evaluated by immunohistochemical staining. Polymorphonuclear neutrophils (PMNs) and platelets were tackled with specific antibodies, so that PMNs appeared blue and PNCs appeared blue/black (black arrows) (images are representative slides of n = three slides from each animal; n = four mice per group; 63× magnification). (E) PNC counts were enumerated by light microscopy. PNCs from three representative high-power fields were counted from three different slides (n = four mice per group). Data are presented as mean ± SEM; * p < 0.05; ** p < 0.01; *** p < 0.001; **** p < 0.0001. Multiple group comparison was analyzed by one-way ANOVA and Bonferroni correction or Kruskal–Wallis test.
Figure 3
Figure 3
Effects of Adora2b depletion on platelet−neutrophil complex (PNC) formation and pharmacological inhibition of CXCR4 and CXCR7 during zymosan-induced peritonitis. (A) PNC formation and PNC-related adhesion molecules in the blood samples of Adora2b−/− mice (black circles) with and without zymosan administration (n = 8−12 mice per group). Effects of CXCR4 (AMD3100; red circles) and CXCR7 (CCX771; yellow circles) inhibition on PNC formation and on surface expression of CD62P, CD162, and CD62L. (B) The extravasation of PNCs in the peritoneal tissue, (C) lung, and (D) liver tissue slides was determined by immunohistochemistry. Polymorphonuclear neutrophils (PMNs) and platelets were tackled with specific antibodies, so that PMNs appeared blue and PNCs appeared blue/black (black arrows) (images are representative slides of n = three slides from each animal; n = four mice per group; 63× magnification). (E) PNC counts were enumerated by light microscopy. PNCs from three representative high-power fields were counted from three different slides (n = four mice per group). Data are presented as mean ± SEM; * p < 0.05; *** p < 0.001; **** p < 0.0001, ns: not significant. Multiple group comparison was analyzed by one-way ANOVA and Bonferroni correction or Kruskal–Wallis test.
Figure 4
Figure 4
Role of CXCR4 and CXCR7 inhibition in platelet−neutrophil complex (PNC) formation during fecal-induced peritonitis and sepsis in wild-type animals. (A) Polymicrobial-induced PNC formation and expression of PNC−related molecules in the blood of wild-type mice (black circles) with and without fecal injection (n = 8 mice per group). CXCR4 (AMD3100; red circles) and CXCR7 (CCX771; yellow circles) inhibition ameliorated PNC formation and CD62P, CD162, and CD62L surface expression. (B) PNC migration into the peritoneal tissue, (C) lung, and (D) liver tissue was evaluated by immunohistochemical staining. Polymorphonuclear neutrophils (PMNs) and platelets were tackled with specific antibodies, so that PMNs appeared blue and PNCs appeared blue/black (black arrows) (images are representative slides of n = three slides from each animal; n = four mice per group; 63× magnification). (E) PNC infiltration was quantified by light microscopy. PNC formation from three representative high-power fields were counted from three different slides (n = three mice per group). Data are presented as mean ± SEM; * p < 0.05; ** p < 0.01; *** p < 0.001; **** p < 0.0001. Multiple group comparison was analyzed by one-way ANOVA and Bonferroni correction or Kruskal–Wallis test.
Figure 4
Figure 4
Role of CXCR4 and CXCR7 inhibition in platelet−neutrophil complex (PNC) formation during fecal-induced peritonitis and sepsis in wild-type animals. (A) Polymicrobial-induced PNC formation and expression of PNC−related molecules in the blood of wild-type mice (black circles) with and without fecal injection (n = 8 mice per group). CXCR4 (AMD3100; red circles) and CXCR7 (CCX771; yellow circles) inhibition ameliorated PNC formation and CD62P, CD162, and CD62L surface expression. (B) PNC migration into the peritoneal tissue, (C) lung, and (D) liver tissue was evaluated by immunohistochemical staining. Polymorphonuclear neutrophils (PMNs) and platelets were tackled with specific antibodies, so that PMNs appeared blue and PNCs appeared blue/black (black arrows) (images are representative slides of n = three slides from each animal; n = four mice per group; 63× magnification). (E) PNC infiltration was quantified by light microscopy. PNC formation from three representative high-power fields were counted from three different slides (n = three mice per group). Data are presented as mean ± SEM; * p < 0.05; ** p < 0.01; *** p < 0.001; **** p < 0.0001. Multiple group comparison was analyzed by one-way ANOVA and Bonferroni correction or Kruskal–Wallis test.
Figure 5
Figure 5
Inflammation and neutrophil extracellular traps (NET)-related gene expression and the release of inflammatory mediators. (A) The effects of specific CXCR4 and CXCR7 antagonism on the expression of different signaling pathways in polymorphonuclear neutrophils (PMNs) of wild-type and (B) Adora2b−/− mice are shown. Each row represents the normalized gene expression, each vertical column displays one gene, and each horizontal column illustrates a treatment group. Dark purple (upregulated) to light purple (unchanged) displays the level of gene expression (n = 6–8). (C) The release of TNFα, IL6, CXCL1, and CXCL2/3 into the plasma of wild-type mice in indicated conditions was measured without stimulation (black circles) and four hours after zymosan administration (black circles). Further, we evaluated the effects of CCX771 (red circles) and AMD3100 (yellow circles) on the zymosan-induced release of inflammatory mediators. (D) The plasmatic TNFα and CXCL2/3 release was measured in Adora2b−/− mice with and without zymosan stimulation (both black circles). Specific CXCR4 (AMD3100; yellow circles) and CXCR7 (CCX771; red circles) inhibition was evaluated in the plasma of Adora2b−/− four hours after zymosan stimulation. (E) The release of TNFα and CXCL2/3 four hours after fecal-induced peritonitis (FIP) in wild-type animals (black circles), AMD3100−treated (yellow circles) and CCX771−treated animals (red circles) (n = 6–12). Data are presented as mean ± SEM; * p < 0.05; ** p < 0.01; *** p < 0.001; **** p < 0.0001; ns: not significant. Multiple group comparison was analyzed by one-way ANOVA and Bonferroni correction or Kruskal–Wallis test.
Figure 6
Figure 6
Effects of CXCR4 and CXCR7 blockade on formation of human platelet–neutrophil complexes (PNCs). (A) Freshly isolated PMNs and platelets were stimulated with TNFα and PNC formation was quantified using flow cytometry. PNCs were determined by a positive signal for CD66b and CD42b (right upper square in the dot plot). Comparison of PNC formation four hours after TNFα stimulation (black circles) and after specific CXCR4 (red circles) and CXCR7 inhibition (yellow circles) (n = 8–12). (B) Immunofluorescence staining of freshly isolated human PMNs (red) and platelets (green), and visualization of TNFα-induced PNC formation. Quantification of the PNC counts per visualization field and comparison of TNFα-stimulated PNCs (black circles) and after CXCR4 (red circles) and CXCR7 blockade (yellow circles) (n = 12). (C) Schematic illustration of the CellDirector® staining method and migration assay. Fresh isolated human PMNs and platelets were tackled with red (PMNs) and green (platelets) cell tracker dyes. Subsequently, the stained cells were pooled and injected into the migration assay. The interleukin 8 (IL8)−related migratory behavior of the PNCs was observed by confocal microscopy. (D) Representative images of tracked PNCs’ migratory behavior upon an IL8 chemotactic gradient. Additionally, we quantified the influence of CXCR4 and CXCR7 blockade on IL8-related PNC migration. We also quantified the influence of CXCR4 and CXCR7 blockade on IL8-related PNC migration (n = 35–40 PNC counts). (E) Quantification of IL8-induced velocity, (F) accumulated distance, and (G) Euclidean distance of PNCs using the Tracking Tool™ Pro (Gradientech; Upsala; Sweden). Data are presented as mean ± SEM; * p < 0.05; ** p < 0.01; **** p < 0.0001. Multiple group comparison was analyzed by one-way ANOVA and Bonferroni correction or Kruskal–Wallis test.
Figure 6
Figure 6
Effects of CXCR4 and CXCR7 blockade on formation of human platelet–neutrophil complexes (PNCs). (A) Freshly isolated PMNs and platelets were stimulated with TNFα and PNC formation was quantified using flow cytometry. PNCs were determined by a positive signal for CD66b and CD42b (right upper square in the dot plot). Comparison of PNC formation four hours after TNFα stimulation (black circles) and after specific CXCR4 (red circles) and CXCR7 inhibition (yellow circles) (n = 8–12). (B) Immunofluorescence staining of freshly isolated human PMNs (red) and platelets (green), and visualization of TNFα-induced PNC formation. Quantification of the PNC counts per visualization field and comparison of TNFα-stimulated PNCs (black circles) and after CXCR4 (red circles) and CXCR7 blockade (yellow circles) (n = 12). (C) Schematic illustration of the CellDirector® staining method and migration assay. Fresh isolated human PMNs and platelets were tackled with red (PMNs) and green (platelets) cell tracker dyes. Subsequently, the stained cells were pooled and injected into the migration assay. The interleukin 8 (IL8)−related migratory behavior of the PNCs was observed by confocal microscopy. (D) Representative images of tracked PNCs’ migratory behavior upon an IL8 chemotactic gradient. Additionally, we quantified the influence of CXCR4 and CXCR7 blockade on IL8-related PNC migration. We also quantified the influence of CXCR4 and CXCR7 blockade on IL8-related PNC migration (n = 35–40 PNC counts). (E) Quantification of IL8-induced velocity, (F) accumulated distance, and (G) Euclidean distance of PNCs using the Tracking Tool™ Pro (Gradientech; Upsala; Sweden). Data are presented as mean ± SEM; * p < 0.05; ** p < 0.01; **** p < 0.0001. Multiple group comparison was analyzed by one-way ANOVA and Bonferroni correction or Kruskal–Wallis test.
Figure 7
Figure 7
Effects of CXCR4 and CXCR7 inhibition on neutrophil extracellular trap (NET) formation during acute inflammation on wild-type and Adora2b−/− neutrophils. (A) Freshly isolated bone marrow PMNs from wild-type and (C) Adora2b−/− animals were stimulated for four hours with zymosan (100 ng) or HBSS+. The effects of AMD3100 and CCX771 treatment on NETosis on wild-type PMNs were evaluated by immunofluorescence experiments. Intracellular and extracellular DNA was stained by SYTOX (green). Neutrophil elastase (NE) (red) was evaluated as a marker for NETosis, and neutrophils (magenta) were marked by a specific Ly6G antibody (63x magnification; representative images from three independent experiments). Fluorescence intensity of NE in PMNs was quantified using ImageJ (n = 15–20). (B) The myeloperoxidase (MPO), dsDNA, and NE release from wild-type and (D) Adora2b−/− PMNs were evaluated by ELISA with or without stimulation (black circles) and the effects of AMD3100 (yellow circles) and CCX771 (red circles) treatment. Data are presented as mean ± SEM; ** p < 0.01; *** p < 0.001; **** p < 0.0001; ns: not significant. Multiple group comparison was analyzed by one-way ANOVA and Bonferroni correction or Kruskal–Wallis test.
Figure 7
Figure 7
Effects of CXCR4 and CXCR7 inhibition on neutrophil extracellular trap (NET) formation during acute inflammation on wild-type and Adora2b−/− neutrophils. (A) Freshly isolated bone marrow PMNs from wild-type and (C) Adora2b−/− animals were stimulated for four hours with zymosan (100 ng) or HBSS+. The effects of AMD3100 and CCX771 treatment on NETosis on wild-type PMNs were evaluated by immunofluorescence experiments. Intracellular and extracellular DNA was stained by SYTOX (green). Neutrophil elastase (NE) (red) was evaluated as a marker for NETosis, and neutrophils (magenta) were marked by a specific Ly6G antibody (63x magnification; representative images from three independent experiments). Fluorescence intensity of NE in PMNs was quantified using ImageJ (n = 15–20). (B) The myeloperoxidase (MPO), dsDNA, and NE release from wild-type and (D) Adora2b−/− PMNs were evaluated by ELISA with or without stimulation (black circles) and the effects of AMD3100 (yellow circles) and CCX771 (red circles) treatment. Data are presented as mean ± SEM; ** p < 0.01; *** p < 0.001; **** p < 0.0001; ns: not significant. Multiple group comparison was analyzed by one-way ANOVA and Bonferroni correction or Kruskal–Wallis test.
Figure 8
Figure 8
The role of specific CXCR4 and CXCR7 antagonisms in human neutrophil extracellular trap (NET) formation. (A) Fresh isolated polymorphonuclear neutrophils (PMNs) from healthy volunteers were stimulated for four hours with zymosan (100 ng) or HBSS+. The effects of CXCR4 and CXCR7 inhibition on NET formation were evaluated by immunofluorescence experiments. DNA marked by SYTOX (green), neutrophil elastase (NE) (red), and CD66b (magenta) as a PMN marker were stained by specific antibodies (63× magnification; n = three from three independent experiments). NE fluorescence intensity in human PMNs was assessed by ImageJ (n = 15–20). (B) Additionally, we evaluated the myeloperoxidase (MPO) activity (green) and DNA (DAPI; blue) in human PMNs (CD66b; red) without and with zymosan stimulation. The effects of AMD3100 and CCX771 on MPO activity were detected by immunofluorescence experiments (63× magnification; n = three from three independent experiments). Mean fluorescence intensity of MPO in human PMNs was evaluated by ImageJ (n = 15–20). (C) The MPO, dsDNA, and NE concentration in supernatant from human PMNs were evaluated in vitro by ELISA with or without zymosan stimulation (both black circles). The effects of AMD3100 (yellow circles) and CCX771 (red circles) treatment on the release of MPO, dsDNA, and neutrophil elastase was determined (n = 8−16). Data are presented as mean ± SEM; * p < 0.05; ** p < 0.01; *** p < 0.001; **** p < 0.0001. Multiple group comparison was analyzed by one-way ANOVA and Bonferroni correction or Kruskal–Wallis test.

Similar articles

Cited by

References

    1. Nasa P., Juneja D., Singh O., Dang R., Arora V. Severe sepsis and its impact on outcome in elderly and very elderly patients admitted in intensive care unit. J. Intensive Care Med. 2012;27:179–183. doi: 10.1177/0885066610397116. - DOI - PubMed
    1. Coopersmith C.M., De Backer D., Deutschman C.S., Ferrer R., Lat I., Machado F.R., Martin G.S., Martin-Loeches I., Nunnally M.E., Antonelli M., et al. Surviving Sepsis Campaign: Research Priorities for Sepsis and Septic Shock. Crit. Care Med. 2018;46:1334–1356. doi: 10.1097/CCM.0000000000003225. - DOI - PubMed
    1. Cahilog Z., Zhao H., Wu L., Alam A., Eguchi S., Weng H., Ma D. The Role of Neutrophil NETosis in Organ Injury: Novel Inflammatory Cell Death Mechanisms. Inflammation. 2020;43:2021–2032. doi: 10.1007/s10753-020-01294-x. - DOI - PMC - PubMed
    1. Johansson D., Shannon O., Rasmussen M. Platelet and neutrophil responses to Gram positive pathogens in patients with bacteremic infection. PLoS ONE. 2011;6:e26928. doi: 10.1371/journal.pone.0026928. - DOI - PMC - PubMed
    1. Chatterjee M., Rath D., Gawaz M. Role of chemokine receptors CXCR4 and CXCR7 for platelet function. Biochem. Soc. Trans. 2015;43:720–726. doi: 10.1042/BST20150113. - DOI - PubMed

LinkOut - more resources